Wallacei 0/3
Wallacei
Wallacei is an evolutionary multi-objective optimization engine.
What is Wallacei?
Wallacei is a robust multi-objective optimization engine designed as a plugin for Grasshopper. Wallacei is developed by Mohammed Makki, Milad Showkatbakhsh and Yutao Song. Wallacei uses advanced evolutionary algorithms to enable the exploration and optimization of different, often very complex design solutions. It gives us, designers, architects, and engineers the ability to perform multi-objective optimization by analysing and visualizing large populations of design alternatives.

Examples of use can include façade panel optimization for low material cost, urban geometry optimization for lowest view obstruction, or geometry optimization for maximum daylight, or energy efficiency, etc. You can view additional resources and learn more about Wallacei and how to use it at the Learn Wallacei page.
The primary functions of Wallacei include:
- Optimization: Wallacei enables users to optimize multiple objectives simultaneously (up to 10), balancing competing criteria to identify the best design solutions.
- Data Analysis: The plugin offers data visualization tools, allowing users to examine the performance of different design iterations and understand the trade-offs between various objectives.
- Selection: Users can interactively select optimal solutions from the generated design population based on their specific needs and preferences.
- Integration: Seamlessly integrates with Grasshopper, allowing for the use of its parametric design capabilities along with Wallacei’s optimization algorithms.
Wallacei Installation
Wallacei can be installed as any other Grasshopper plugin. You can follow the tutorial below to understand how to install Grasshopper plugins, or you can directly download Wallacei at Food4Rhino.
Wallacei 1/3
Wallacei Overviewlink copied
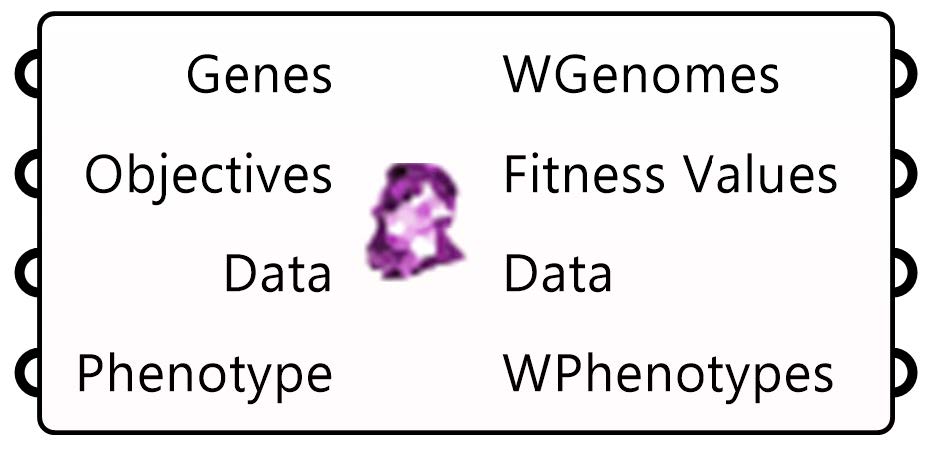
Wallacei X is the primary component of the Wallacei platform. Through Wallacei X, the user is able to run an evolutionary algorithm, analyse the results, run selection methods, export phenotypes, access the online forum and refer to the primer, all within one user interface. The components released in ‘Wallacei Analytics’ are all available within Wallacei.
Wallacei X component

Wallacei X employs the NSGA-2 algorithm (Deb et. al., 2001) as the primary evolutionary algorithm, and utilizes the K-means method as the clustering algorithm.
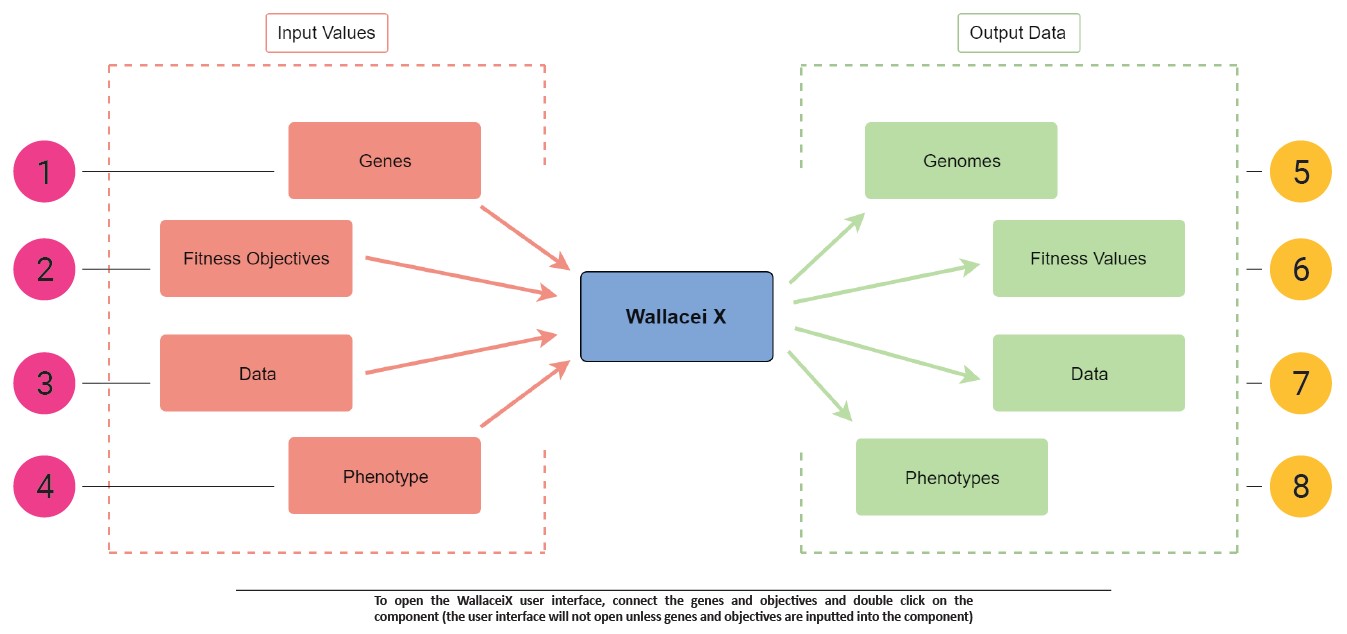
This main component can be expanded on in more detail below:

- Genes are comprised of sliders or gene pools. Those can be the design variables that can be adjusted to create new design variants. Rename the sliders/gene pools with prefix ‘wlc_’ for automated selection (by right clicking the Wallacei X component and clicking ‘Select all Sliders’).
- Fitness Objectives are values contained within a ‘number’ component (they have to be numbers). Those are the optimisation goals, values each design is tested against. It is generally recommended to try inputting maximum of 2-3 objectives, in order for optimisation to be reasonably fast. Rename the fitness objectives with prefix ‘wlc_’ for automated selection (by right clicking the Wallacei X component and clicking ‘Select all Objectives’).
- Data (input), any data type to be saved for every solution in the population (it is recommended only numerical or short text data is inputted to avoid CPU overload causing grasshopper/rhino to crash). This can be any additional data that we want to save along with each solution, useful for further visualization and analysis.
- Phenotypes (input) that will be exported through the solver. Any data type is accepted such as Breps, Meshes or Numbers (the phenotypes can be inputted after you run the simulation). Those can be geometries that can be used further for visualisation purposes.
- Genomes, this outputs the genomes of all solutions in the population. To access the Genome, use the ‘Decode Genome’ component to extract numerical values comprising each solution’s genome
- Fitness Value, this outputs the fitness values of all solutions in the population. The list structure is as follows {A;B}[i], where ‘A’ is the generation number, ‘B’ is the solution number and ‘i’ is the fitness values for each fitness objective
- Data (output), this outputs the input data of all solutions in the population.
- Phenotypes (output), this outputs the phenotypes of the exported solutions. To access the geometry within the phenotype, use the ‘Decode Phenotypes’ or ‘Distributor’ components, which will output the data into different streams (numbers, meshes, breps, etc.)

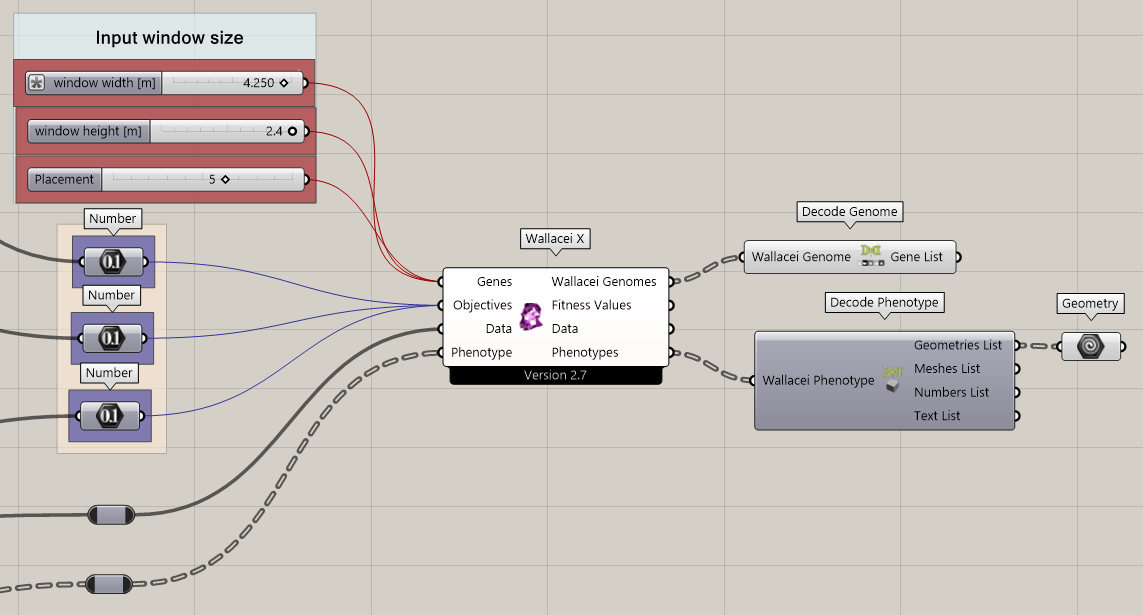
In practice, it can look like this:
Inside the Wallacei X component
After data is connected to the WallaceiX component, you can click it twice, and a new interface will pop out. It is divided into separate tabs:
- Wallacei Settings: Setup the simulation settings and monitor the progress of the simulation while its running
- Wallacei Analytics: Analyse the simulation results through the visualising the standard deviation, fitness values, and diamond chart for the population. Select solutions based on ranking and add them to ‘Export List’
- Wallacei Selection: Select solutions through analysing the simulation’s results according to multiple methods; including most repeated solutions, K-means clustering, Agglomerative Hierarchical Clustering and pareto front. Export the phenotypes for all the solutions in the ‘Export List’ to the GH canvas
- Wallacei Forum: Access the Wallacei grasshopper Group forum from within the user interface
- Wallacei Primer: Access the Wallacei Primer from within the user interface. Most of the information in this tutorial is drawn from it. In it you can find lots of basic and useful information about Wallacei.
Tab 1 – Wallacei Settings
Tab 1 of the Wallacei X user interface is the primary tab for setting up the simulation parameters before running the evolutionary algorithm.
Here, if needed, the basic settings can be changed before running the simulation. If everything is set up correctly, to run the simulation, just click the “Start” button. Once the simulation is running, various windows are useful to track the progress of the process.
Tab 2 – Wallacei Analytics
Tab 2 of the Wallacei X user interface is the primary tab for analysing the simulation’s results and cross referencing the different fitness objectives to one another. To start analysing the data, click ‘DRAW’.
In this tab users can analyze simulation results by drawing various charts (Diamond Fitness, Standard Deviation, Fitness Value, SD Trendline, and Mean Value Trendline) to visualize fitness objectives and trends. Users can also select specific solutions for detailed analysis, and already add solutions to an export list in Tab 3.
Tab 3 – Selection
Tab 3 of the Wallacei X user interface is the primary tab for analysing the results of the simulation for the purpose of selection and export. To start analysing through any of the provided methods, you must first ‘DRAW PARALLEL COORDINATE PLOT’.
Here you can utilize various analytic methods, perform unsupervised machine learning clustering on the results, and view Pareto front solutions. Selected solutions can be added to an export list for further analysis or export.
Wallacei 2/3
Tutorialslink copied
Getting Started
Examples
Wallacei 3/3
Useful links and readingslink copied
Learn & Forums
- Find the primer and related videos on Wallacei Learn
- Find frequently asked questions on McNeel Wallacei Forum
Installation
Find information on the Food4Rhino Wallacei download page or follow this tutorial below to learn how to install the plug-in in Rhino Grasshopper.
Write your feedback.
Write your feedback on "Wallacei"".
If you're providing a specific feedback to a part of the chapter, mention which part (text, image, or video) that you have specific feedback for."Thank your for your feedback.
Your feedback has been submitted successfully and is now awaiting review. We appreciate your input and will ensure it aligns with our guidelines before it’s published.
