Load CSV File to create Grasshopper Visualization
-
Intro
-
Design and Data Set File
-
Video: Loading CSV File and Creating Visualization of Rooms in Grasshopper
-
Load CSV data in Grasshopper
-
Randomly Select 3 Rooms per Label
-
Visualize the Rooms: Extract Data and Generate Geometry
-
Visualize the Rooms: Separate, Construct and Organize the Room Variations
-
Visualize the Rooms: Create and Position Labels
-
Conclusion and Final Script
Information
| Primary software used | Grasshopper |
| Course | Computational Intelligence for Integrated Design |
| Primary subject | AI & ML |
| Secondary subject | Machine Learning |
| Level | Intermediate |
| Last updated | November 27, 2024 |
| Keywords |
Responsible
| Teachers | |
| Faculty |
Load CSV File to create Grasshopper Visualization 0/8
Load CSV File to create Grasshopper Visualization
This tutorial will guide you through how to visualize room variations that come from CSV data. This is a continuation of the two previous tutorials in the series, “Generating a Dataset in Grasshopper” and “Machine Learning for Predicting Room Labels”, which can be found by clicking on the cards below.
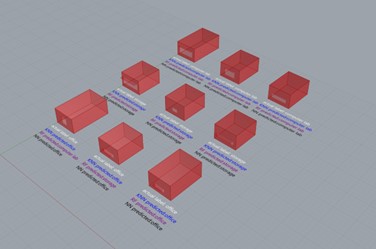
By importing a CSV file containing information about different room iteration features and their function labels based on actual data deriving from daylight simulations and predicted data produced with three different Machine Learning methods, this tutorial will inform students on how to select few random iterations and then visualize them.
Load CSV File to create Grasshopper Visualization 1/8
Design and Data Set Filelink copied
This example refers to design overview described in
The university has described that they have a series of rooms that are a variable depth. Each room has a window on the shorter south side, which varies in width and height, and additionally, some rooms have shading. We will use the labels that were predicted in the previous tutorial “Machine Learning for Predicting Room Labels”. Or you can download the file below.
Data Set File
You can either use the CSV file you created in the previous tutorial or download the CSV file here.
Load CSV File to create Grasshopper Visualization 2/8
Video: Loading CSV File and Creating Visualization of Rooms in Grasshopperlink copied
Load CSV File to create Grasshopper Visualization 3/8
Load CSV data in Grasshopperlink copied
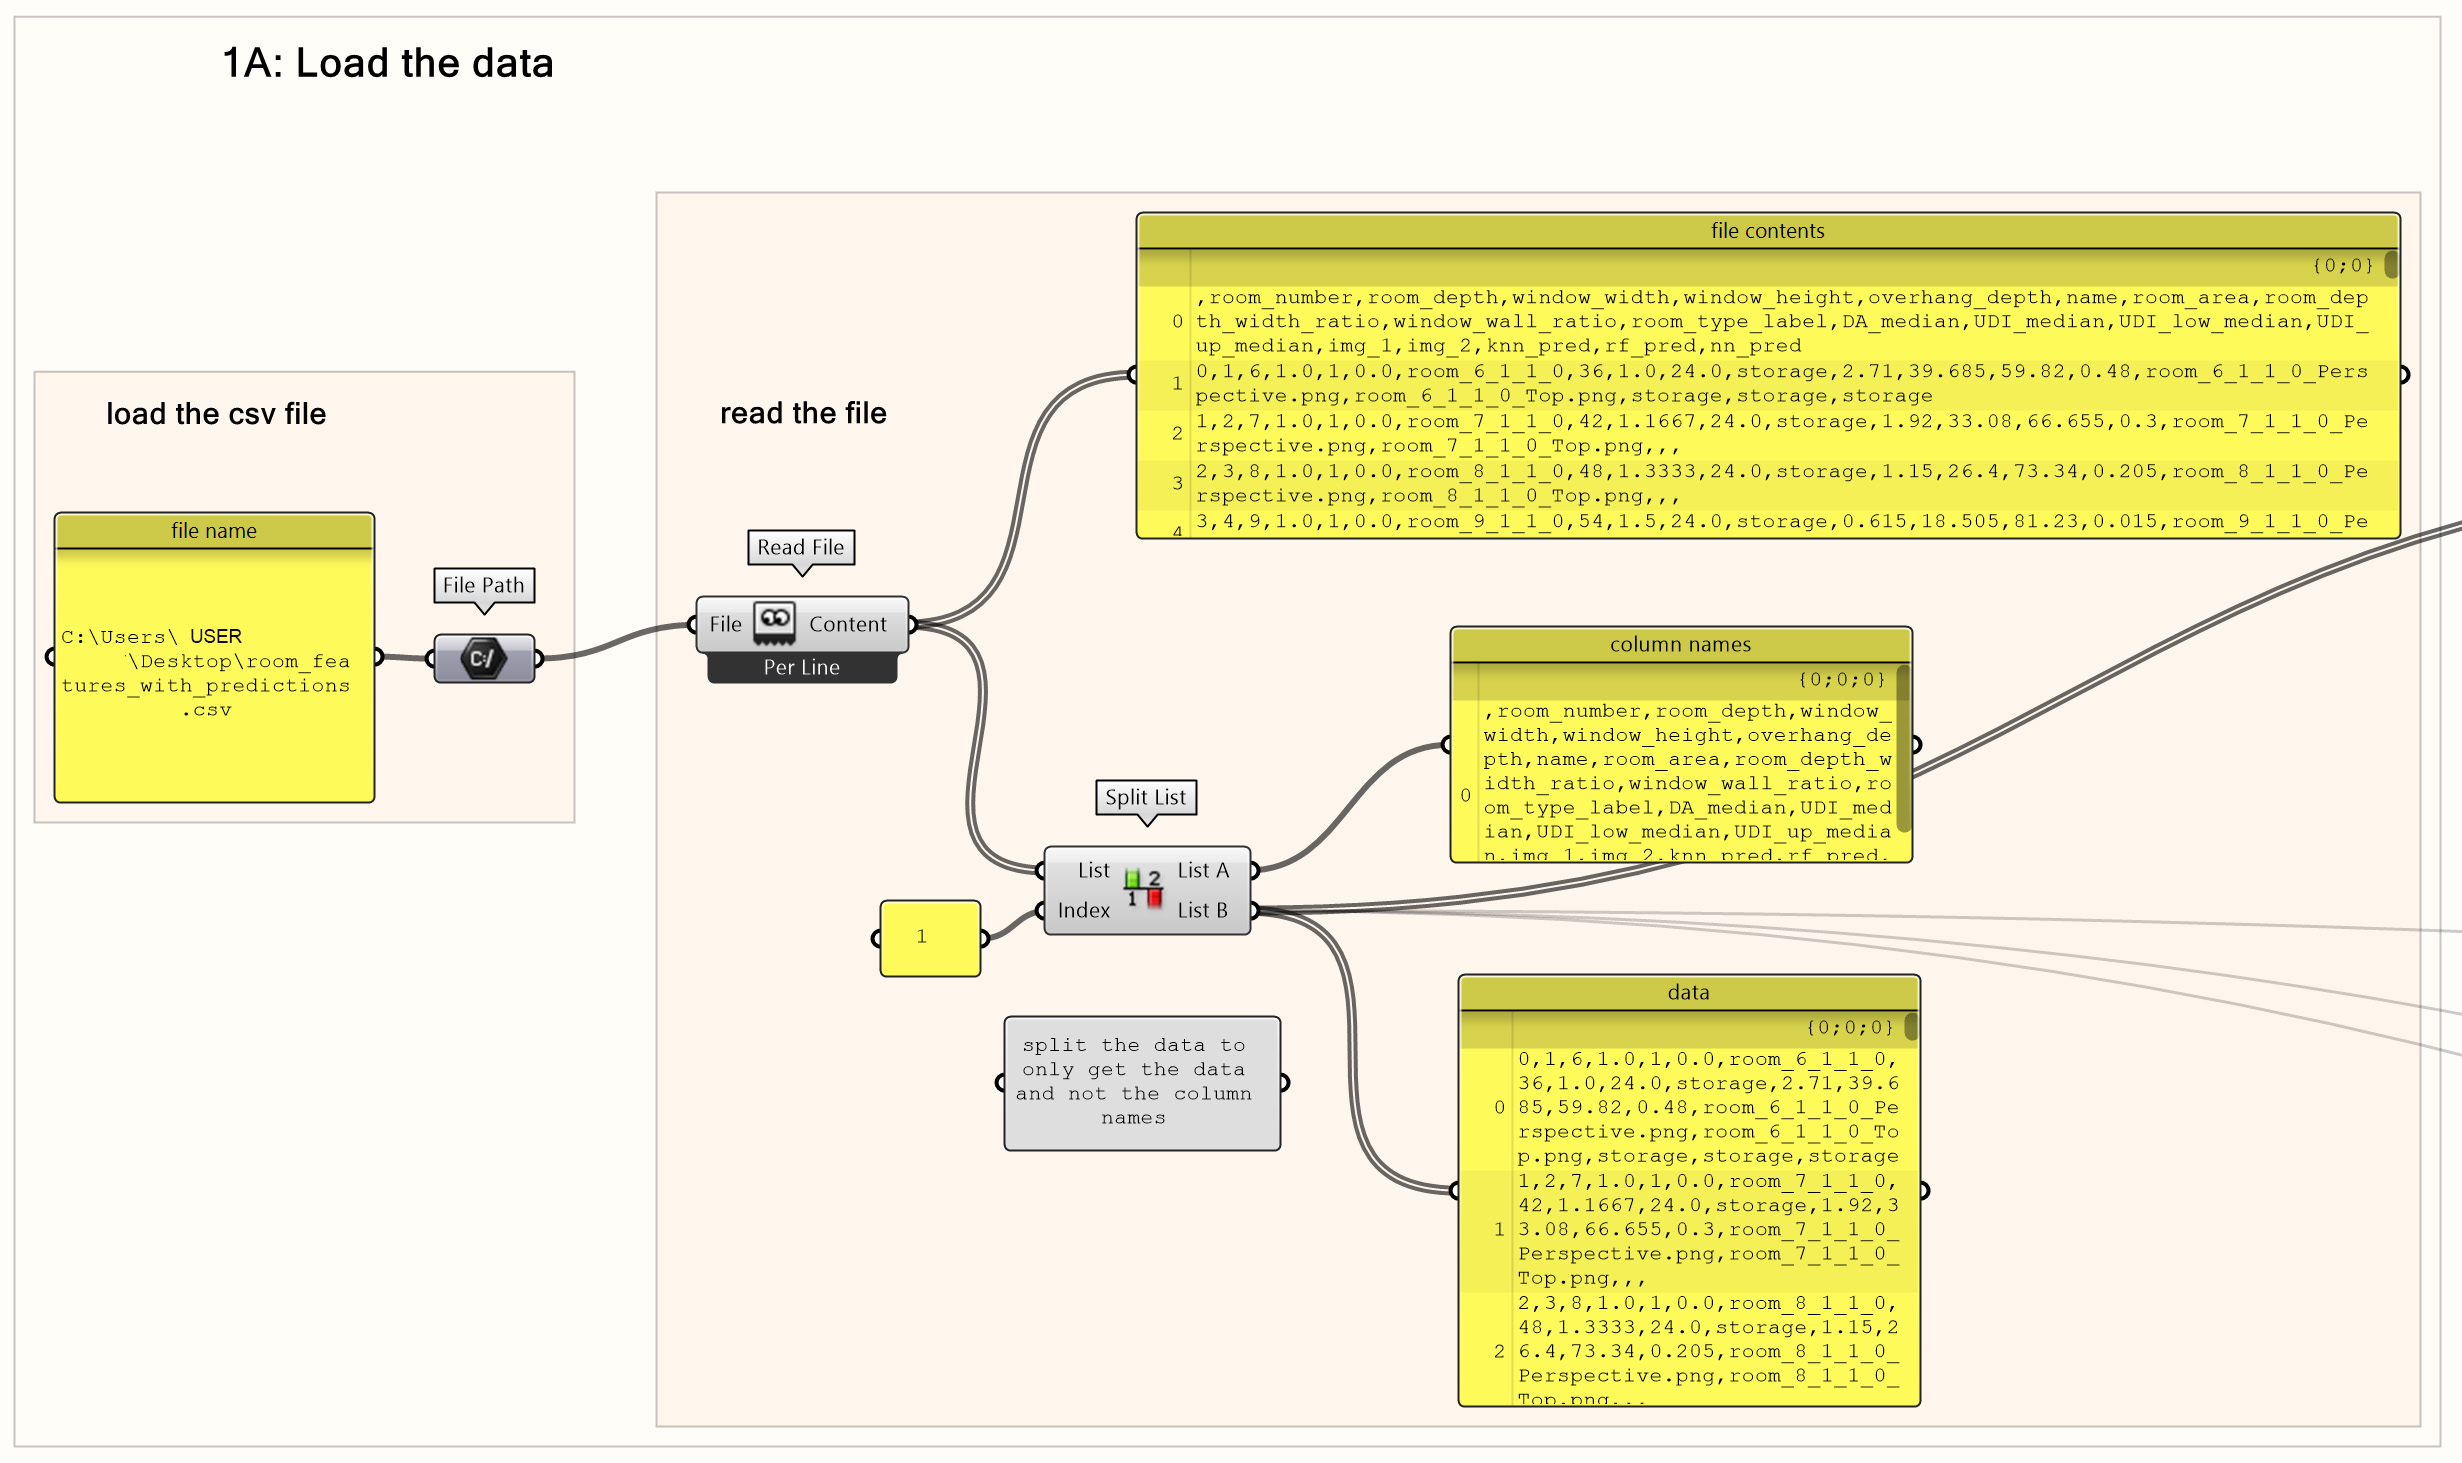
To visualize the rooms, we first need to load the CSV file into Grasshopper and extract all relevant data. The data contained in the CSV file describes the dimensions and qualities of the room as well as its true label (room function), which was assigned based on the daylight simulation performed, and the 3 predictions based on different ML methods used.
Load the Data
First we need to load the CSV file into Grasshopper using a file path and then we need to read the file. Finally, we keep only the rows of the CSV file containing data, thus, taking out the top row containing the column names. To load and read the CSV file data:
- Create a Params » Primitive » File Path component.
- Use a Params » Input » Panel to paste the file path of the CSV file.
- Create a Params » Input » Read File component and connect it to the File Path.
- Use a Sets » List » Split List component and connect its ‘list’ input to the Read File.
- Use a Params » Input » Panel and set it to 1 to split the list to column names and actual data.
Split data to select only room labels
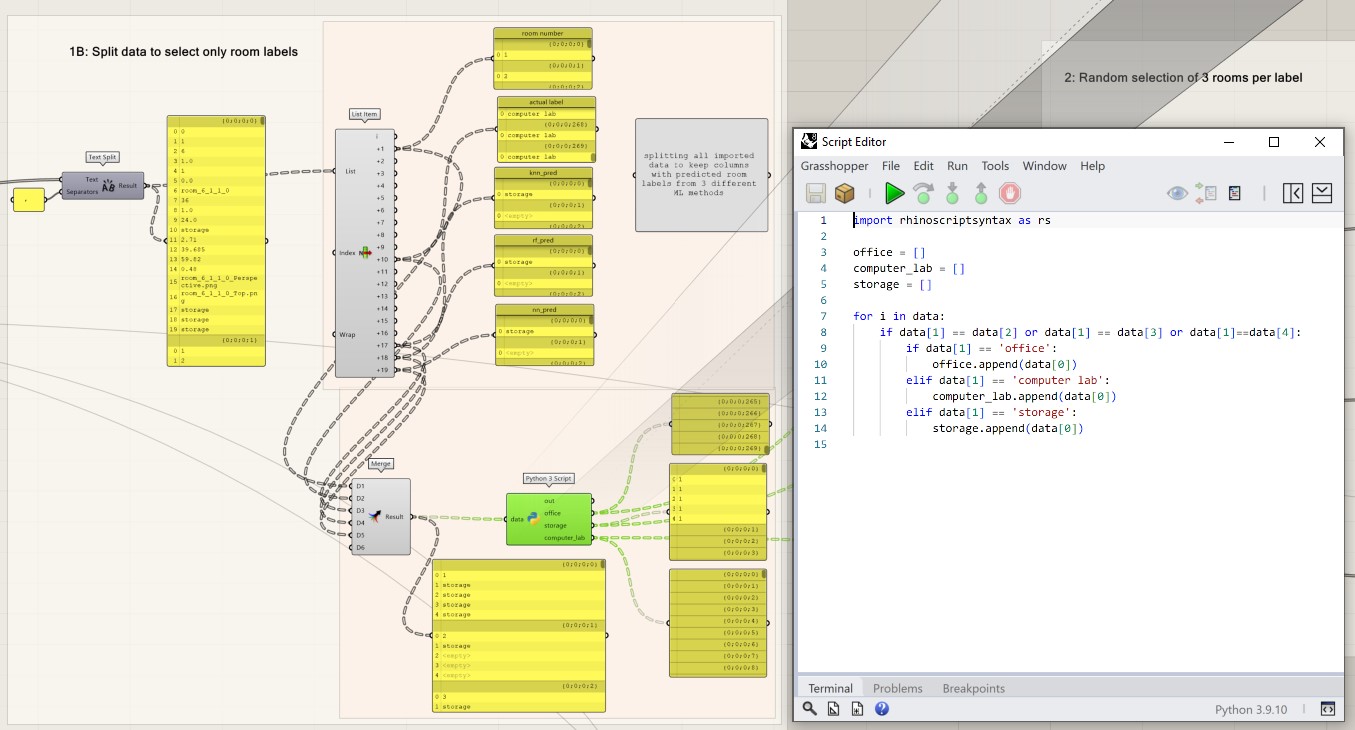
Next step is to split the data properly to be able to categorize the rooms based on their label and then visualize a selection of them.
- Use a Sets » Text » Text Split component and connect the ‘text’ input to the ‘List B’ output of Split List. Use a Params » Input » Panel set to ‘,’ as separators at the Text Split to get all data per room separated.
- Use a Params » Input » Panel and connect it to the Text Split output to check that the data are split correctly.
- Create a Sets » List » List Item component and connect the ‘list’ input to the Text Split. Show all 20 outputs of the List Item and by using 5 Params » Input » Panel components you can check the room number (2nd output), actual label (11th output), knn predicted label, rf predicted label and nn predicted label (last 3 outputs).
- Create a Sets » Tree » Merge component with 5 input data streams and connect them respectively to the 5 outputs of the List Item mentioned before to merge all labels to the room they belong to.
- Create a Maths » Script » Pyhton 3 Script component. Add 1 input source named ‘data’ and 3 outputs named ‘office’, ‘storage’ and ‘computer_lab’.
- Write a script that created 3 separate lists depending on the room label of each input by getting at least one of the predicted labels to match the actual label of the room given. Use this code:
import rhinoscriptsyntax as rs

office = []
computer_lab = []
storage = []

for i in data:
    if data[1] == data[2] or data[1] == data[3] or data[1]==data[4]:
        if data[1] == 'office':
            office.append(data[0])
        elif data[1] == 'computer lab':
            computer_lab.append(data[0])
        elif data[1] == 'storage':
            storage.append(data[0])
Note: Right click on the input source of the python component and set it to ‘List Access’ to get the inputs in a list format.
Load CSV File to create Grasshopper Visualization 4/8
Randomly Select 3 Rooms per Labellink copied
After we have combined all label data per room in a list, it is time to randomly select 3 rooms of each label for visualization. To do this, a python script is created to randomly select 3 room numbers out of all room numbers of each label. To randomly select 3 rooms:
- Create 3 Sets » List » List Item components and connect their ‘list’ inputs to the 3 outputs of the python component of the previous step sorting them in lists of the 3 labels.
- Use 3 Params » Input » Panel, set them to ‘0’ and connect them to the ‘index’ input of the List Item components to get the specific numbers of the rooms with a label of office, storage and computer lab respectively.
- Create 3 Maths » Script » Pyhton 3 Script components. Add 1 input source named ‘data’ and 1 outputs named ‘selected_values. Connect the python scripts to the List Item outputs, 1 per each room type.
- Write a script that randomly selects 3 numbers of the given list. Use this code:
import rhinoscriptsyntax as rs

import random

integers_only=[]
i = 0
while i < 269:
    if data[i] is not None and data[i] != '':
        integers_only.append(data[i])
    i = i + 1

print(integers_only)
# Randomly select 3 values from the filtered list
selected_values = random.sample(integers_only, min(3, len(integers_only)))
Note: Right click on the input source of the python component and set it to ‘List Access’ to get the inputs in a list format.
- Use 3 Params » Input » Panel to check which 3 room are selected by the python components for each room type.
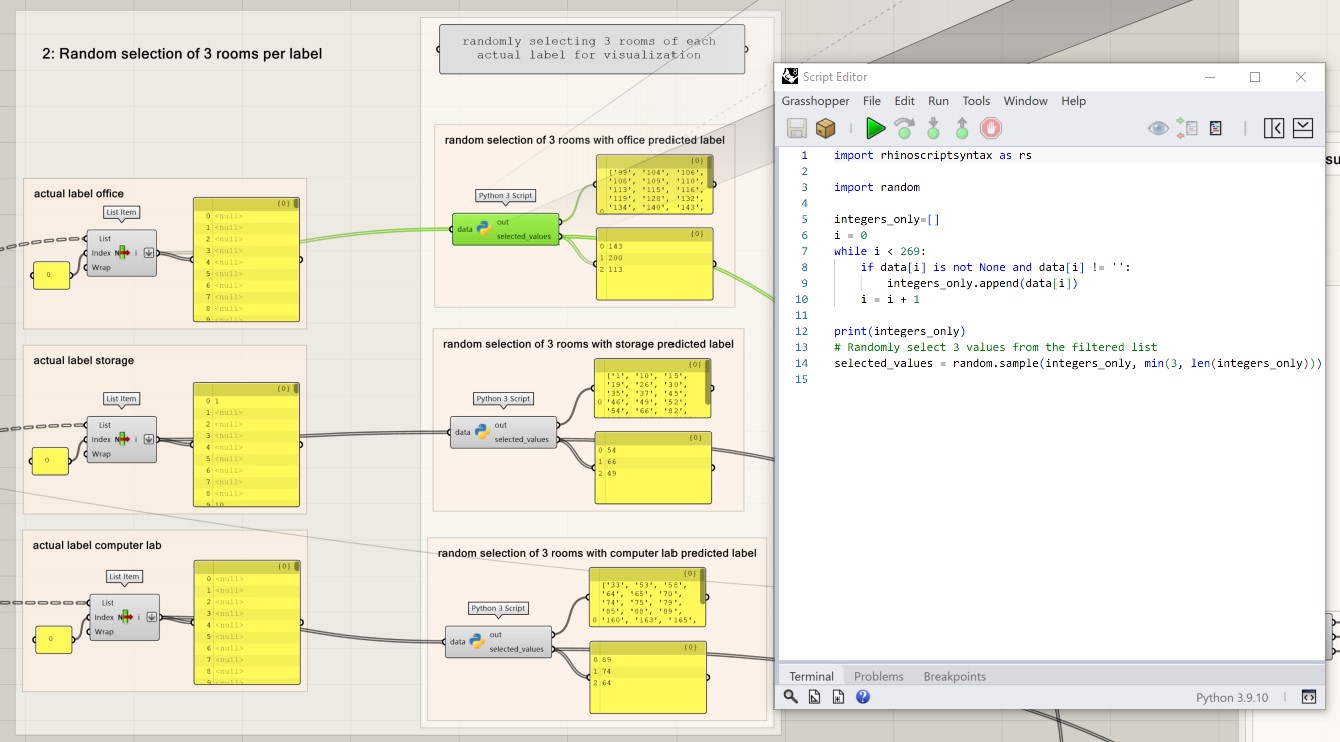
Load CSV File to create Grasshopper Visualization 5/8
Visualize the Rooms: Extract Data and Generate Geometrylink copied
Finally, it is time to visualize the three randomly selected rooms per room function. To do that we need to follow several steps: first, extract the parameters to recreate each room, second, generate the room geometry and third, organise each variations’ geometry on a grid to easily see each one. A last step is to add tags to each variation that depict their label based on the actual and the ML methods for an organised and clear final visualization of all iterations. This process needs to be repeated three times, one for each room function. In this example we will go through only one of the room types in detail.
Extract the Room Data
First step of the visualization is to extract the data of the 3 randomly selected rooms with the python script created in the previous step of this tutorial. This data is extracted from the CSV file containing all room data. Then, we need to separate the selected data to extract the room parameter that are variable and will create the different room variations, which are the room depth, the window width and height and the overhang depth.
- Create a Sets » List » List Item component and connect its ‘list’ input to the Python component that randomly selected the 3 office rooms. Add 3 output sources to the List Item component, one for each room variation.
- Create a Sets » Tree » Merge component with 3 input data streams and connect them to the 3 outputs of the List Item.
- Create a Sets » List » List Item component and connect its ‘index’ input to the Merge output. Connect the ‘list’ input to the ‘list B’ output of the Split List component created at the read file step at the beginning of the tutorial.
- Use a Sets » Text » Text Split component to separate the data of the 3 rooms from the List Item. Use a Params » Input » Panel set to ‘,’ as separators at the Text Split to get all data per room separated.
- Use a Params » Input » Panel component to see that the data is split correctly and check the ‘position’ of the data regarding the variable room dimensions in the list.
- Create 4 Sets » List » List Item and 4 Params » Input » Panel components. Connect each List Item ‘list’ input to the Text Split output. Set the Panels to ‘2’, ‘3’, ‘4’, ‘5’ to connect them to the respective ‘index’ inputs of the List Items and get the values regarding the room depth, window width and height and overhang depth.
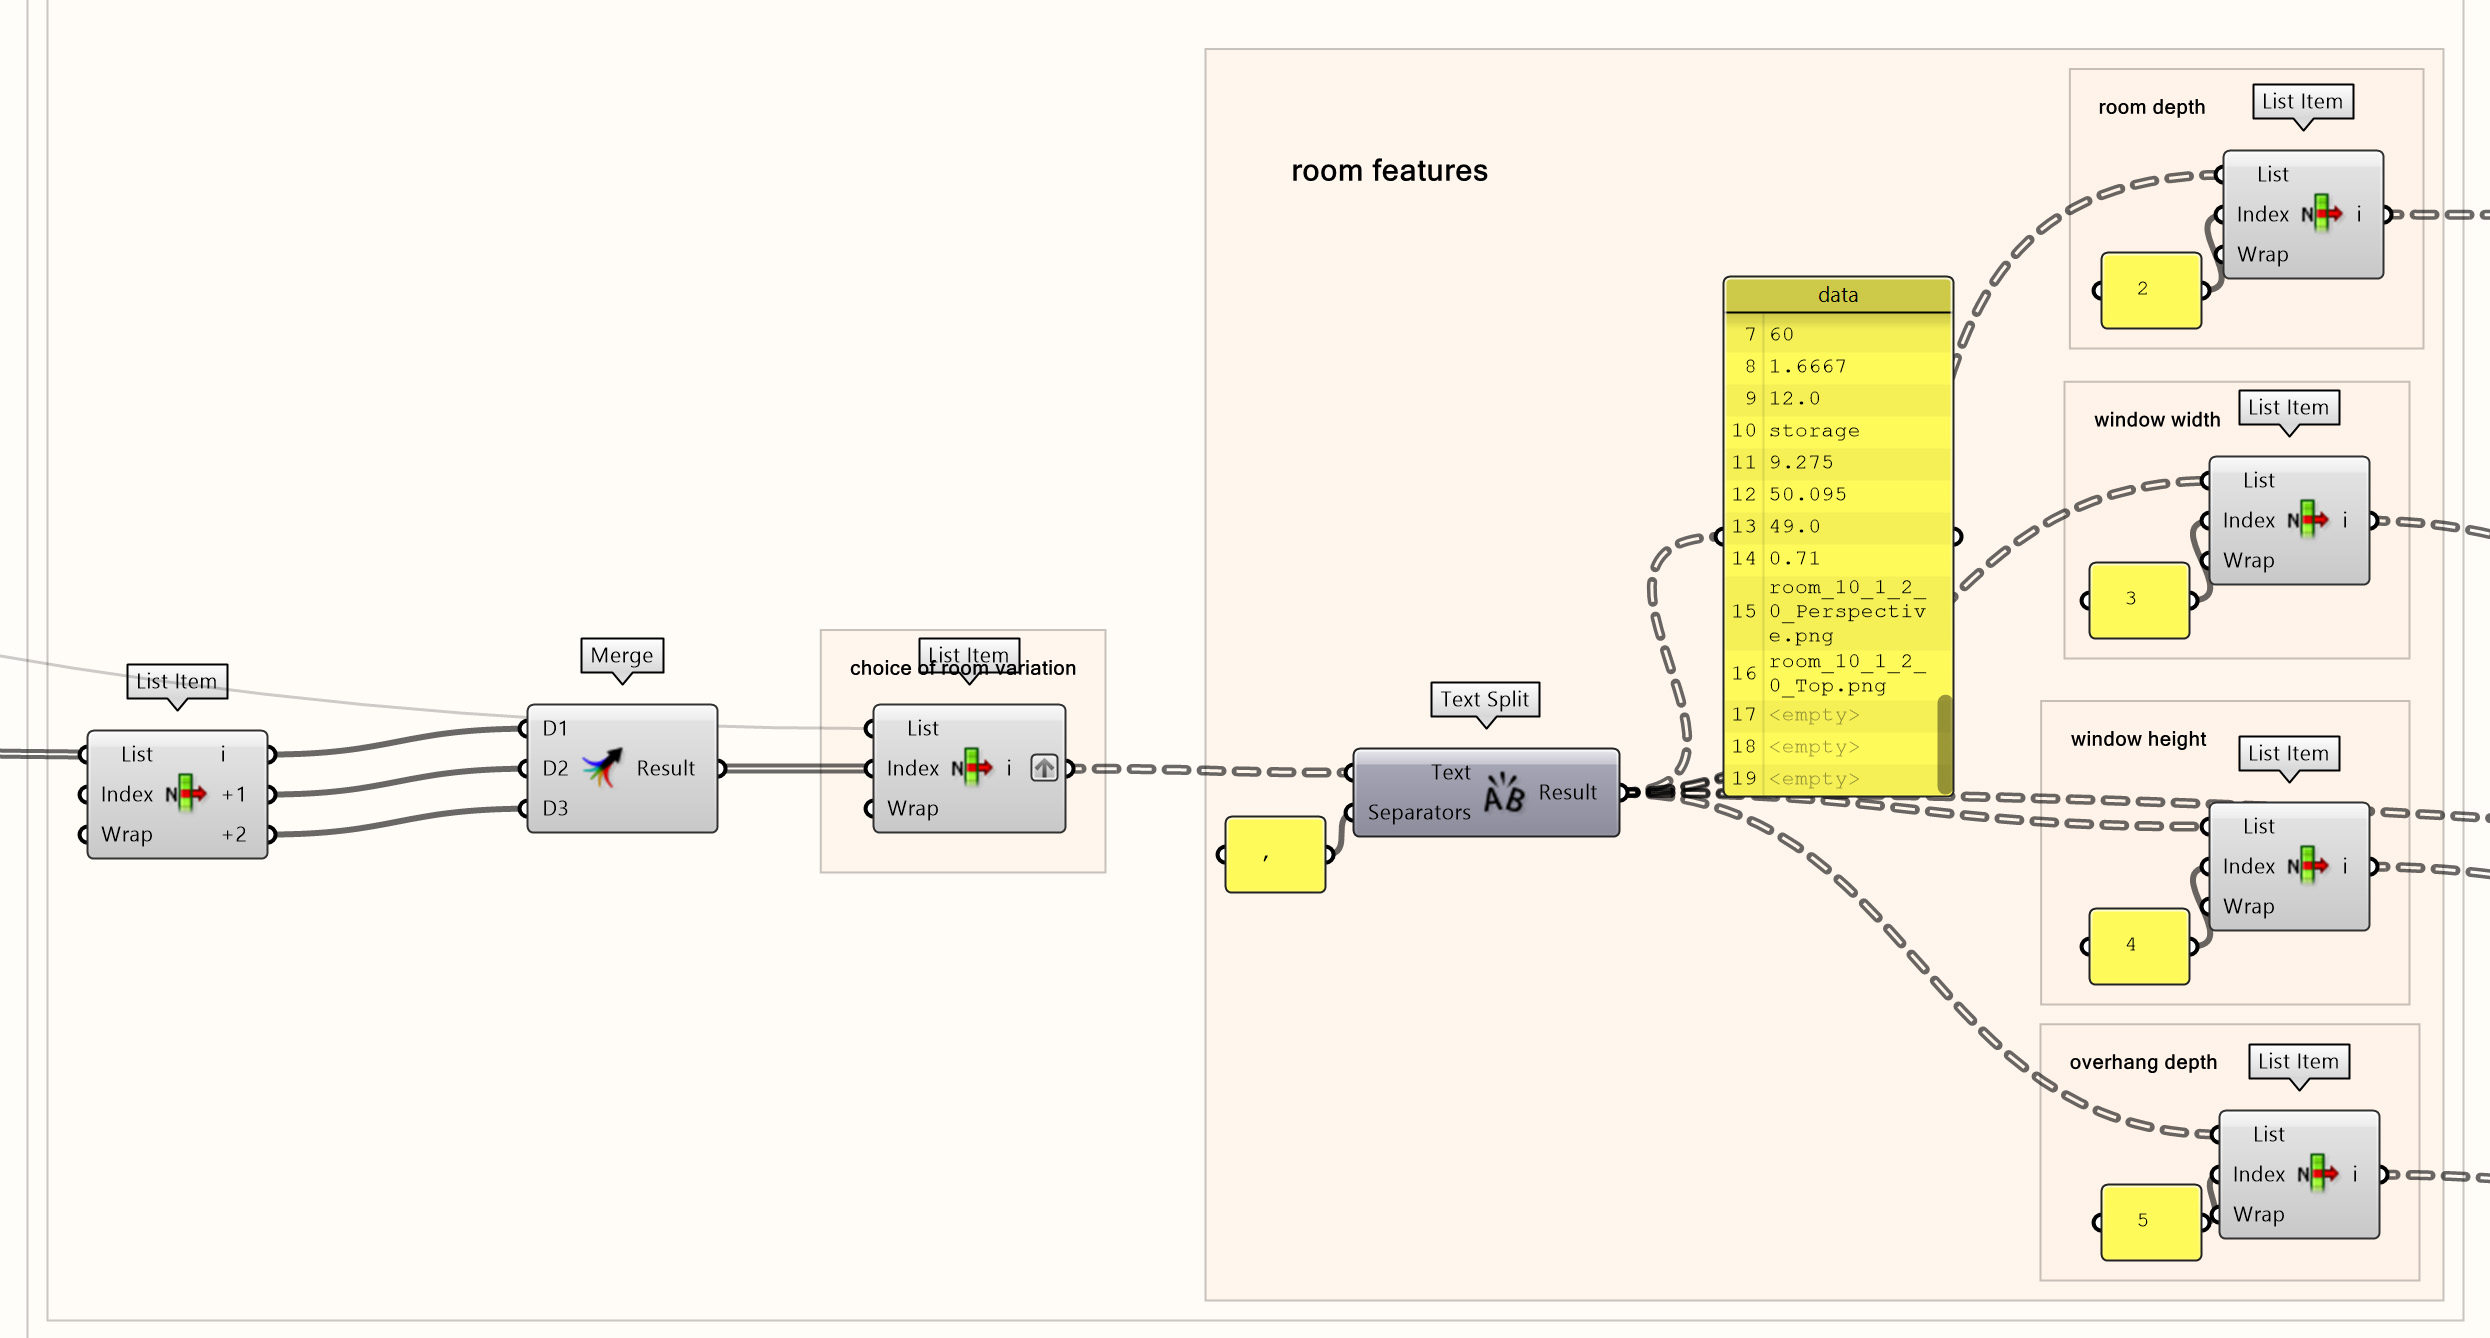
Generating Room Forms
The second step in visualizing the randomly selected rooms is to create the three variations of each room type by using the room data we extracted in place of the variable sliders. The room geometry has already been parametrically designed in the ‘Generating a Dataset in Grasshopper’ tutorial.
We will follow the same Grasshopper script as used in the ‘Create the room variations’ section of the previously mentioned tutorial. However, this time we will replace the number sliders used to create the different variations of the room – room depth, window width, window height and overhang depth – with the data we extracted for the 3 room variations by connecting the List Item outputs where the number sliders were.
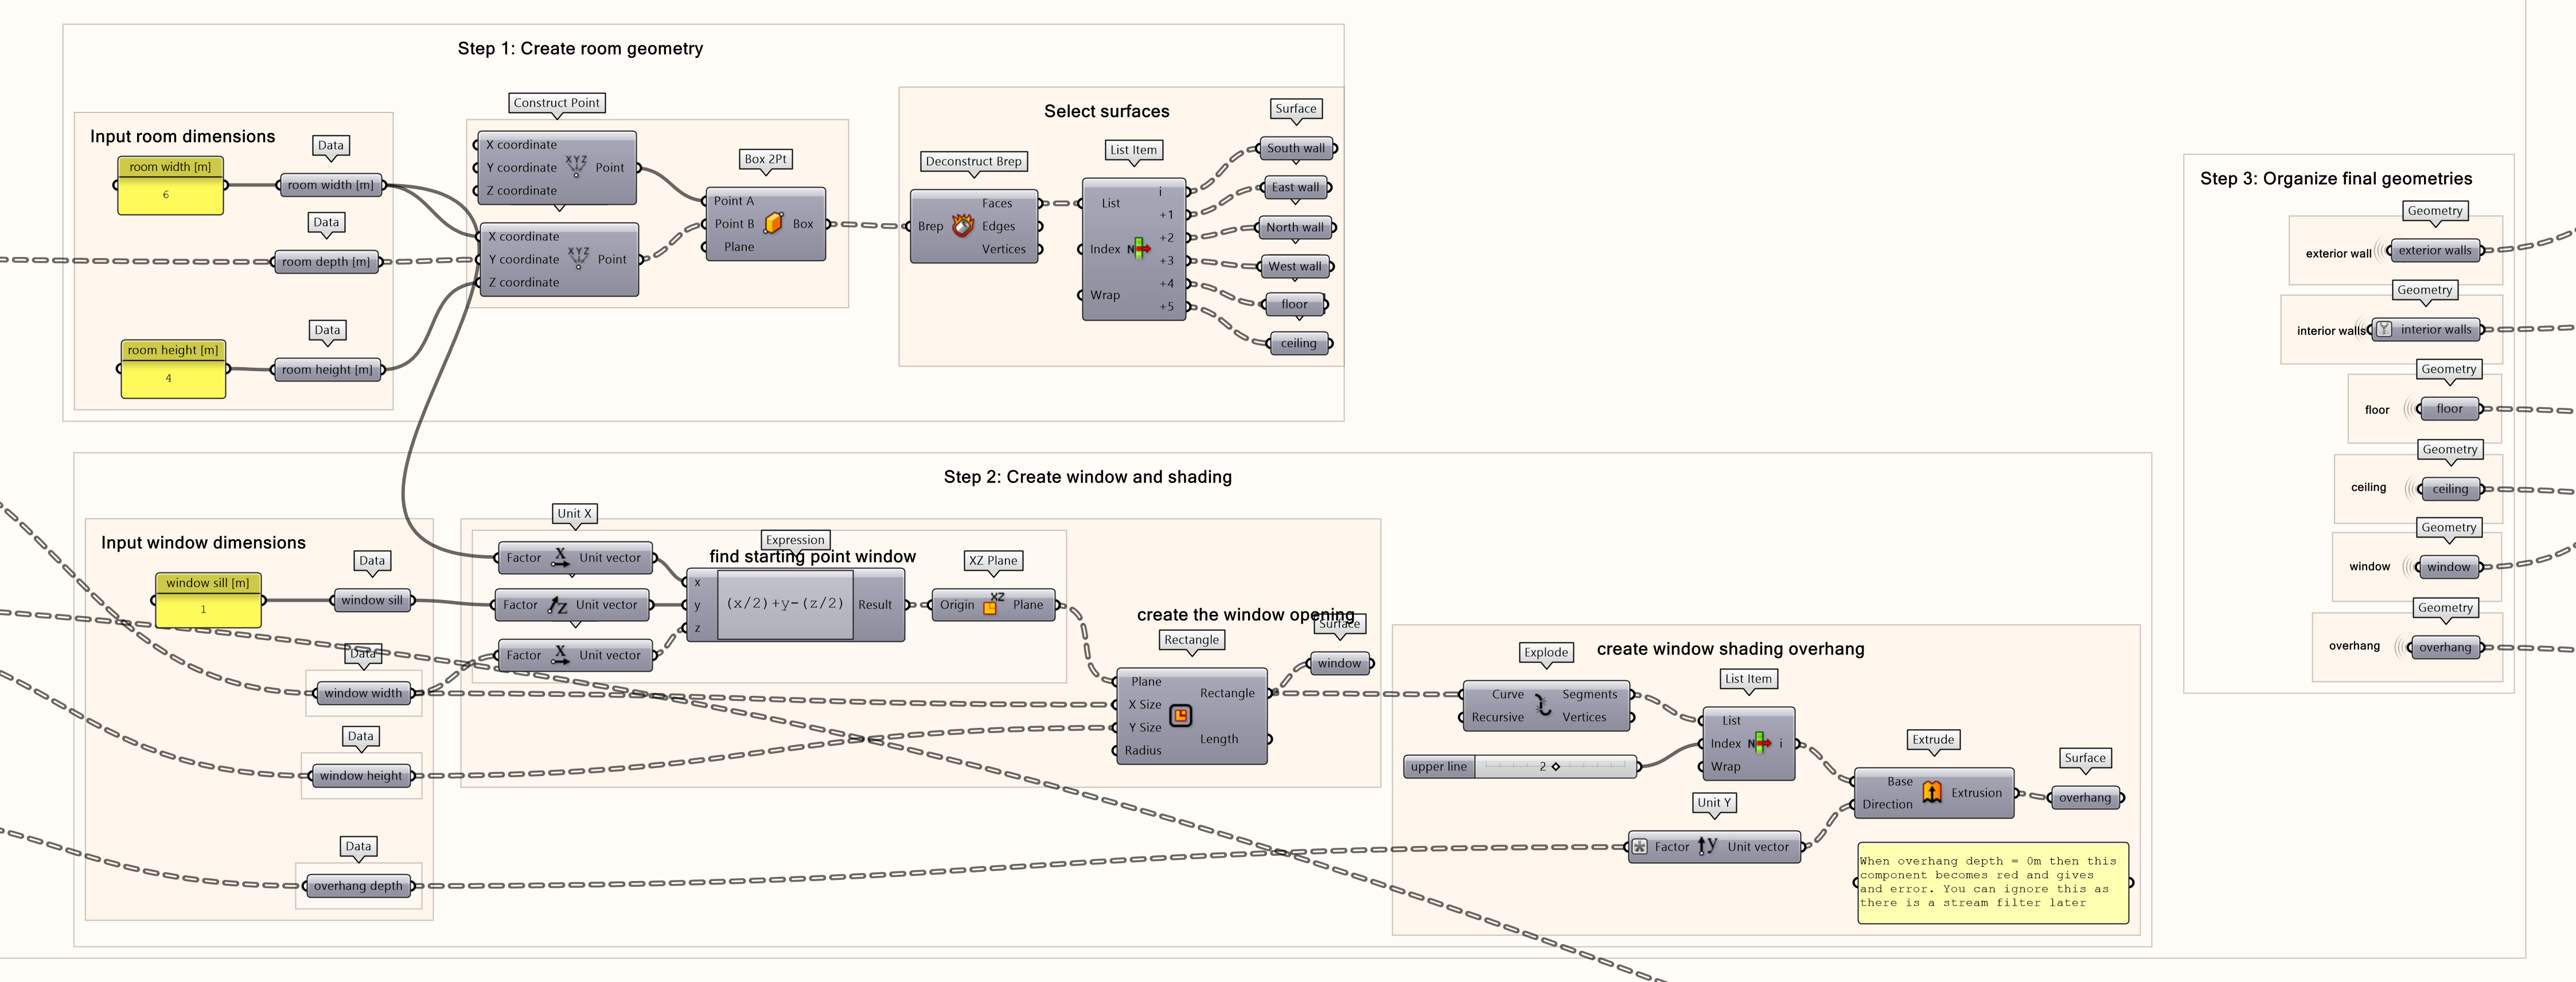
Load CSV File to create Grasshopper Visualization 6/8
Visualize the Rooms: Separate, Construct and Organize the Room Variationslink copied
Separate Room Faces
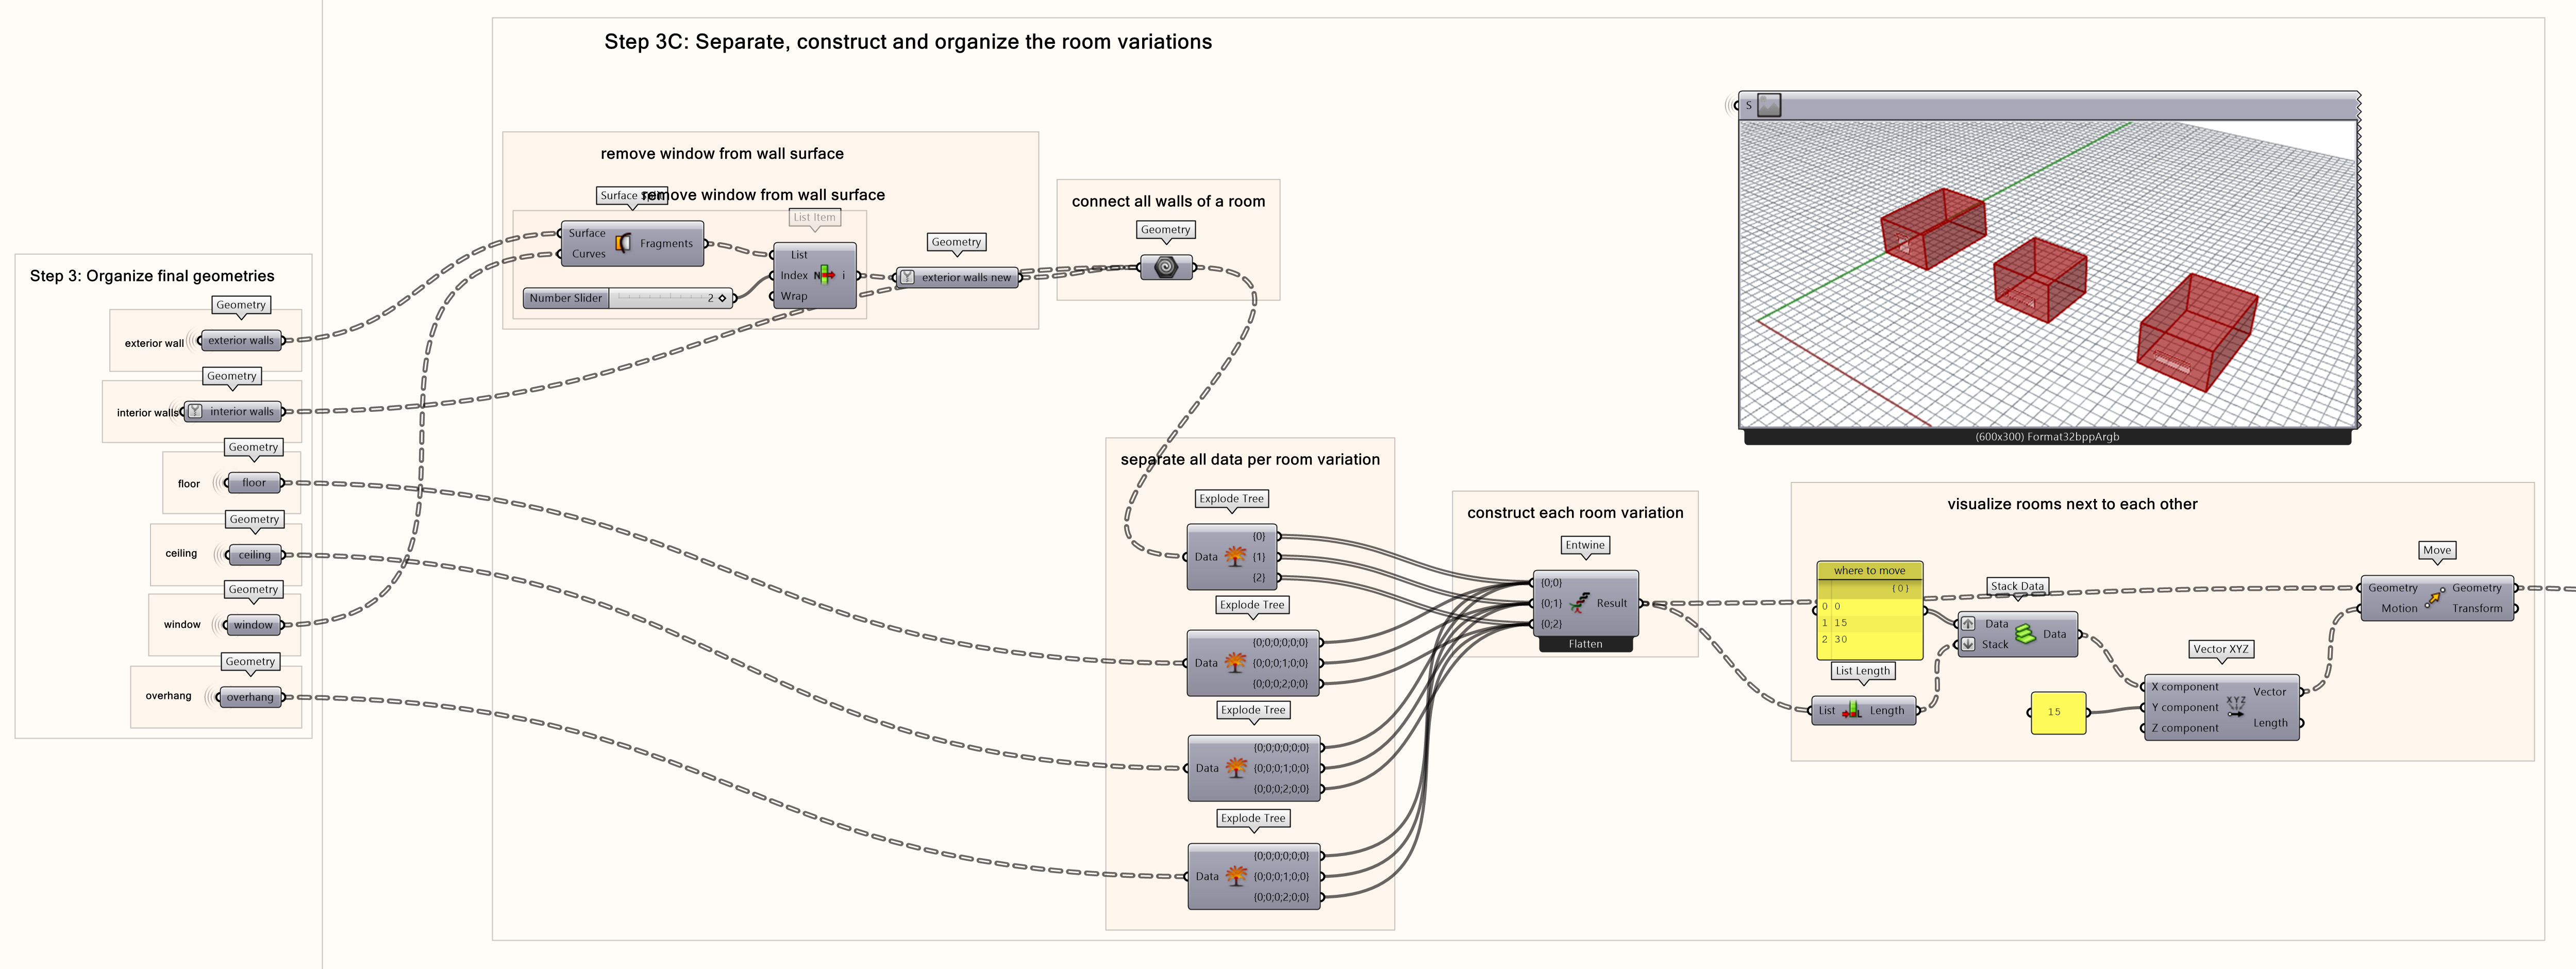
An important step after we have the form of all room variations is to separate their faces, organize them per variation to compose correctly the different rooms, and move them on a grid to have a better overview of the three for comparison. After creating the opening of the windows on the correct walls, we need to separate all data per room, construct each room and then move them next to each other. We do this in the following steps:
- Create a Intersect » Physical » Surface Split component. Connect the ‘surface’ input to the organised exterior walls Geometry component. Connect the ‘curves’ input to the organised window geometry.
- Create a Sets » List » List Item and connect the ‘list’ input to the Surface Split output. Use a Params » Input » Number Slider component and set it to 2 to select the split part of the wall without the opening by connecting it to the ‘index’ input of the List Item.
- Create a Params » Geometry » Surface to get the final geometry of the walls without the window surface by connecting to the List Item.
Note: Right click on the input side of the Geometry component and set it to simplify. This will help later to transfer the data correctly.
- Create a Params » Geometry » Surface to combine the all the walls of a room. Connect it to the new exterior walls Geometry and the interior walls Geometry components.
- Create 4 Sets » Tree » Explode Tree components. Connect the first one to the connected walls Geometry component created. Connect the other 3 to the floor, ceiling and overhang Geometry components of the organizing final geometries step.
- Use a Sets » Tree » Entwine component to organize the faces per room variation. Connect each of the outputs of the 4 Explode Tree components to the respective inputs of the Entwine component.
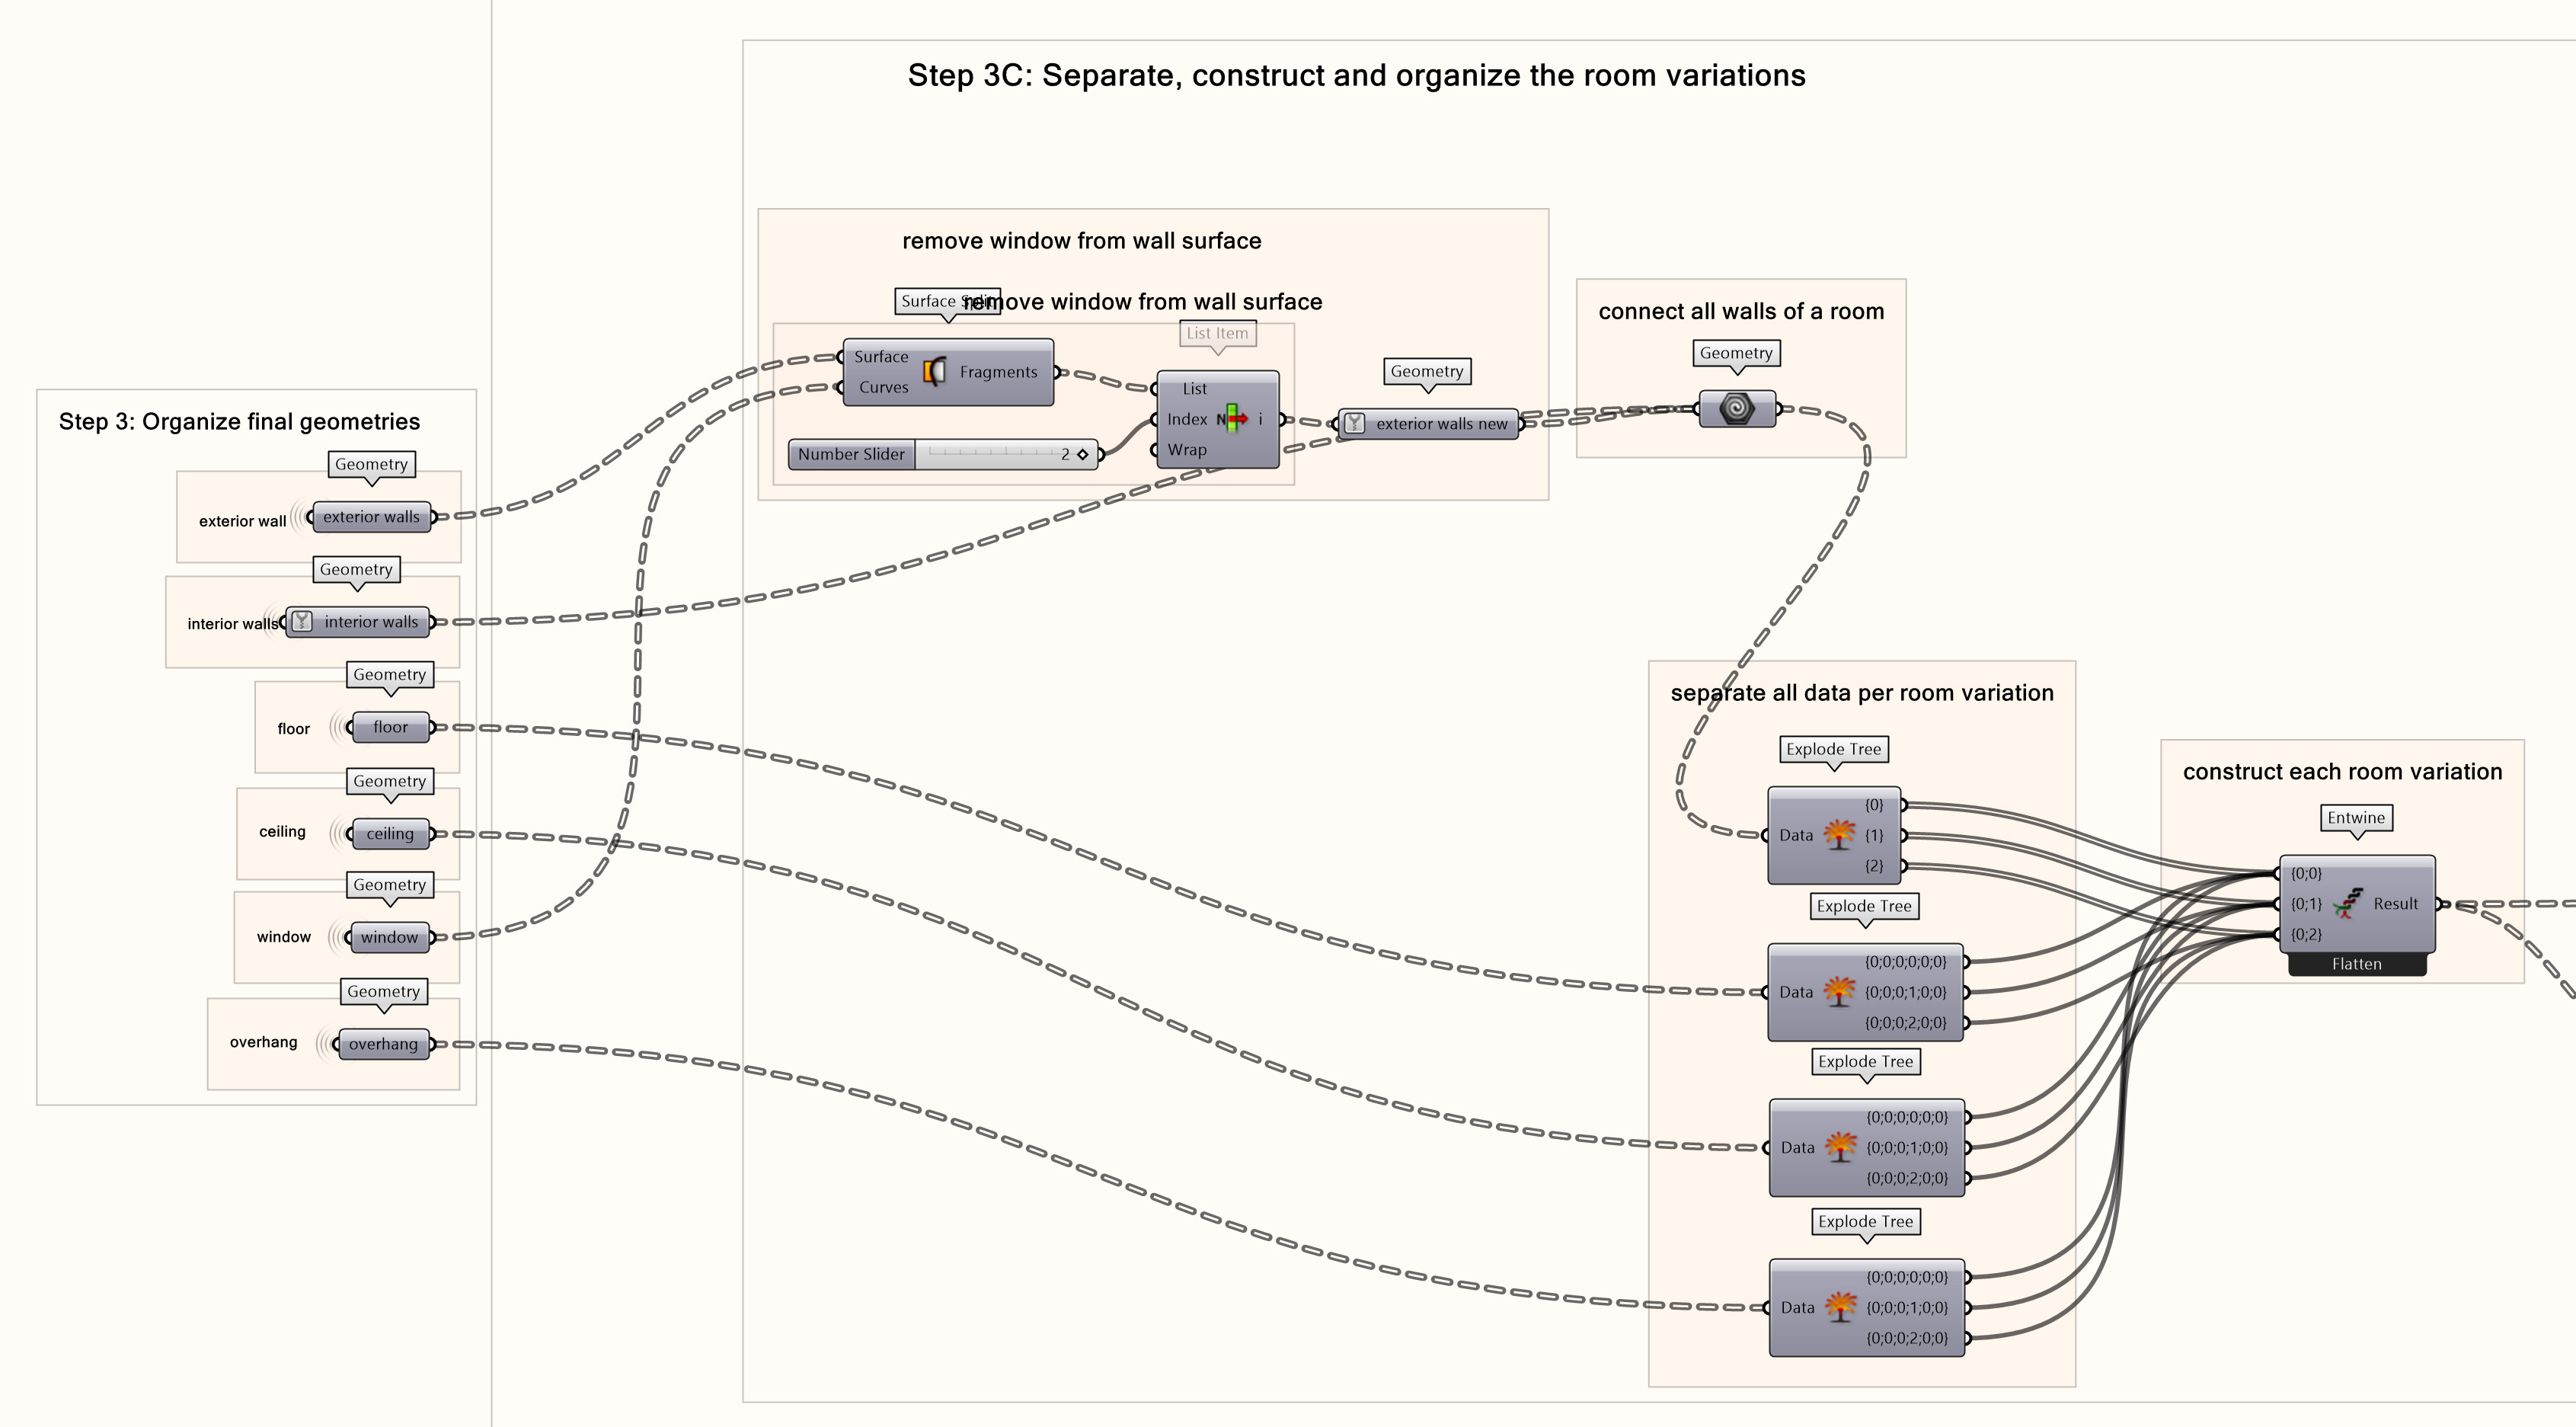
Display Rooms Next to Each Other
Next, we can move the geometry so they can be visualized next to each other.
- Create a Sets » List » List Length component. Connect it to the output of the Entwine component.
- Use a Sets » Sequence » Stack Data component to create the stacking of the room variations data next to each other. Connect the ‘stack’ input to the List Length component. Use a Params » Input » Panel to set the distance between the variations to 0,15 and 30 meters and connect it to the ‘data’ input of the Stack Data.
- Create a Vector » Vector » Vector XYZ component. Connect the Stack Data output to the ‘x component’ input to move the room variations horizontally in respect to each other. Use a Params » Input » Panel to set the ‘y component’ input distance to 15 in order to move the variations in respect to the original point.
Note: When repeating this part of the script for a different room type, ex. Storage, remember to change this vertical distance to move the variations of this room type to a different level in the y axis.
- Create a Transform » Euclidean » Move component. Connect the Entwine output to the ‘geometry’ input and the ‘vector’ output of the Vector XYZ to the ‘motion’ input.
Load CSV File to create Grasshopper Visualization 7/8
Visualize the Rooms: Create and Position Labelslink copied
Create Labels
Finally, we will use text to label each visualization to show what the actual and predicted room labels are. We will create tags showing this information.
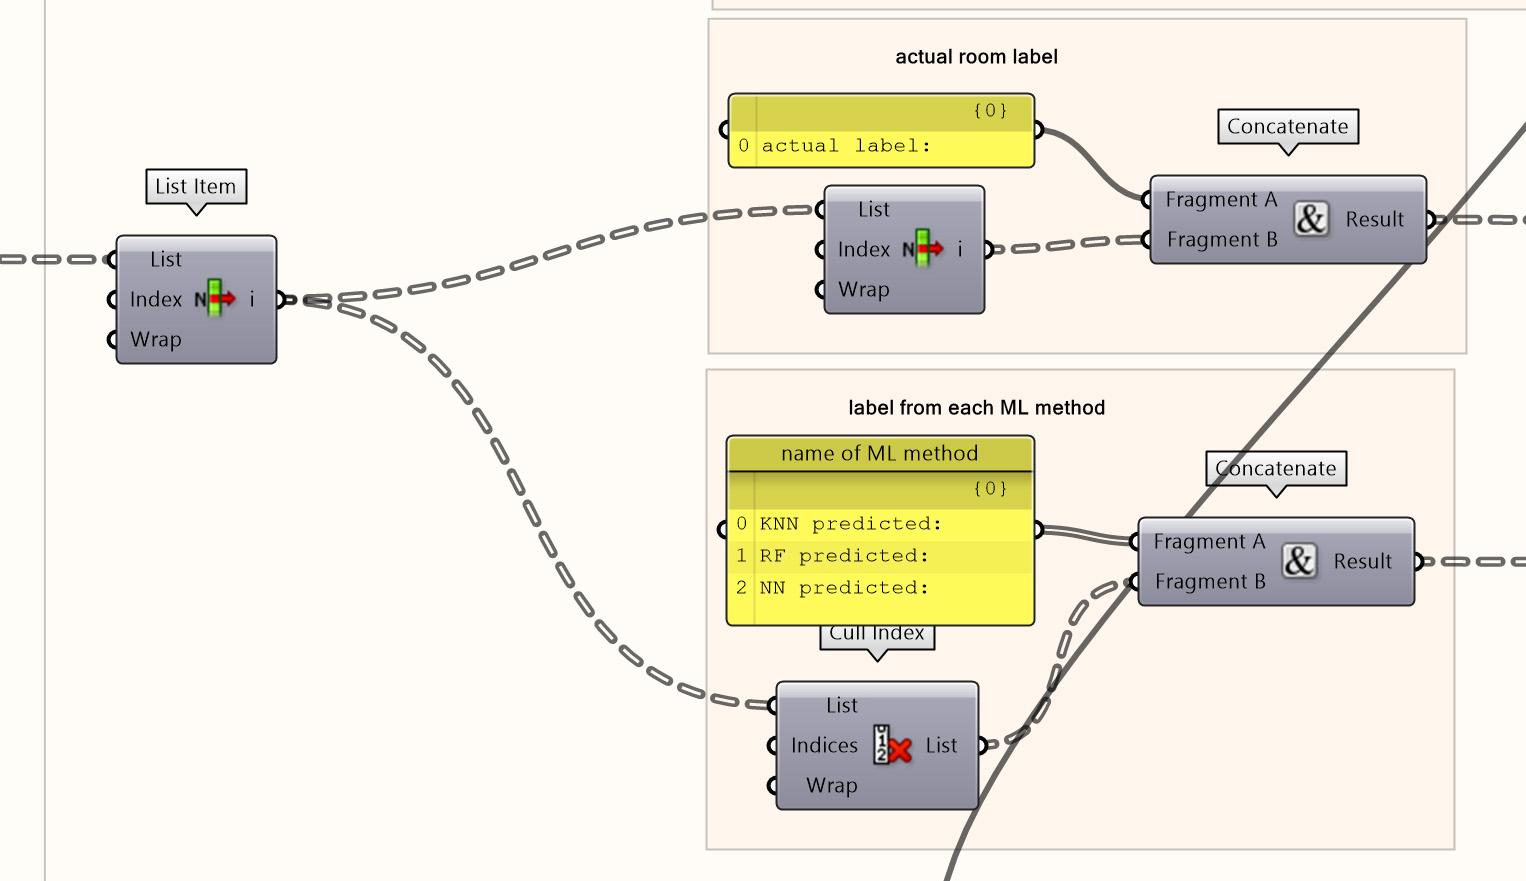
- Create a Sets » List » List Item component. Connect the ‘list’ input to the Text Split component at the beginning of the room visualization step.
- Create a Sets » List » List Item component. Connect the ‘list’ input to the output of the previous List Item and do not set an index. This way the List Item selects the first data which is the actual label of the rooms.
- Create a Sets » Text » Concatenate component and a Params » Input » Panel component. Connect the Panel to the ‘fragment A’ input and the List Item to the ‘fragment B’ input of the Concatenate. Set the panel to ‘actual label:’ to create the actual room label.
- Create a Sets » Sequence » Cull Index component and connect it to the first List Item component to get the remaining 3 values of the predicted labels.
- Create a Sets » Text » Concatenate component and a Params » Input » Panel component. Connect the Panel to the ‘fragment A’ input and the Cull Index to the ‘fragment B’ input of the Concatenate. Set the panel to ‘KNN predicted:, RF predicted:, NN predicted:’ to create the ML labels.
Move the Labels
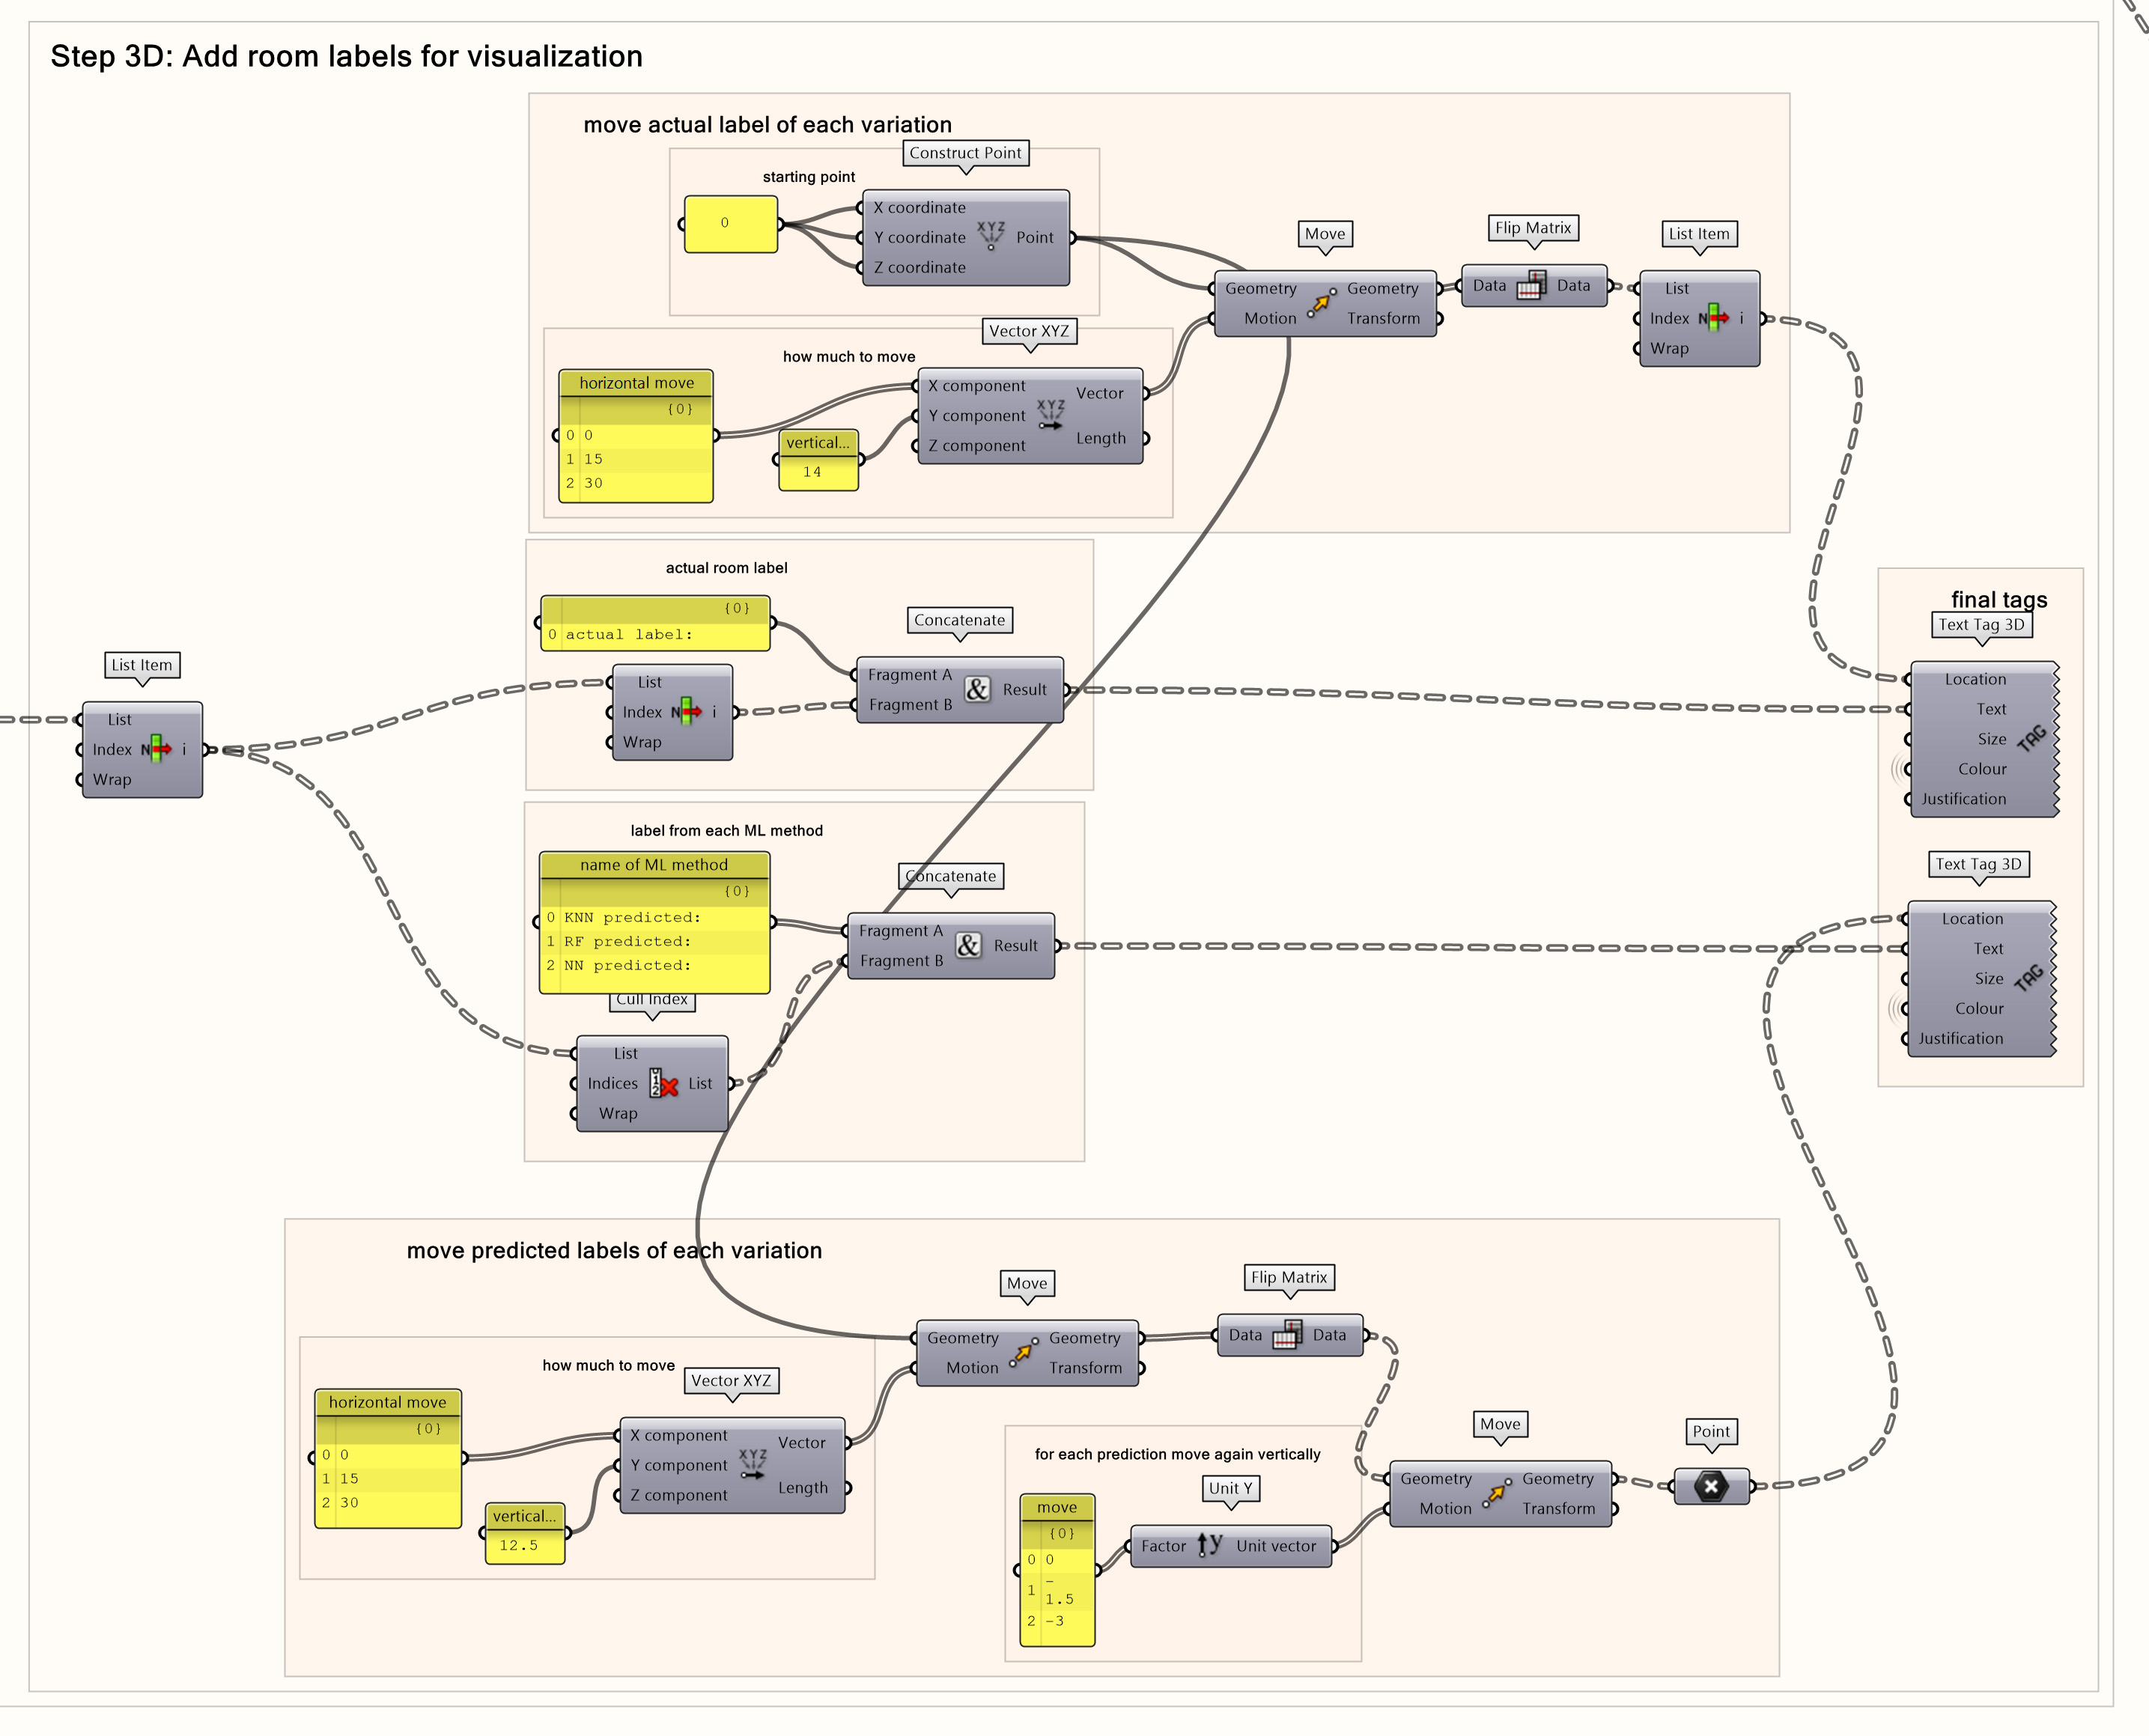
Then you need to move the labels at the correct spot under the visualized rooms. For the actual labels:
- Create a Vector » Point » Construct Point component. Use a Params » Input » Panel component and set it to ‘0’ to create a point at the (0,0,0).
- Create a Vector » Vector » Vector XYZ component. Use a Params » Input » Panel component, set it to ‘0,15,30’ to move the labels horizontally, and a Params » Input » Panel component and set it to ‘14’ to move it vertically under the south façade of the rooms.
- Create a Transform » Euclidean » Move component. Connect the ‘geometry’ input to the Construct Point and the ‘motion’ input to the Vector XYZ.
- Create a Sets » Tree » Flip Matrix component and connect it to the ‘geometry’ output of the Move.
- Create a Sets » List » List Item component and connect the ‘list’ input to the Flip Matrix.
- Create a Display » Dimensions » Text Tag 3D component. Connect the ‘location’ input to the List Item and the ‘text’ input to the Concatenate component of the actual label.
For the predicted labels:
- Create a Vector » Vector » Vector XYZ component. Use a Params » Input » Panel component, set it to ‘0,15,30’ to move the labels horizontally, and a Params » Input » Panel component and set it to ’12.5’ to move it vertically under the actual label.
- Create a Transform » Euclidean » Move component. Connect the ‘geometry’ input to the Construct Point from the actual label and the ‘motion’ input to the Vector XYZ.
- Create a Sets » Tree » Flip Matrix component and connect it to the ‘geometry’ output of the Move.
- Create a Transform » Euclidean » Move component. Connect the ‘geometry’ input to the Flip Matrix. Use a Vector » Vector » Vector Y component and a Params » Input » Panel component set to ‘0, -1.5, -3’ to move each predicted label text under the other in the Y axis.
- Create a Params » Geometry » Point component and connect it to the ‘geometry’ output of the Move.
- Create a Display » Dimensions » Text Tag 3D component. Connect the ‘location’ input to the Point and the ‘text’ input to the Concatenate component of the predicted labels.
Color the Labels
To make the tags easier to read you can add different colors to each tag. To do that:
- Create 2 Params » Input » Panel components. Set the first one to ‘white’ and the second to ‘blue, pink, black’.
- Connect them to the ‘color’ input of the Text Tag 3D components respectively to get the actual label visualized in white color and the predicted labels in 3 colors based on the ML method used.

Analysis of the Data
You can now use the visualization to analyze the results of your predictive models. In this case, for example, we can see that all the office spaces have very small windows. Although this meets the performance requirements selected by the university, we know that views to the outside is also an important factor for people. This tells us that maybe we need to create more features for our data set and also consider views to the outside when assigning room labels. You can combine this visualization with further analysis of the results.
Load CSV File to create Grasshopper Visualization 8/8
Conclusion and Final Scriptlink copied
After following this tutorial you learned how to visualize room variations based on data extracted from a CSV file. You learned how to extract and separate the data of the CSV file to get parameters for selected rooms and visualize each room on a grid. Moreover, you learned how to add tags to recognize and label the variations.

Final Script
You can download the Grasshopper file here.
Write your feedback.
Write your feedback on "Load CSV File to create Grasshopper Visualization"".
If you're providing a specific feedback to a part of the chapter, mention which part (text, image, or video) that you have specific feedback for."Thank your for your feedback.
Your feedback has been submitted successfully and is now awaiting review. We appreciate your input and will ensure it aligns with our guidelines before it’s published.
