WV4 Line 1 – Workshop 3 – Dataset analysis with Classification
-
Intro
-
Classification Terminology
-
Classification accuracy
Information
| Primary software used | Python |
| Software version | 1.0 |
| Course | WV4 Line 1 – Workshop 3 – Dataset analysis with Classification |
| Primary subject | AI & ML |
| Secondary subject | Machine Learning |
| Last updated | November 27, 2024 |
| Keywords |
Responsible
| Teachers | |
| Faculty |
WV4 Line 1 – Workshop 3 – Dataset analysis with Classification 0/2
WV4 Line 1 – Workshop 3 – Dataset analysis with Classification
This workshop introduces supervised machine learning methods for classification, which require a dataset labelled with binary or categorical classes.
These methods can be used to (1) build a classifier, i.e. a model that learns from the dataset to predict the correct class for any new input data point, and (2) identify the key features that affect the classification accuracy, i.e. those features that determine whether a data point belongs to a certain class.
Classification may help to answer research questions like: How do different environmental factors (e.g., air quality, temperature, humidity) influence whether a city has a high or low living quality?
WV4 Line 1 – Workshop 3 – Dataset analysis with Classification 1/2
Classification Terminologylink copied
Classification
Classification is a supervised learning task in which data points are categorised into predefined classes or groups based on their features. A classification task might involve predicting a certain house price range based on house features like number of stories, nearby amenities, services etc. One starts with a dataset of existing houses for which features are measurable and price range known. Then, you will have to train a Machine Learning model to learn the mapping between house features and price range and predict the most likely price range for a house that is not part of the dataset and that might not even exist.
Technically, machine learning methods for classification aim to find the decision boundary, that is the function separating data points into two or more classes.
Decision boundary
A decision boundary is a function that separates data points into two or more classes in a classification problem. This function approximates the distribution of the dataset and can be used to predict the class of any new input.
Decision boundaries are typically characterised by a stepwise shape because, in a classification task, the dependent variable (the output y) can only take discrete values. For instance, the output can be 0 or 1 for two classes or 0, 1, 2 … n for n classes.
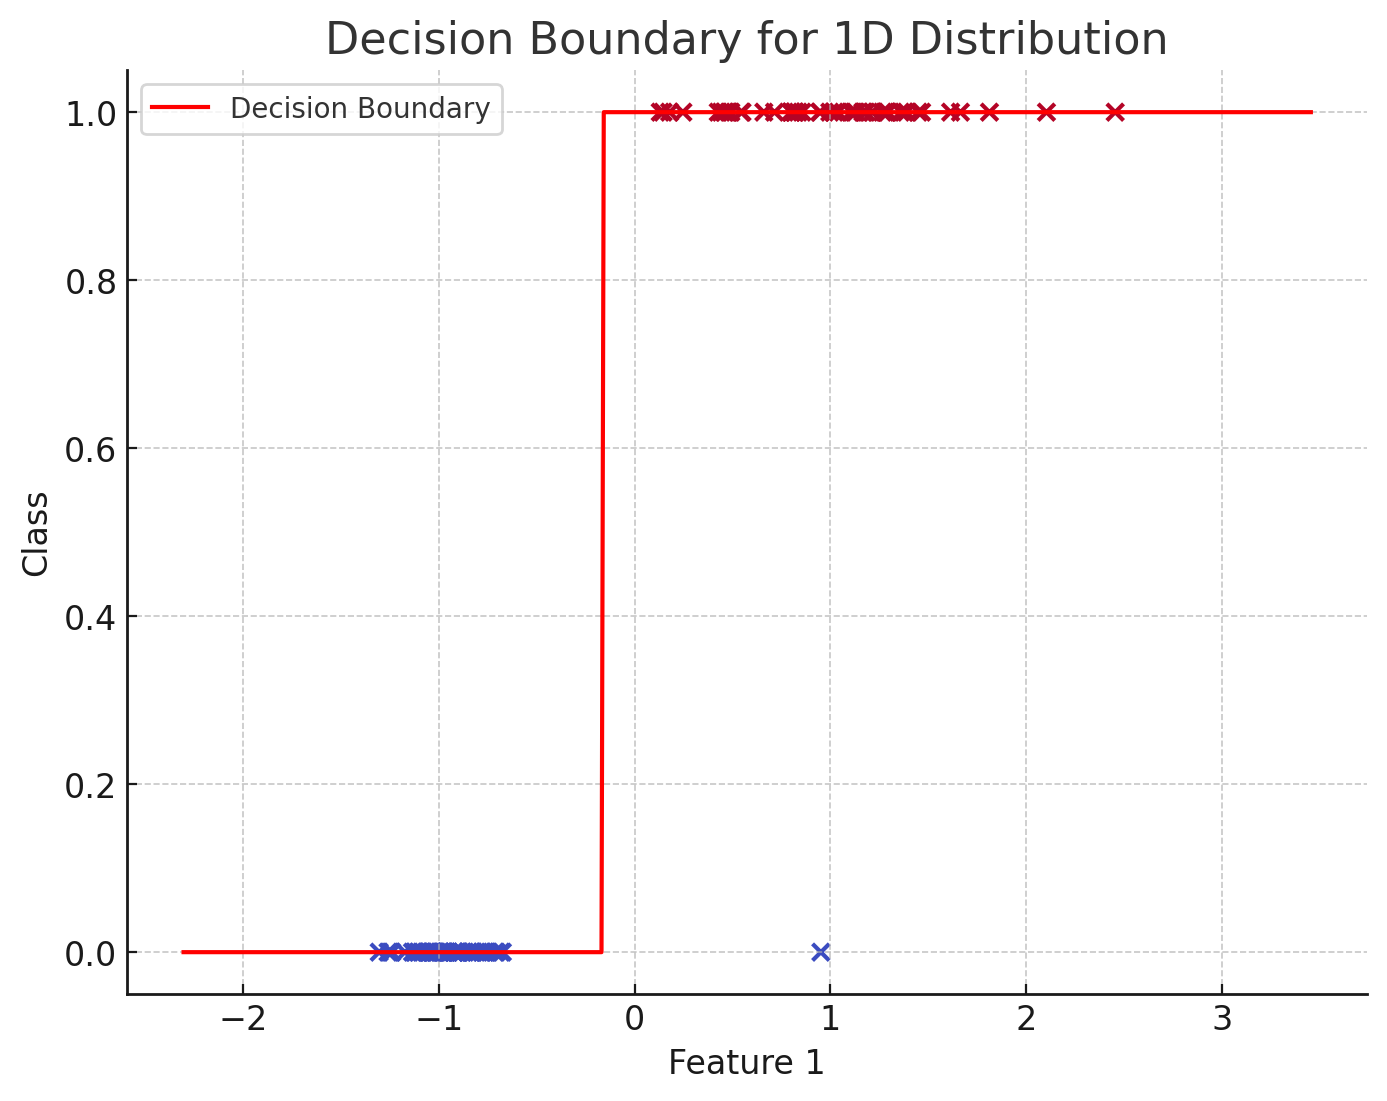
In the simplest scenario, a dataset consists of data points represented by a single feature, each assigned a binary class (0 or 1). The classification problem involves finding a decision boundary, essentially the function that correctly separates these points based on their class.
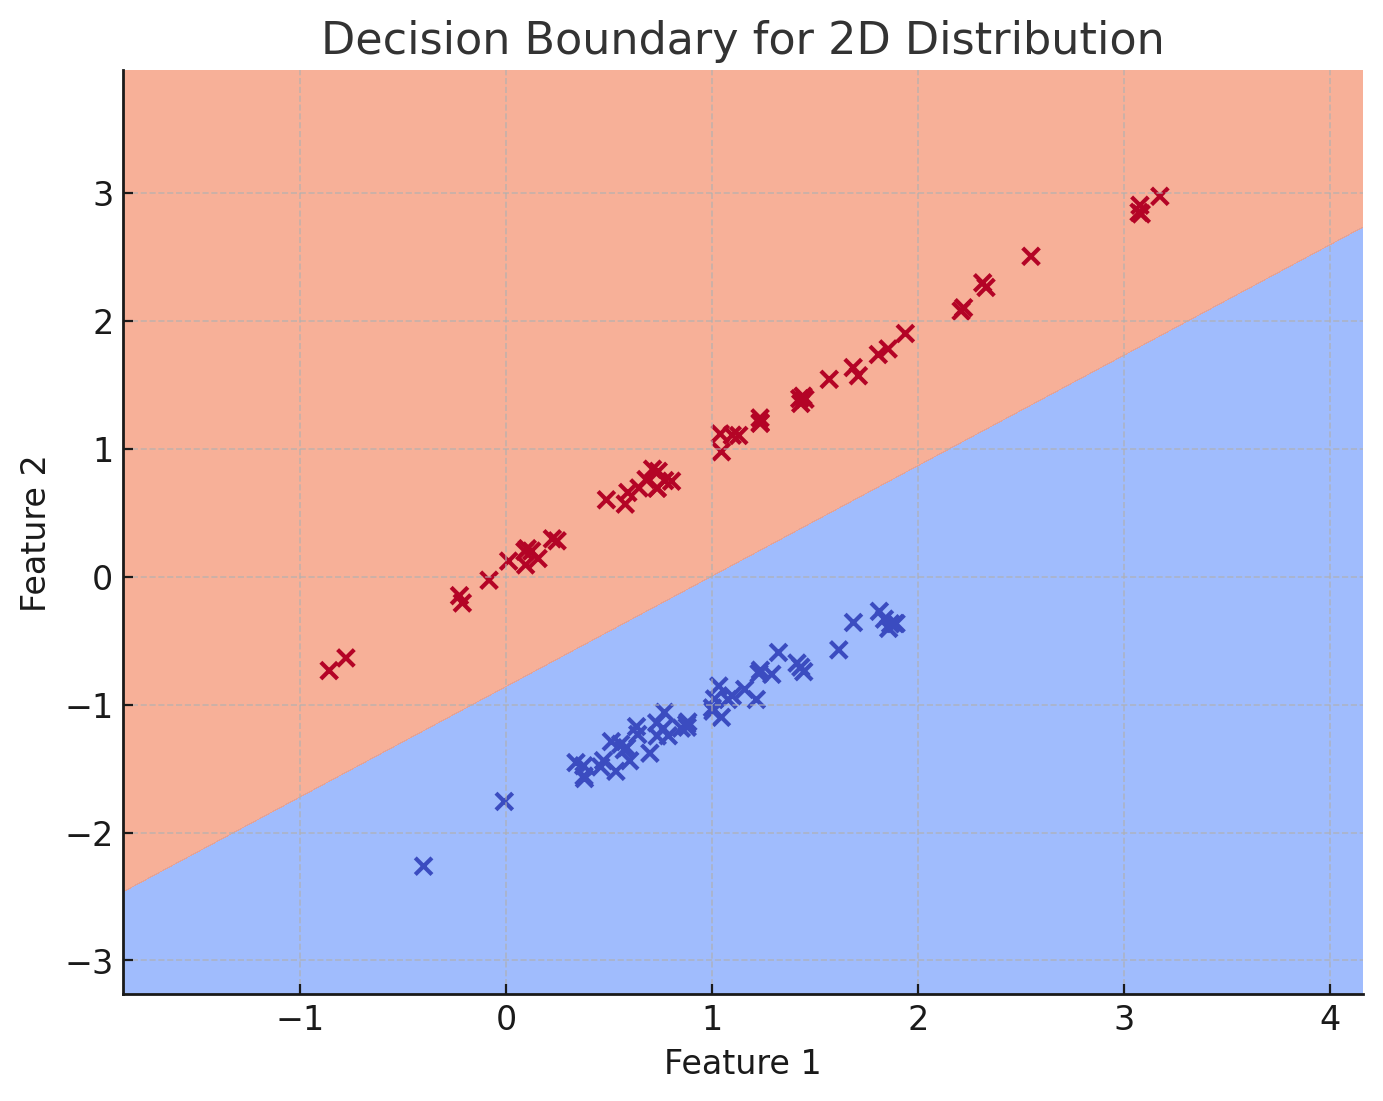
If the dataset consists of two features, we can still visualise it in a 2D space. In this case, the position of the points on the graph corresponds to the two features, while their colour indicates their respective class. In a 2D space, the decision boundary can be visualised as a line that separates two regions.
The above mentioned decision boundaries in are linear, meaning that the function’s parameters are linearly dependent on the features. However, in many real-world cases, the dataset’s distribution is non-linear. This implies that, in 2D, the two groups (or classes) cannot be separated by a simple straight line.
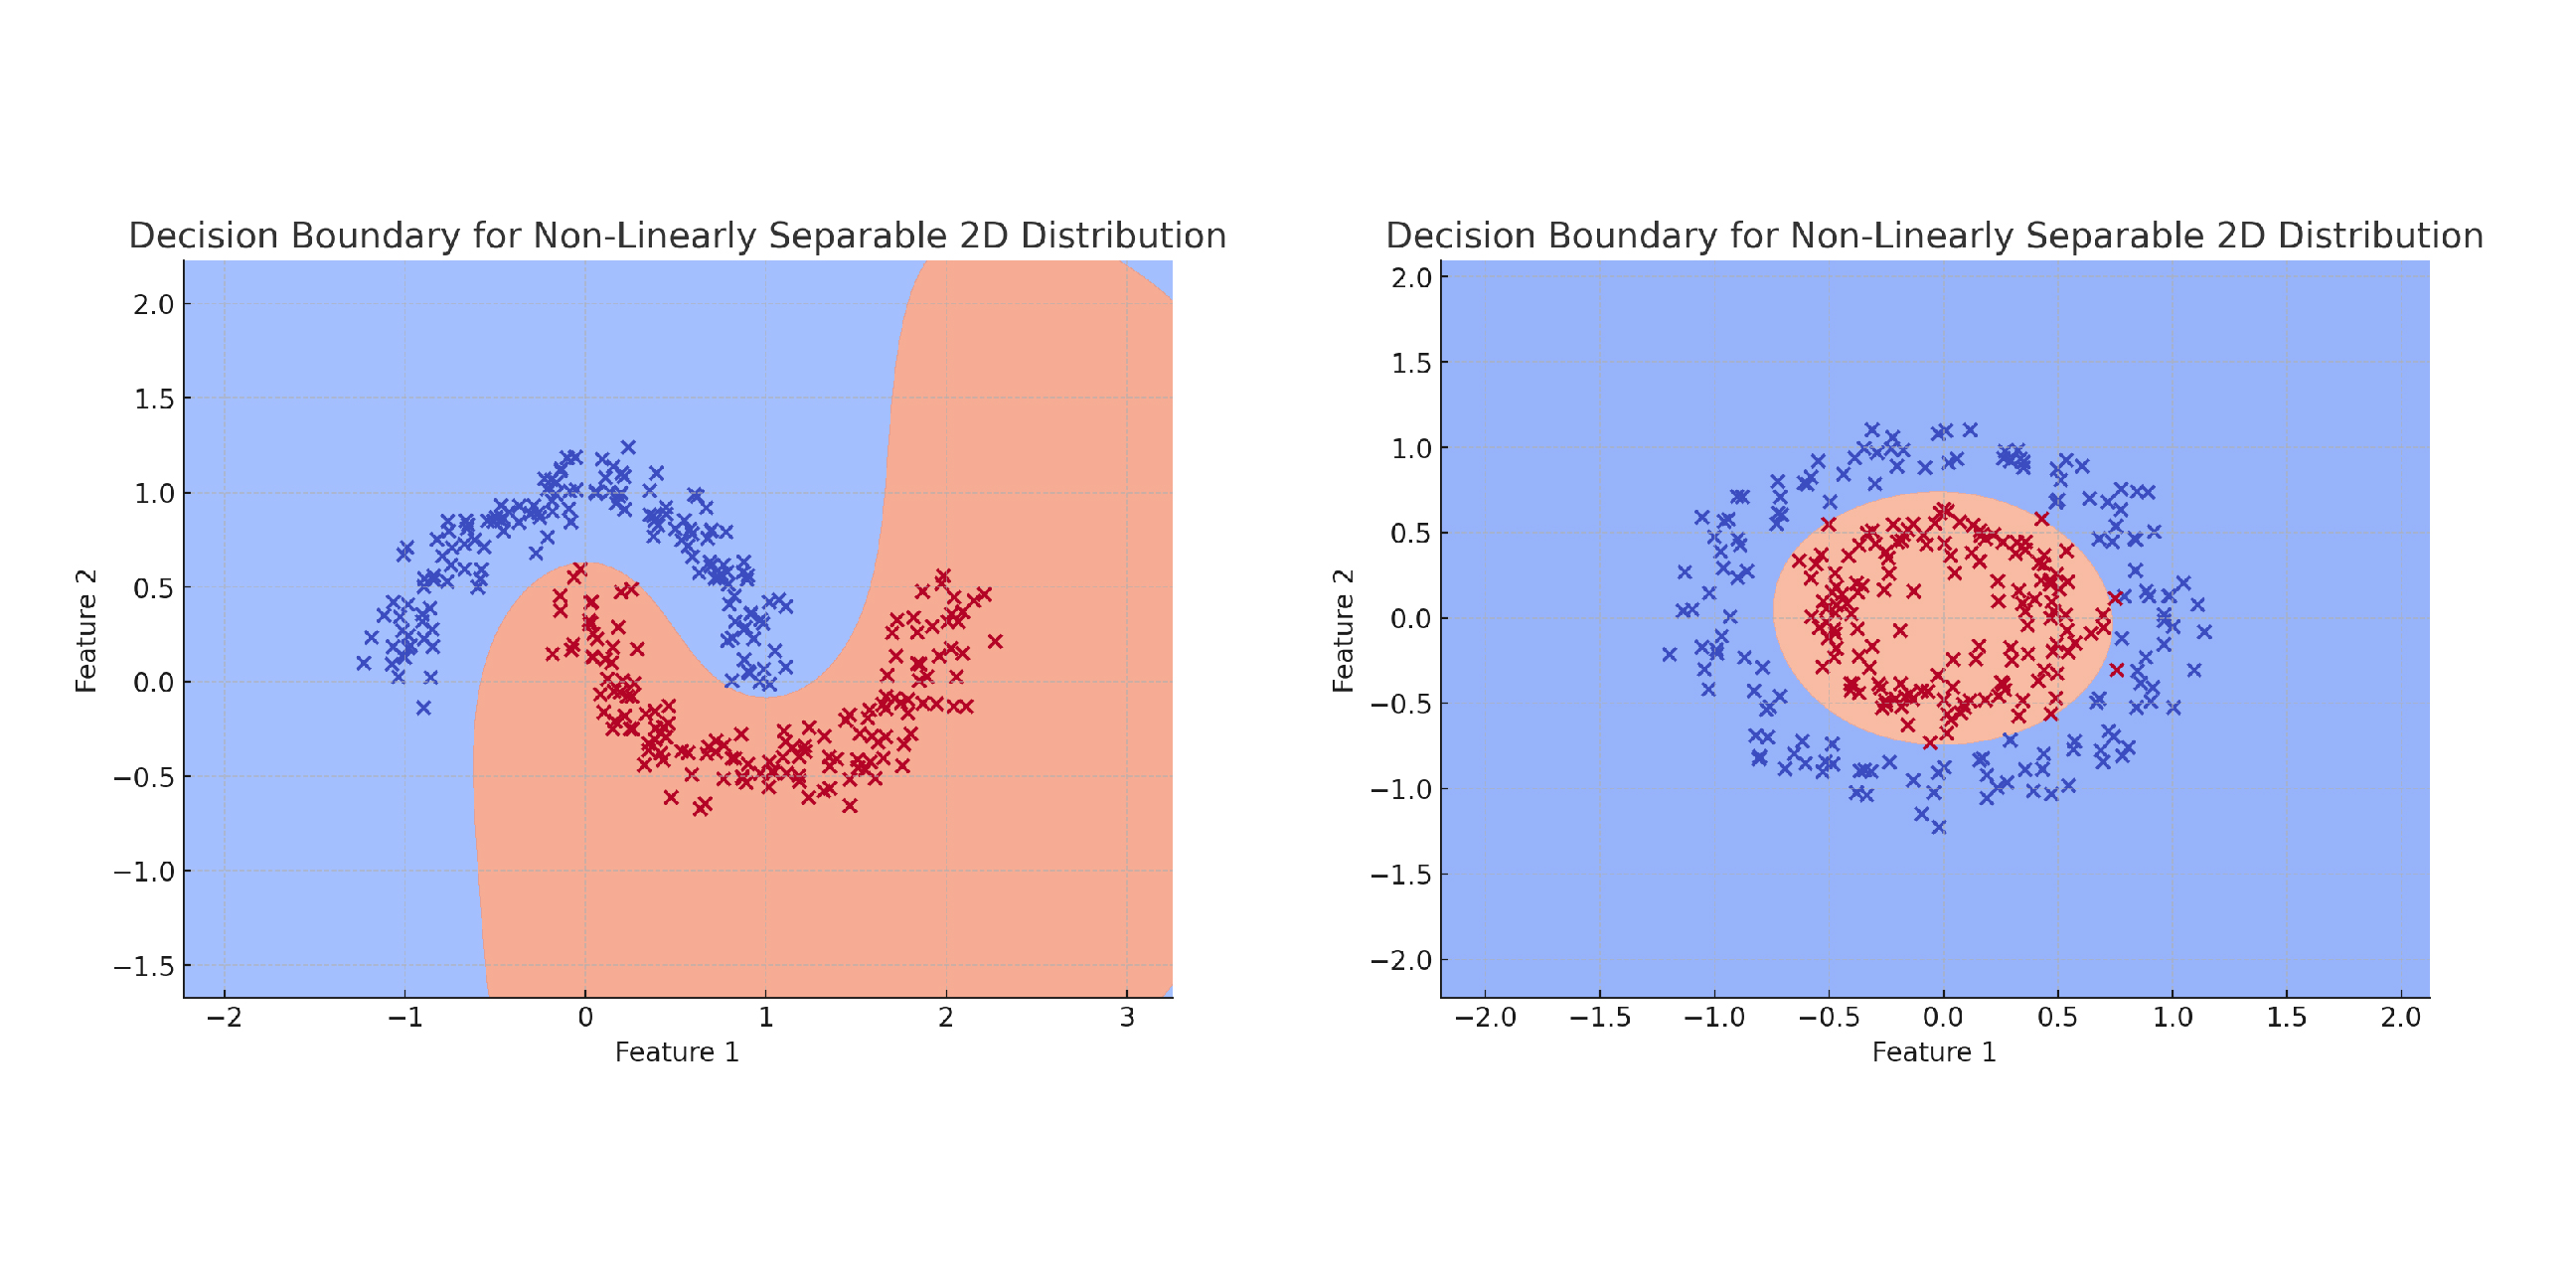
Machine learning (ML) methods can be used to discover decision boundaries for both binary and multi-class classification problems, even when the input data distribution is complex and non-linear.
Binary vs multi-class classification
- In binary classification, the task is determining whether an input belongs to one of two classes. There is only one target class (class 1), and the goal is to classify instances as either belonging to this class (1) or not (0). Binary classification is commonly used for problems such as fraud detection.
- In multi-class classification, the task is to classify input data into one of multiple possible classes. There are more than two target classes, and each instance can belong to only one of these classes. Multi-class classification is used in tasks like image recognition (e.g., classifying images of animals as cat, dog, bird, etc.) or sentiment analysis in natural language processing (e.g., classifying text as positive, negative, or neutral).
Pre-processing data for classification
Data preprocessing for classification involves several steps beyond basic cleaning and normalisation. Depending on the problem, classification algorithms require input in a specific format: for binary classification, classes are represented as 0 and 1, while for multi-class classification, classes may be encoded ordinally as 0, 1, 2, …, n. A common approach for representing multi-class data is through one-hot encoding, where each class is represented as a binary vector (a vector of 0s and 1s, with a 1 indicating the presence of a specific class and 0 for all others).
If the dataset includes continuous features, these can be converted into discrete classes. For instance, a ‘Liveability’ feature might be represented by an average score from 1 to 5, based on ratings by neighbourhood residents. To convert this into classes, you could define a threshold, such as categorising scores above 3 as ‘Good Liveability’ and 3 or below as ‘Poor Liveability.’ Additional classes could be created by defining intermediate ranges.
Another important step is to check the class distribution. Ideally, the classes should be balanced; if one class significantly outweighs another, the machine learning algorithm may become biased toward predicting the majority class more often.
Decision Trees (Building Blocks)
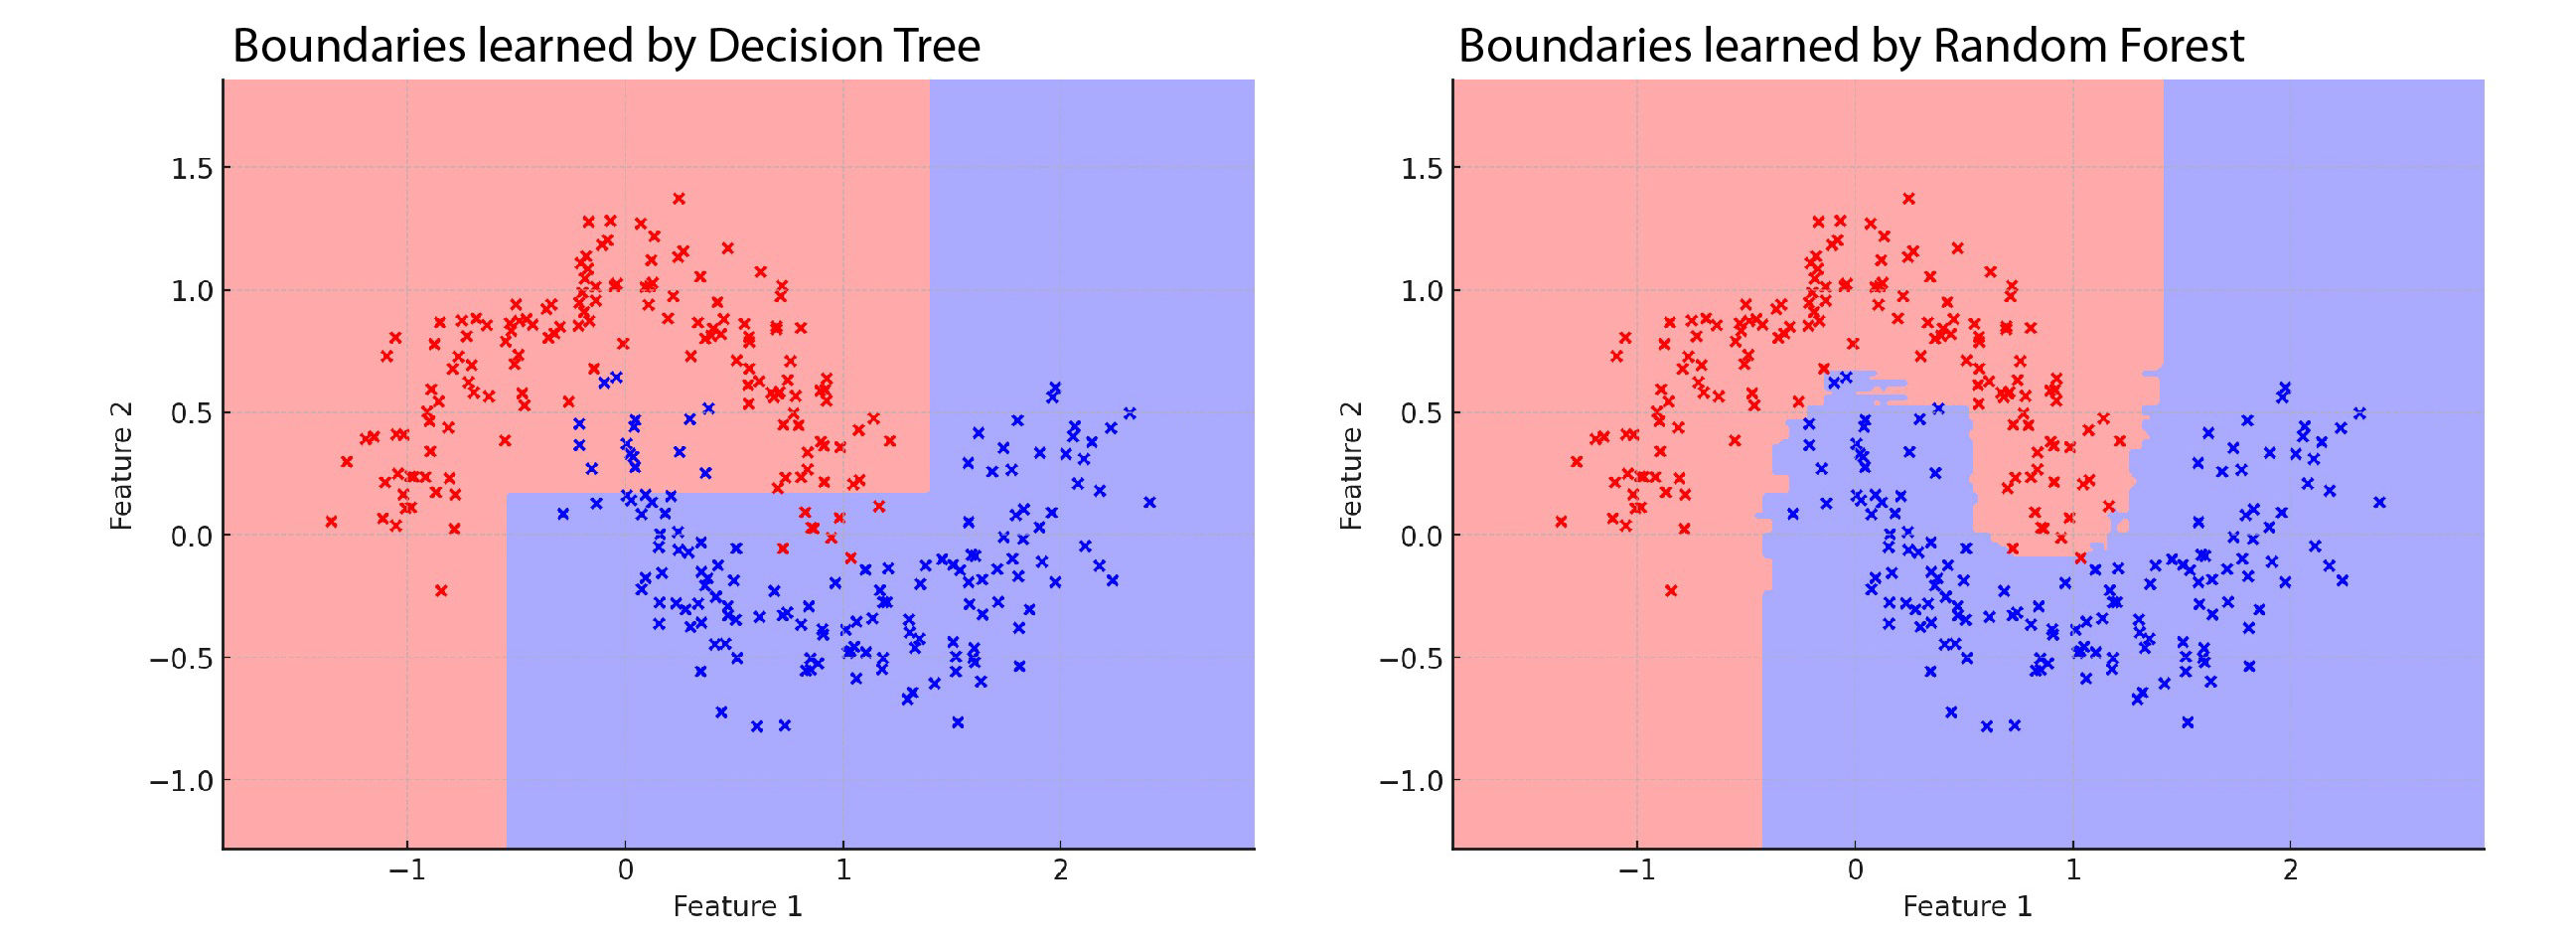
Decision Trees are a type of supervised learning algorithm that can be used for both classification and regression tasks. They are built by recursively splitting the data into subsets based on specific conditions related to the input features. Each split is chosen to maximize the separation between classes (for classification) or minimize prediction error (for regression).
Decision Tree Classifier
A decision tree classifier models the relationship between features and target classes by recursively splitting the dataset at each node. The algorithm creates splits based on the feature values to classify the points into different categories.
The process works as follows: at each tree node, the algorithm checks whether a data point falls within a specific range based on the feature’s value. If the condition is met, the data point is assigned a class, or the tree splits further, continuing down to more nodes.
In the case of classification, the decision tree searches for threshold values (splits) that maximise the separation between classes. The aim is to divide the dataset into regions containing the purest set of classes possible.
Random Forest
A Random Forest combines the predictions of multiple decision trees to improve the prediction accuracy.
The process works as follows: during training, multiple decision trees are generated by randomly selecting subsets of the data and features. For classification, the output of the random forest is determined by a majority vote from all the decision trees, meaning the class most frequently predicted by the individual trees becomes the final prediction.
Since each tree only sees part of the data and features, the random forest is robust against overfitting and often provides higher accuracy than a single decision tree.
Exercise A: Classification with Decision Trees
To get a better understanding on how classifiers work you should follow this simplified example of classifying random points. In the exercise you quickly generate your own dataset of points and classify the point by using a decision tree and the random forest classifier to predict a 1 output class by using Scipy.
Example papers
The following papers provide a clear explanation of how the discussed terminology can be used during research. We highly recommend you to look at these papers.
“Exploring the complex origins of energy poverty in The Netherlands with machine learning” by Longa et al. 2021
- https://doi.org/10.1016/j.enpol.2021.112373
- Descriptive statistical analysis
- Feature importance
Results with 5 features vs 1 feature
Debate A: Classification
If you are following this tutorial because you are attending the course BK3WV4, after you have learned the theory and practiced the exercises, you will attend a workshop in class at TU Delft. The workshop lasts 3 hours. During the workshop, you will work with the tutors. Two hours are contact hours with your tutor and one hour is for activities without tutors. During the first one hour, you will discuss the tutorial with the tutor and your classmates. During the second hour, you will write a first draft of your workshop deliverable. During the third and fourth hour, you will discuss how the content of the workshop relates to your research question.
- How would you use an ML model for classification to answer your research question? Which classes would you select for the prediction problem? And why?
- How would you preprocess the labels of your dataset?
WV4 Line 1 – Workshop 3 – Dataset analysis with Classification 2/2
Classification accuracylink copied
Validation
Validation assesses an ML model’s performance by measuring its prediction error on data not used during training. To validate the training process of an ML model, you generally divide the dataset into at least three subsets: a training set, a validation set, and a test set.
- The training set is used to train the model.
- The validation set is used to monitor the model’s performance during training.
- The test set is used after training to assess the model performance on unseen data.
Generally, you would use 70-80% of your dataset as the training set and divide the remaining 20-30% between the validation and test sets. However, these proportions may vary depending on the size of your dataset and application requirements.
Note: in some cases (small datasets and simpler problems) the validation set is omitted, and the model’s performance is only assessed using the test set after training.
Confusion matrix
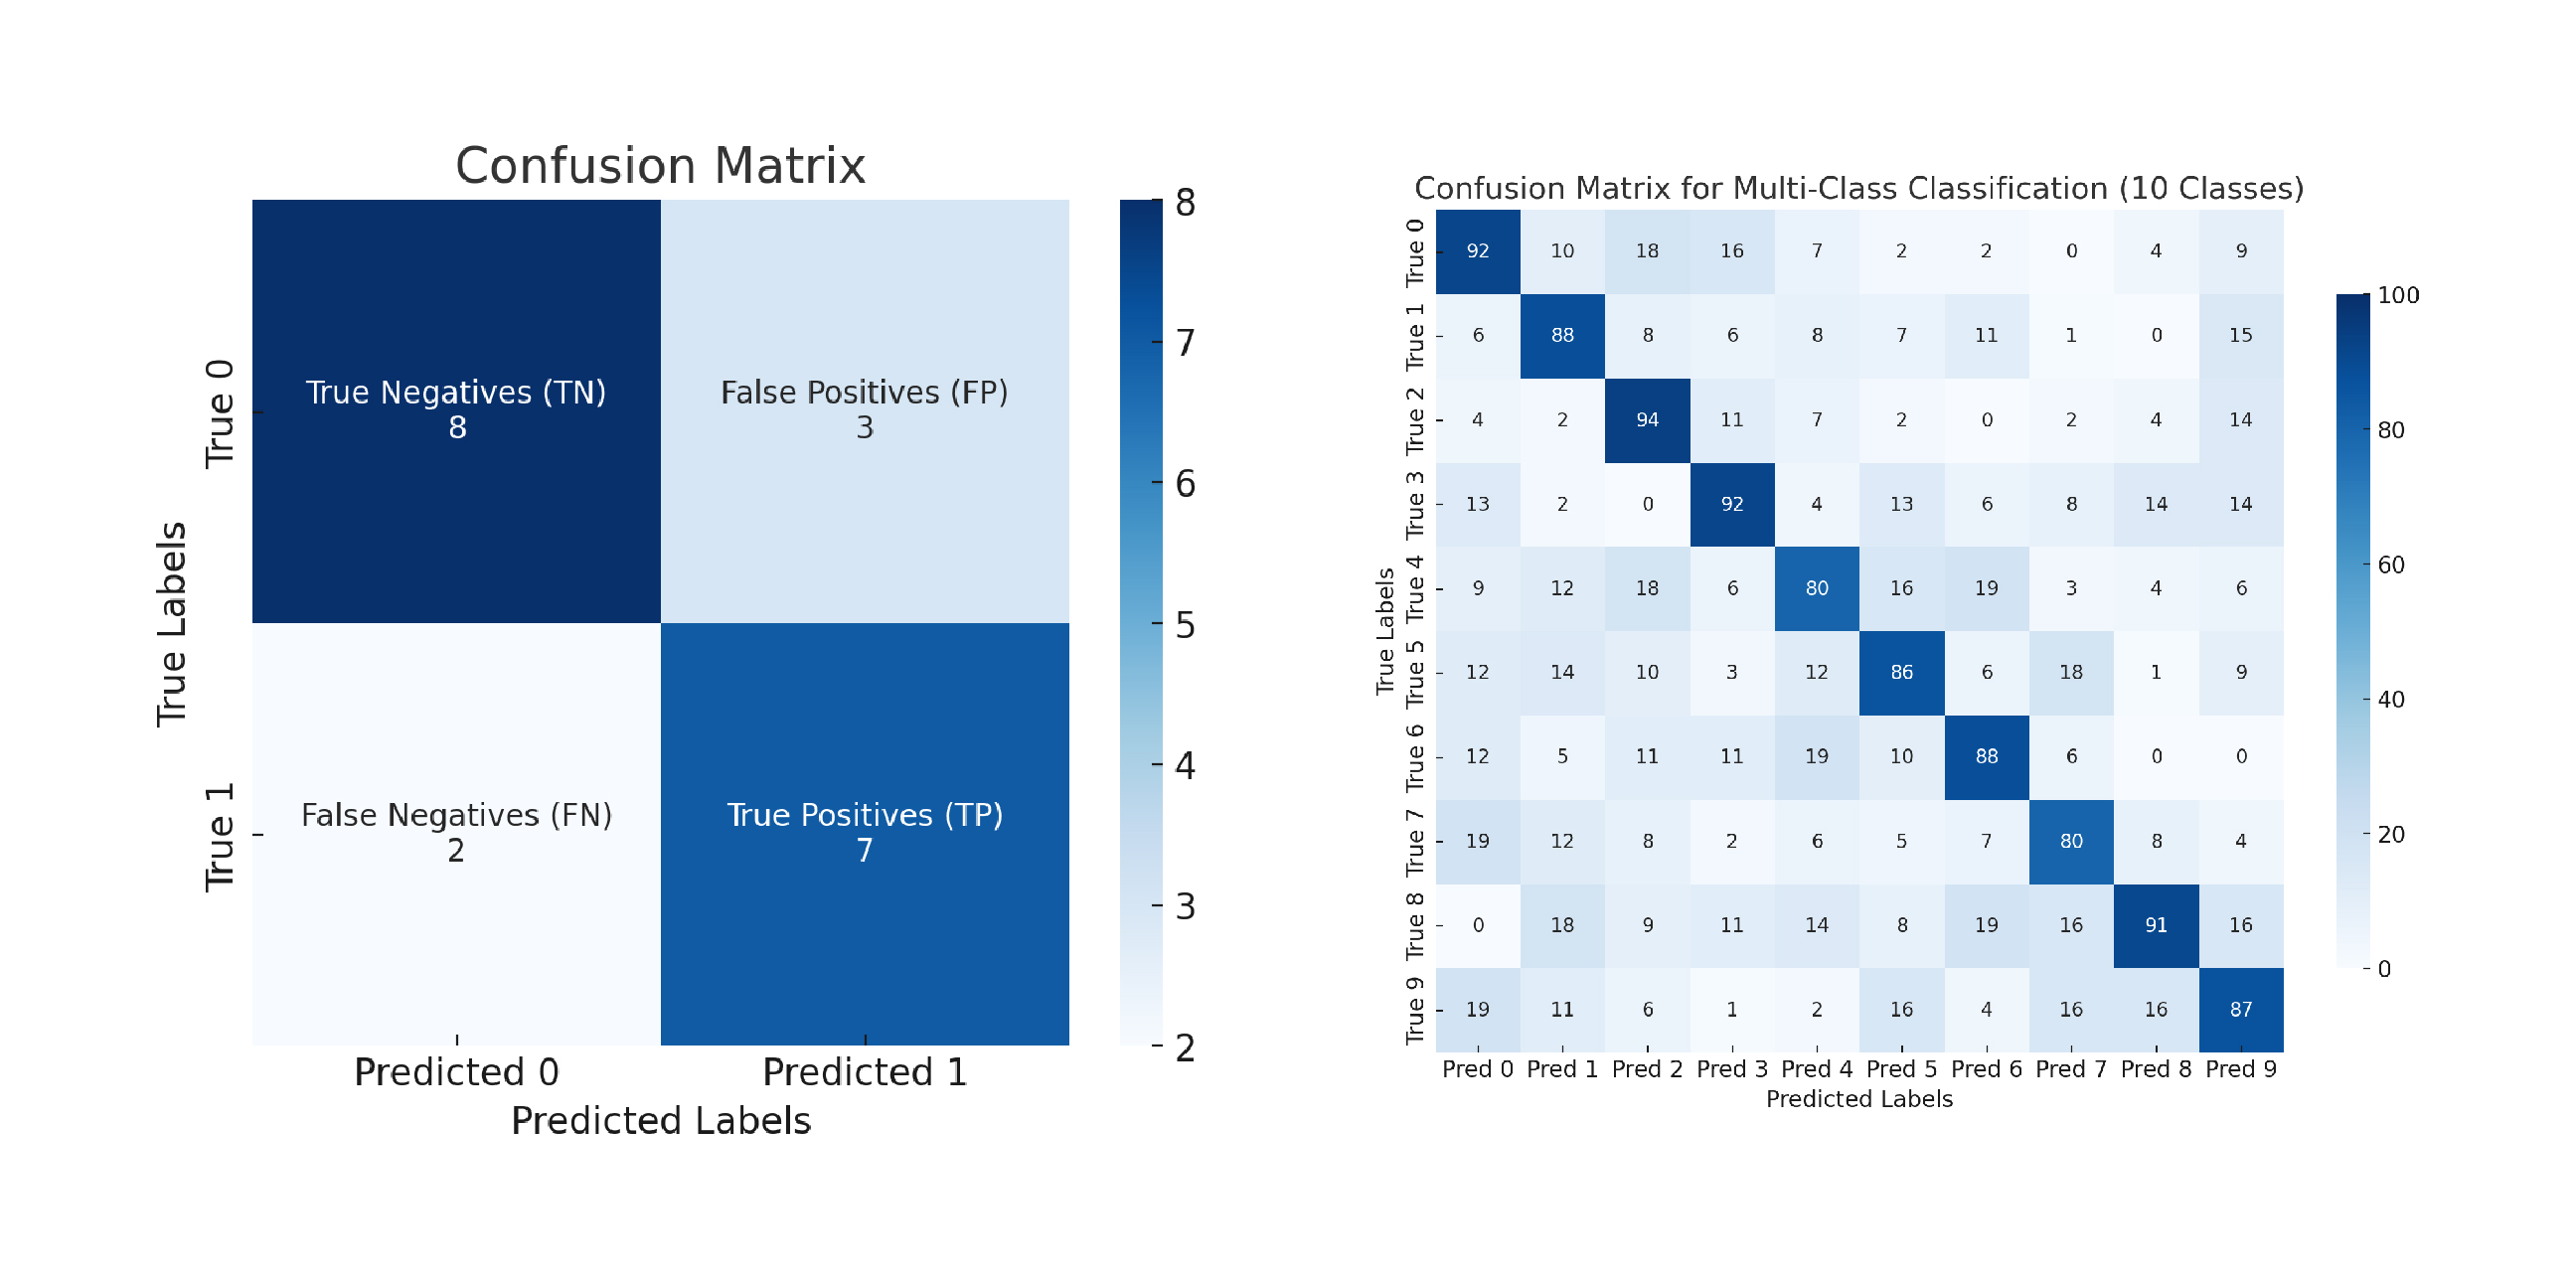
A confusion matrix is a tabular representation of a classification model performance, summarising the number of correct (or True) and wrong (or False) predictions made by the models.
To construct a confusion matrix for a binary classification problem you need to:
- Generate predictions for data points that are known (i.e. for which you know the true or correct label)
- Compare the model’s predictions with the True Labels and count the number of True Positives (TP), True Negatives (TN), False Positives (FP), and False Negatives (FN).
Where:
- TP = Instances that are positive and are correctly predicted as positive by the model.
- TN = Instances that are negative and are correctly predicted as negative by the model.
- FP = Instances that are negative but are incorrectly predicted as positive by the model.
- FN = Instances that are positive but are incorrectly predicted as negative by the model.
Note: confusion matrices can also be used to assess the performance of a multi-class classification model. In this case, the confusion matrix will have a number of rows and columns equal to the number of classes. The diagonal cells represent the number of samples correctly classified for each class, while the off-diagonal cells in each row indicate how many times samples from that class were misclassified as belonging to other classes.
Accuracy
The accuracy of a classification model is calculated as the ratio of the number of correct predictions to the total number of predictions:
Exercise B: Classification Of N-D WoON Data
If you want to put the learned terminology to practice with a real-world problem you should follow this exercise. In this exercise you will use the WoON21 dataset to make prediction for the satisfaction of the living area and energy labels of Dutch housing by creating a hypnosis, selecting features, and training a random forest classifier.
Example papers
The following papers provide a clear explanation of how the discussed terminology can be used during research. We highly recommend you to look at these papers.
“Understanding Urban Human Mobility through Crowdsensed Data” by Zhou et al. 2018
- https://doi.org/10.1109/MCOM.2018.1700569
- Data collection and labelling
- Classification of transportation modes
- Insights from data analytics
Debate B: Using Classification results
If you are following this tutorial because you are attending the course BK3WV4, after you have learned the theory and practiced the exercises, you will attend a workshop in class at TU Delft. The workshop lasts 3 hours. During the workshop, you will work with the tutors. Two hours are contact hours with your tutor and one hour is for activities without tutors. During the first one hour, you will discuss the tutorial with the tutor and your classmates. During the second hour, you will write a first draft of your workshop deliverable. During the third and fourth hour, you will discuss how the content of the workshop relates to your research question.
- How can analysing the key features influencing classification results help answer your research questions?
- How would you use classification results to validate your research hypothesis?
Write your feedback.
Write your feedback on "WV4 Line 1 – Workshop 3 – Dataset analysis with Classification"".
If you're providing a specific feedback to a part of the chapter, mention which part (text, image, or video) that you have specific feedback for."Thank your for your feedback.
Your feedback has been submitted successfully and is now awaiting review. We appreciate your input and will ensure it aligns with our guidelines before it’s published.
