Classification of N-D Data with WoON Dataset
-
Intro
-
Libraries and Dataset
-
Data Preprocessing
-
Training a Random Forest
-
Validating the Model
-
Extra example – Energy label prediction
-
Conclusion
Information
| Primary software used | Python |
| Software version | 1.0 |
| Course | Classification of N-D Data with WoON Dataset |
| Primary subject | AI & ML |
| Secondary subject | Machine Learning |
| Level | Intermediate |
| Last updated | November 12, 2025 |
| Keywords |
Responsible
| Teachers | |
| Faculty |
Classification of N-D Data with WoON Dataset 0/6
Classification of N-D Data with WoON Dataset
Example of classifying neighborhood satisfaction with the WoON21 dataset.
This example introduces classification for n-dimensional data points. We will use the WoON2021 dataset as a case study. The tutorial will guide you through formulating, testing and reframing a research hypothesis using an advanced implementation of Decision Trees, called Random Forest, for classification.

Exercise File
To discuss and understand data set cleaning, we will use the WoON21 dataset. The dataset consists of data on the composition of households, the housing situation, housing preferences, housing costs and moving behaviour. The survey is conducted every three years by the Dutch government and is an important basis for the housing policy in The Netherlands.
You can download the dataset on the BK3WV4 Brightspace page. If you want to know more about the WoON dataset you can visit the dashboard of Woononderzoek Nederland. You can also download your own selection of the dataset at the Citavista Databank in case you do not have access to the Brightspace.
Additionally, here you can download additional information, such as the explanation of the variables in the WoON2021 dataset in both Dutch and English.
Classification of N-D Data with WoON Dataset 1/6
Libraries and Datasetlink copied
Import Libraries
We start by importing the required libraries for data analysis, machine learning and data visualisation, and generating the dataset.
from google.colab import drive
import pandas as pd
import numpy as np
import matplotlib.pyplot as plt
from sklearn.tree import DecisionTreeClassifier
from sklearn.ensemble import RandomForestClassifier
from sklearn.model_selection import train_test_split
from sklearn.metrics import accuracy_score, confusion_matrix, ConfusionMatrixDisplay
Load Dataset
We import the WoON2021 dataset from our Google Drive folder and construct a pandas dataframe. We use the last line in the following code snippet to print some statistics about the dataframe values. Each column represents a feature we may want to select to represent our data points for the classification problem.
drive.mount('/content/drive')
file_path = '/content/drive/MyDrive/WoON21_dataset.csv'

# construct dataframe object
df_loaded = pd.read_csv(file_path)

#visualise the imported dataset
df_loaded.describe()
Classification of N-D Data with WoON Dataset 2/6
Data Preprocessinglink copied
After loading the dataset, we need to prepare the data for the classification task. We need two vectors: one for the input data, and one for the output class. We will first extract features from the dataframe object to represent our data points and then construct the class.
To select features, we must formulate a research hypothesis. For instance, we may select perceived liveability as a relevant predictor for a house value and hypothesise that liveability depends on how close certain amenities are to a respondent’s home and how the neighbourhood is perceived.
Construct Input and Output Vectors
Based on the research hypothesis we will extract specific columns from the dataframe to construct feature vector X and output class y.
We filter the dataset using the defining the relevant features, and ‘twoonomg’ to extract the liveability scores. We then proceed plotting all the null counts per column. By creating a plot of the null counts, you get insights in which feature contains missing information.
# Filter the dataframe
features_woonomg = ['twoonomg', 'cohesie', 'tgehecht', 'conbuur1', 'tbevsams',
'hwmbrt', 'gemgrot7', 'tbebouw', 'tonderhbrt', 'tvervele', 'vzafstandkdv', 'vzafstandbiblio', 'vzafstandcafe', 'vzafstandoprith']
df_selection = df_loaded[features_woonomg]
df_selection.columns


# Count the null values of all the columns and plot the results
null_counts = df_selection.isnull().sum()

# create null count plot per column
plt.figure(figsize=(12, 6))
plt.bar(range(1, len(null_counts) + 1), null_counts.values)

plt.title('Null Values in Each Column')
plt.xlabel('Columns')
plt.ylabel('Number of Null Values')
plt.show()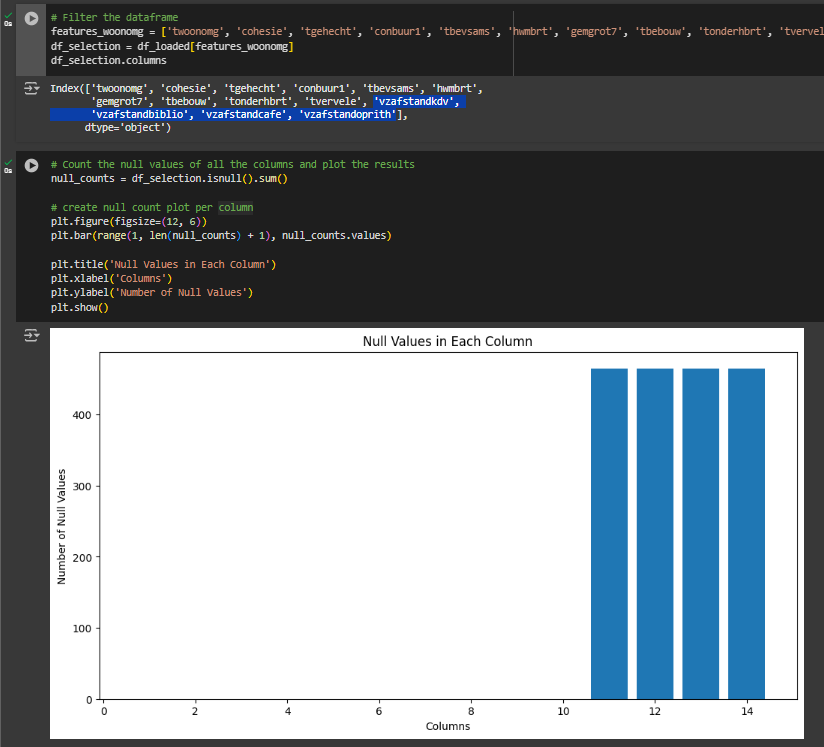
In the case of the WoOn dataset we see that the distance features contain missing data. We proceed with removing all samples containing null values.
By checking the shape of the dataset before and after the removal of null values, we find out that the number of samples containing information for all selected features is slightly less than the original dataset. In some cases you will see that after removing all missing data the number of samples could reduce with 10 times. Working with such a small number of samples, increases the complexity of the classification problem.
# drop rows with NA values
df_selection_removed = df_selection.dropna()

# print df shape before and after removing NA values
print('dataset shape before data cleaning', df_selection.shape)
print('dataset shape after data cleaning', df_selection_removed.shape)
Output:
dataset shape before data cleaning (20000, 21)
dataset shape after data cleaning (19535, 21)
Class Balancing
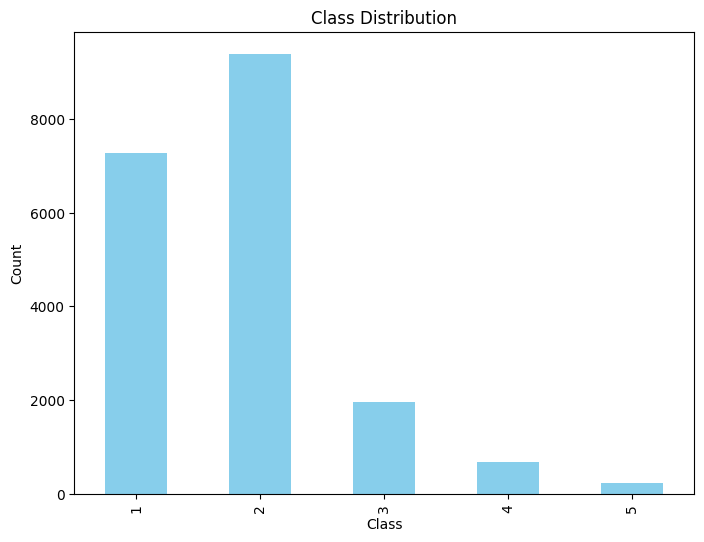
We construct the output vector y by isolating the ‘twoonomg’ feature from the dataset. The ‘twoonomg’ feature in the WoON dataset represents a liveability satisfaction score measured on a scale of 1 to 5, with the following values:
- Very satisfied
- Satisfied
- Neither satisfied nor dissatisfied
- Dissatisfied
- Very dissatisfied
We plot the classes distribution to check whether the dataset is balanced, that is, if it contains a similar number of samples for each and every class. We see that the dataset has a considerably high number of samples assigned with class 2 (Satisfied), which makes the dataset highly unbalanced.
# construct y vector
y = df_selection_removed['twoonomg']

# Measure class distribution
class_counts = y.value_counts().sort_index()

# plot class distribution
plt.figure(figsize=(8, 6))
class_counts.plot(kind='bar', color='skyblue')
plt.title('Class Distribution')
plt.xlabel('Class')
plt.ylabel('Count')
plt.show()
To overcome this issue, we will simplify our classes representation.
We will first assign a new class 1 to samples with ‘twoonomg’ values 1 or 2 and class 0 for ‘twoonomg’ values 3-5. This way we end up with 2 classes: 1 representing ‘high satisfaction’ and 0 representing ‘low satisfaction’, which turns our problem into a binary classification.
# Convert 'twoning' into 3 categories:
# 0 = Very Satisfied (value 1)
# 1 = Satisfied (value 2)
# 2 = Low Satisfaction (value >= 3)
y_3class = y.apply(lambda x: 1 if x <= 1 else (2 if x <= 2 else 3))

# Measure class distribution
class_counts = y_3class.value_counts().sort_index()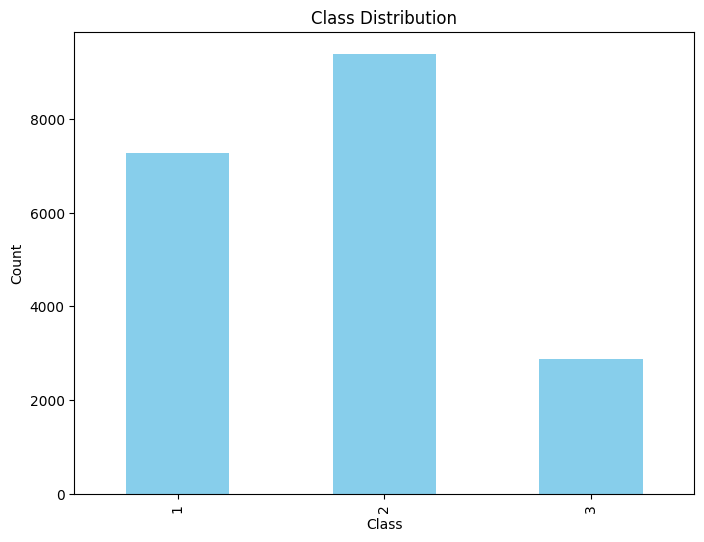
By plotting the distribution, we see that the number of samples is closer, but the dataset is still unbalanced.
# plot class distribution
plt.figure(figsize=(8, 6))
class_counts.plot(kind='bar', color='skyblue')
plt.title('Class Distribution')
plt.xlabel('Class')
plt.ylabel('Count')
plt.show()
The simplest way to correct class imbalance consists of reducing the number of samples labelled as 1 to match the number of samples labelled as 0.
We first rebuild our dataset with the updated y values and sample an equal number of data points for class 0 and class 1. We then reconstruct our input vector X and output vector y. The class distribution plot confirms that we now have an equal number of samples for each class.
# update dataset with new binary classes
df_selection_removed['twoonomg'] = y_3class

# Measure minimum count for balancing
class_counts = y_3class.value_counts().sort_index()
min_count = class_counts.min()

# Downsample each class to the minimum count
df_balanced = pd.concat([
    df_selection_removed[df_selection_removed['twoonomg'] == cls].sample(min_count, random_state=42)
    for cls in class_counts.index
])

# Separate the balanced X and y
X_new = df_balanced.drop('twoonomg', axis=1)
y_new = df_balanced['twoonomg']
class_counts_balanced = y_new.value_counts().sort_index()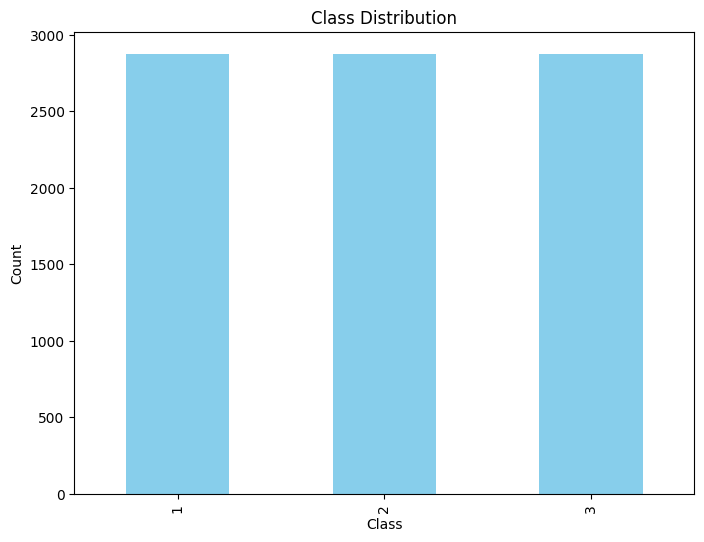
We can inspect the class distribution by plotting the new classes.
# plot class distribution
plt.figure(figsize=(8, 6))
class_counts.plot(kind='bar', color='skyblue')
plt.title('Class Distribution')
plt.xlabel('Class')
plt.ylabel('Count')
plt.show()
Note: this approach may limit data availability and might not always be the best solution in every scenario.
Classification of N-D Data with WoON Dataset 3/6
Training a Random Forestlink copied
We will use the preprocessed dataset to train a machine learning model called Random Forest. This model combines the predictions of multiple Decision Trees, each trained on different random subsets of the training dataset, both in terms of samples and features, to improve overall performance and reduce overfitting.
We start by splitting our dataset into a training and test set. Then, we use the RandomForestClassifier function, specifying the n_estimators hyperparameter, which controls the number of trees in the forest. This parameter can be fine-tuned to improve the model’s accuracy.
# define the X (features) and y (target)
X = df_balanced.drop('twoonomg', axis=1)
y = df_balanced['twoonomg']

# Split the data into training and testing sets
X_train, X_test, y_train, y_test = train_test_split(X, y, test_size=0.2, random_state=42)

# Train the Random Forest classifier
rf_classifier = RandomForestClassifier(n_estimators=50,random_state=42)
rf_classifier.fit(X_train, y_train)
Classification of N-D Data with WoON Dataset 4/6
Validating the Modellink copied
We validate the model by first predicting the class of the test dataset. We then compare each predicted class with the true one and compute the classification accuracy.
# Predict on the test set
y_pred = rf_classifier.predict(X_test)

# Calculate accuracy
accuracy = accuracy_score(y_test, y_pred)
print(f"Accuracy: {accuracy:.2f}")
Output:
Accuracy: 0.64
We finally plot the confusion matrix. The graph shows that the model is not biased towards any specific class and that its reliability is class independent.
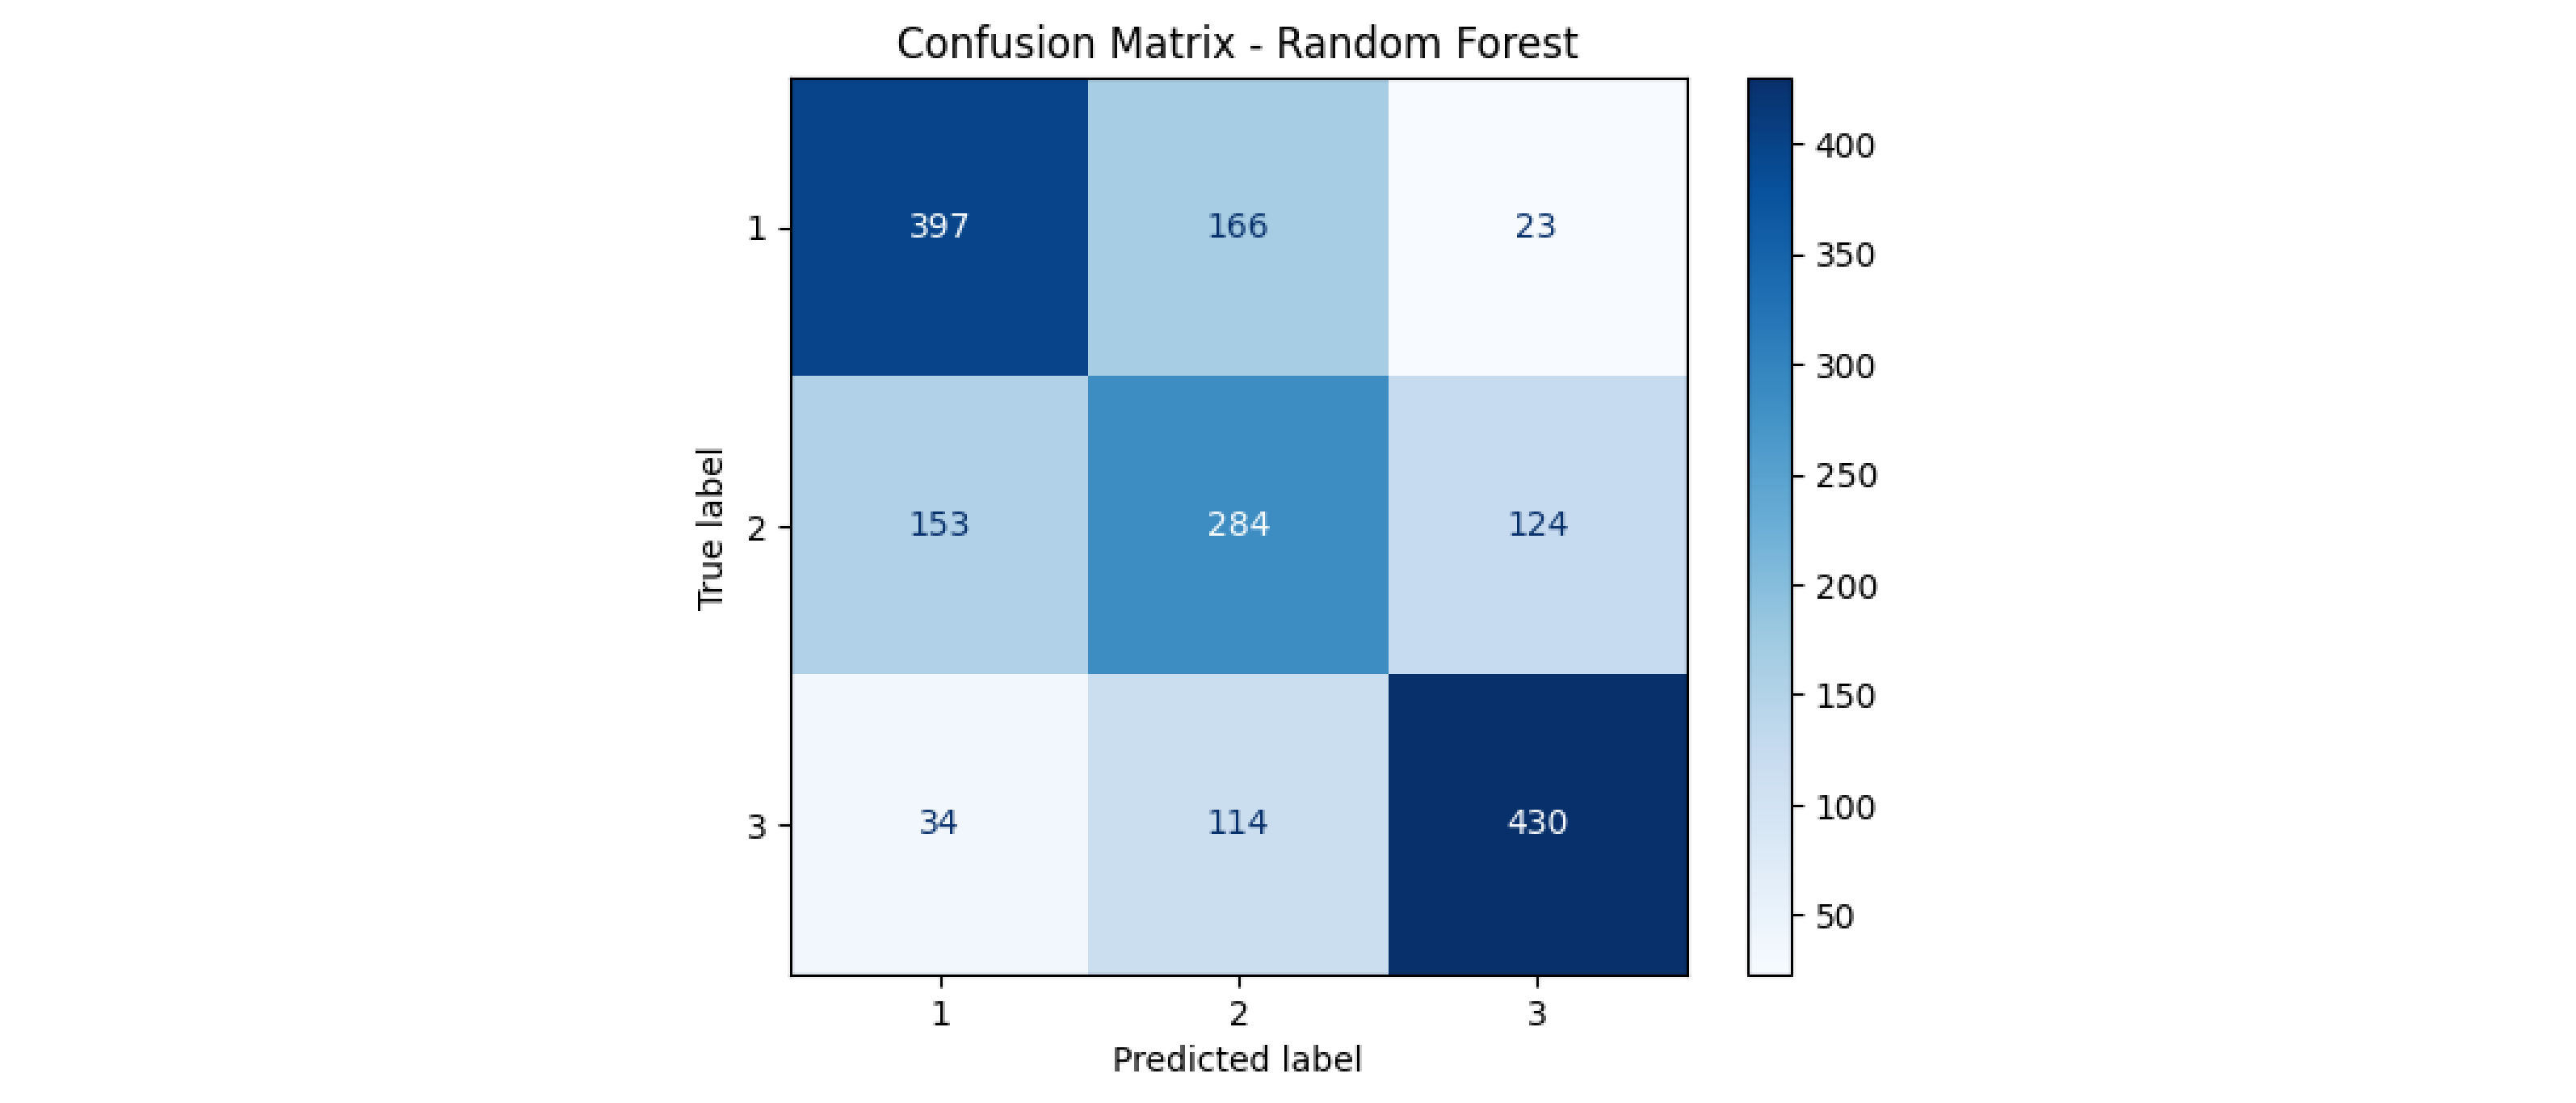
Our model achieves an accuracy of 0.64. This result can certainly be improved by providing a larger number of samples. However, this might indicate that our initial hypothesis, even if correct to an extent, was incomplete. In fact, one can easily assume that distance to amenities would not be the only parameter affecting living satisfaction. refining this hypothesis could potentially reveal deeper connections between several other features and inhabitant preferences.
Classification of N-D Data with WoON Dataset 5/6
Extra example – Energy label predictionlink copied
In this chapter we will quickly walk through a different example with the same dataset. In many cases, various data analysis can be executed with the same dataset. The WoON21 dataset is a large dataset with various topics of data. We could use this dataset to predict something completely different from the example before.
In this case we select features based on the following hypothesis: aside from the perceived livability, the energy label is a relevant predictor of a house value. The hypothesis is that the energy label is highly affected by the buildings installation, characteristics of the house, and the type of people.
Define dataset
We start by defining the dataset. This time we are using the filter option. Some unnecessary columns that were added with the filter should be removed before continuing.
# Filter the dataframe
df_selection_energy = df_loaded.filter(regex='energieklasse|vorm|woontype|hoog|oppwon|bjaark|zonpaneeng|typglaswoonk|verwwon|ventilatie|isolatie|aantalpp5|samhh5|tocht|schimmel|warm')
df_selection_energy = df_selection_energy.drop(['vvorm', 'vvormkam', 'vvormbj', 'vbjaark', 'gvorm', 'gvormkam_n', 'gvormeig', 'ghoog_n', 'typcolwarm'], axis=1)
df_selection_energy.columns
Remove samples with missing data
The next step is pre-processing the dataset by first removing the samples with missing data and next looking at the distribution of the target value.
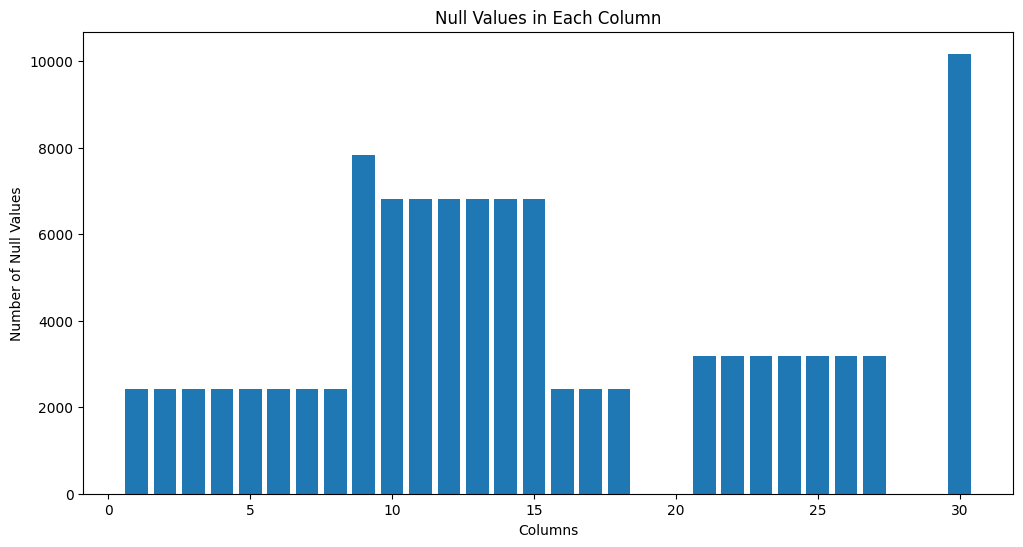
Start by plotting the number of missing data per feature.
# Investigate the missing data per feature
null_counts = df_selection_energy.isnull().sum()

# Create a plot
plt.figure(figsize=(12, 6))
plt.bar(range(1, len(null_counts) + 1), null_counts.values)
plt.title('Null Values in Each Column')
plt.xlabel('Columns')
plt.ylabel('Number of Null Values')
plt.show()
As you can see, the number of missing values is way higher than in the example before. We will see the results of this when removing the missing values.
Now we will drop the NA values and investigate the shape of the dataset.
# drop rows with NA values
df_selection_energy_removed = df_selection_energy.dropna()

# print df shape before and after removing NA values
print('dataset shape before data cleaning', df_selection_energy.shape)
print('dataset shape after data cleaning', df_selection_energy_removed.shape)
Output:
dataset shape before data cleaning (20000, 30)
dataset shape after data cleaning (4255, 30)
Note that after removing all missing data the number of samples is reduced significantly. Working with such a small number of samples, increases the complexity of the classification problem.
Balance target classes
Again we will balance the distribution of the target classes. In this case the energy label has 7 classes in total. By investigating the distribution over the classes we came up with the following classification to simplify the classification.
We will simplify the classes to 3 categories:
- label A
- label B & C
- label D and lower
We can run this condensed code to simplify the classes and balance them:
# Construct the target vector and measure class distribution
y = df_selection_energy_removed['energieklasse']
class_counts_y = y.value_counts().sort_index()

# Convert 'energieklasse' into 3 categories
# 1 = label A
# 2 = label B & C
# 3 = label D and lower
df_selection_energy_removed['energieklasse'] = y.apply(lambda x: 1 if x <= 1 else (2 if x <= 3 else 3))
class_counts_y3 = df_selection_energy_removed['energieklasse'].value_counts().sort_index()

# Balance the dataset by downsampling each class
min_count = class_counts_y3.min()
df_balanced_energy = pd.concat([
    group.sample(min_count, random_state=42)
    for _, group in df_selection_energy_removed.groupby('energieklasse')
])

# Measure class distribution for balanced data
y_new = df_balanced_energy['energieklasse']
class_counts_balanced = y_new.value_counts().sort_index()
You can show the results of this with the following code:
# Create a figure with three subplots to show the changes in class distribution
fig, axes = plt.subplots(1, 3, figsize=(22, 6))

# First subplot: 7 energy classes as in dataset
class_counts_y.plot(kind='bar', color='skyblue', ax=axes[0])
axes[0].set_title('Class Distribution (7 classes)')
axes[0].set_xlabel('Class')
axes[0].set_ylabel('Count')

# Second subplot: 3 energy classes by simplifying
class_counts_y3.plot(kind='bar', color='skyblue', ax=axes[1])
axes[1].set_title('Class Distribution (3 classes)')
axes[1].set_xlabel('Class')
axes[1].set_ylabel('Count')

# Third subplot: balanced 3 classes
class_counts_balanced.plot(kind='bar', color='skyblue', ax=axes[2])
axes[2].set_title('Class Distribution (Balanced)')
axes[2].set_xlabel('Class')
axes[2].set_ylabel('Count')

# Show figure
plt.show()
Training and validating the ML model
The only thing left to do is training and validating the machine learning model. We are again, using the Random Forest Classifier.
Start by separating the features and target, splitting the data into training and test data, and train the classifier.
# Separate features (X) and target (y)
X = df_balanced_energy.drop('energieklasse', axis=1)
y = df_balanced_energy['energieklasse']

# Split the data into training and testing sets
X_train, X_test, y_train, y_test = train_test_split(X, y, test_size=0.2, random_state=42)

# Train the Random Forest classifier
rf_classifier = RandomForestClassifier(n_estimators=50,random_state=42)
rf_classifier.fit(X_train, y_train)
Next validate the model by testing the accuracy and investigating the confusion matrix.
# Predict on the test set
y_pred = rf_classifier.predict(X_test)

# Calculate accuracy
accuracy = accuracy_score(y_test, y_pred)
print(f"Accuracy: {accuracy:.2f}")
Output:
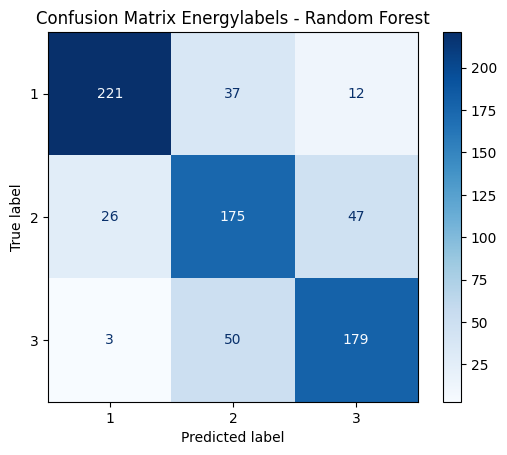
Accuracy: 0.77
# Plot the confusion matrix
conf_matrix = confusion_matrix(y_test, y_pred)

disp = ConfusionMatrixDisplay(confusion_matrix=conf_matrix, display_labels=rf_classifier.classes_)
disp.plot(cmap="Blues")
plt.title("Confusion Matrix Energylabels - Random Forest")
plt.show()
This model achieves an accuracy of 0.77. Looking at the confusion matrix, we so no bias towards one class. However, the result can certainly be improved by providing a larger number of samples, fine-tuning the selected features, and the pre-processing of the dataset.
Classification of N-D Data with WoON Dataset 6/6
Conclusionlink copied
This tutorial provided an overview of classification with Random Forests, an advanced implementation of Decision Trees for handling n-dimensional data. Using the WoON2021 dataset as a case study, you learned to set up a classification model, preprocess data, and address class imbalance to create a dataset for training. You also explored formulating a research hypothesis for classification problems and validating such a hypothesis by interpreting classification results.
Exercise file
You can download the full script here:
Write your feedback.
Write your feedback on "Classification of N-D Data with WoON Dataset"".
If you're providing a specific feedback to a part of the chapter, mention which part (text, image, or video) that you have specific feedback for."Thank your for your feedback.
Your feedback has been submitted successfully and is now awaiting review. We appreciate your input and will ensure it aligns with our guidelines before it’s published.
