QGIS – Vector Data Layers Creation
-
Intro
-
Adding layers
-
Creating vector data
-
Adding vectors
-
Useful links
Information
| Primary software used | QGIS |
| Software version | 1.0 |
| Course | QGIS – Vector Data Layers Creation |
| Primary subject | 3D Modelling |
| Secondary subject | Geospatial and Geographic Information Systems |
| Level | Intermediate |
| Last updated | November 11, 2024 |
| Keywords |
Responsible
| Faculty |
QGIS – Vector Data Layers Creation 0/4
QGIS – Vector Data Layers Creation
Vector data can be used directly to analyse geographical data, but it might also be useful to first compute new data like area data. The following tutorials show some analyses and computations that can be done with vector data.
QGIS – Vector Data Layers Creation 1/4
Adding layerslink copied
When you first open the QGIS interface, the map canvas will be empty. In order to view items on the map, you will need to add some layers to the project. This tutorial will explain the basics of adding vector and raster layers to the map.
Related tutorials:
Background
Vectors and rasters are the two main types of data supported by GIS (Geographic Information Systems). Vectors represent geospatial data as geometrical shapes. Vectors can either be polygons, lines or points. Rasters, on the other hand, are made up of pixels rather than discrete geometrical shapes and are basically any type of digital image. For example, digital aerial photographs, satellite imagery or scans of maps. The differences between the two data types mean that vectors are generally better for representing discrete features, while rasters are better for representing data that varies continuously such as elevation or chemical concentrations.
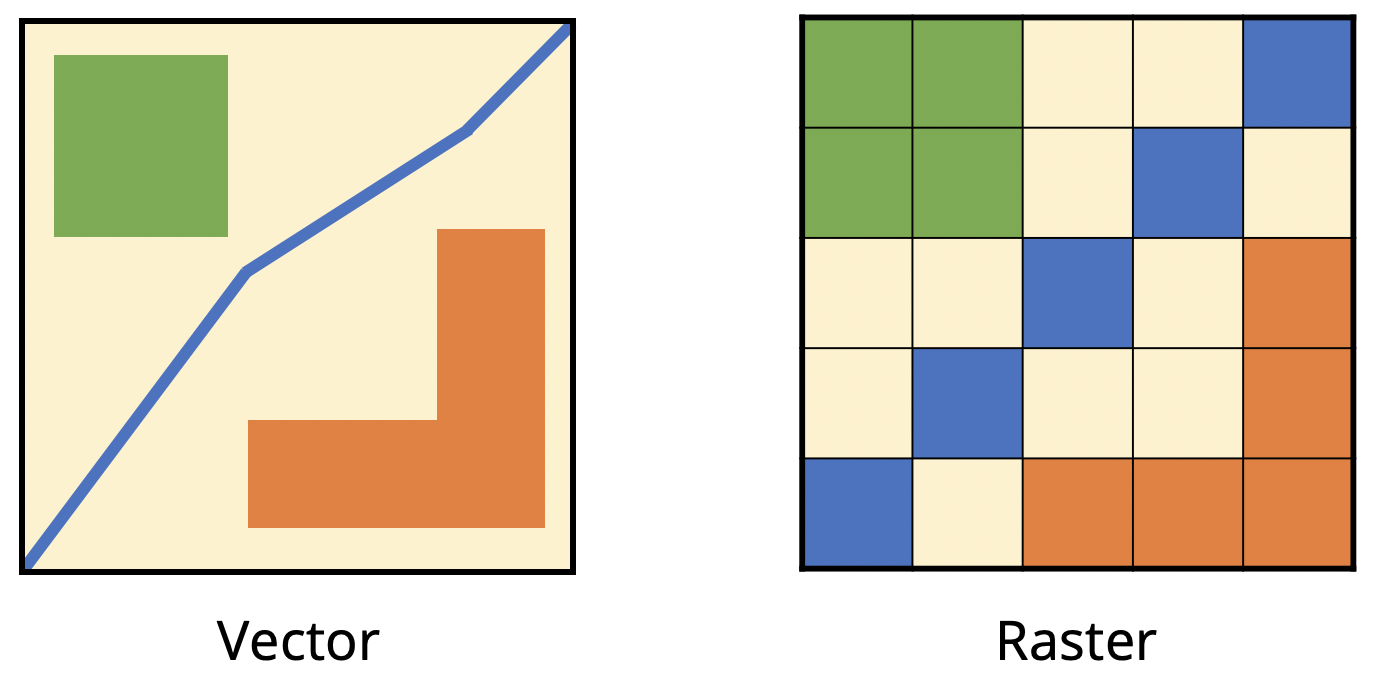
You can see whether layers in a project are vectors or rasters by looking at the symbol next to the layer’s name in the layer list on the left of the QGIS interface. Rasters are symbolised by a checkerboard pattern. Vectors are symbolised depending on their geometry type: polygon (square with solid fill), line or point.
Adding layers: drag and drop method
The quickest and easiest way to add any type of layer to QGIS is by simply dragging the file from its computer folder and dropping it onto the the QGIS interface.
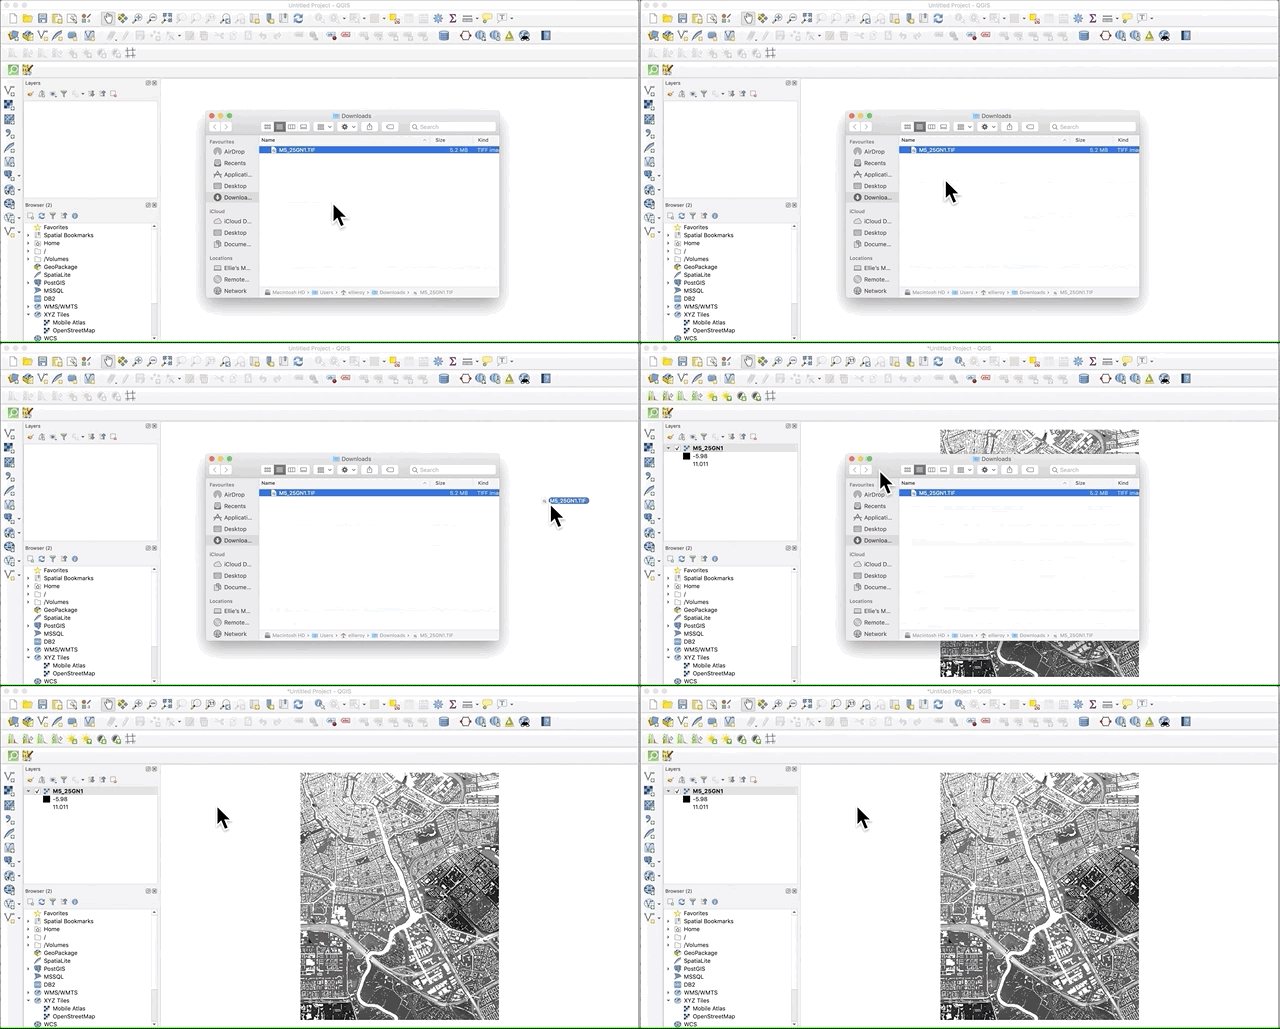
The more “official” methods for adding vector and raster layers are explained in the following sections.
Adding vector layers
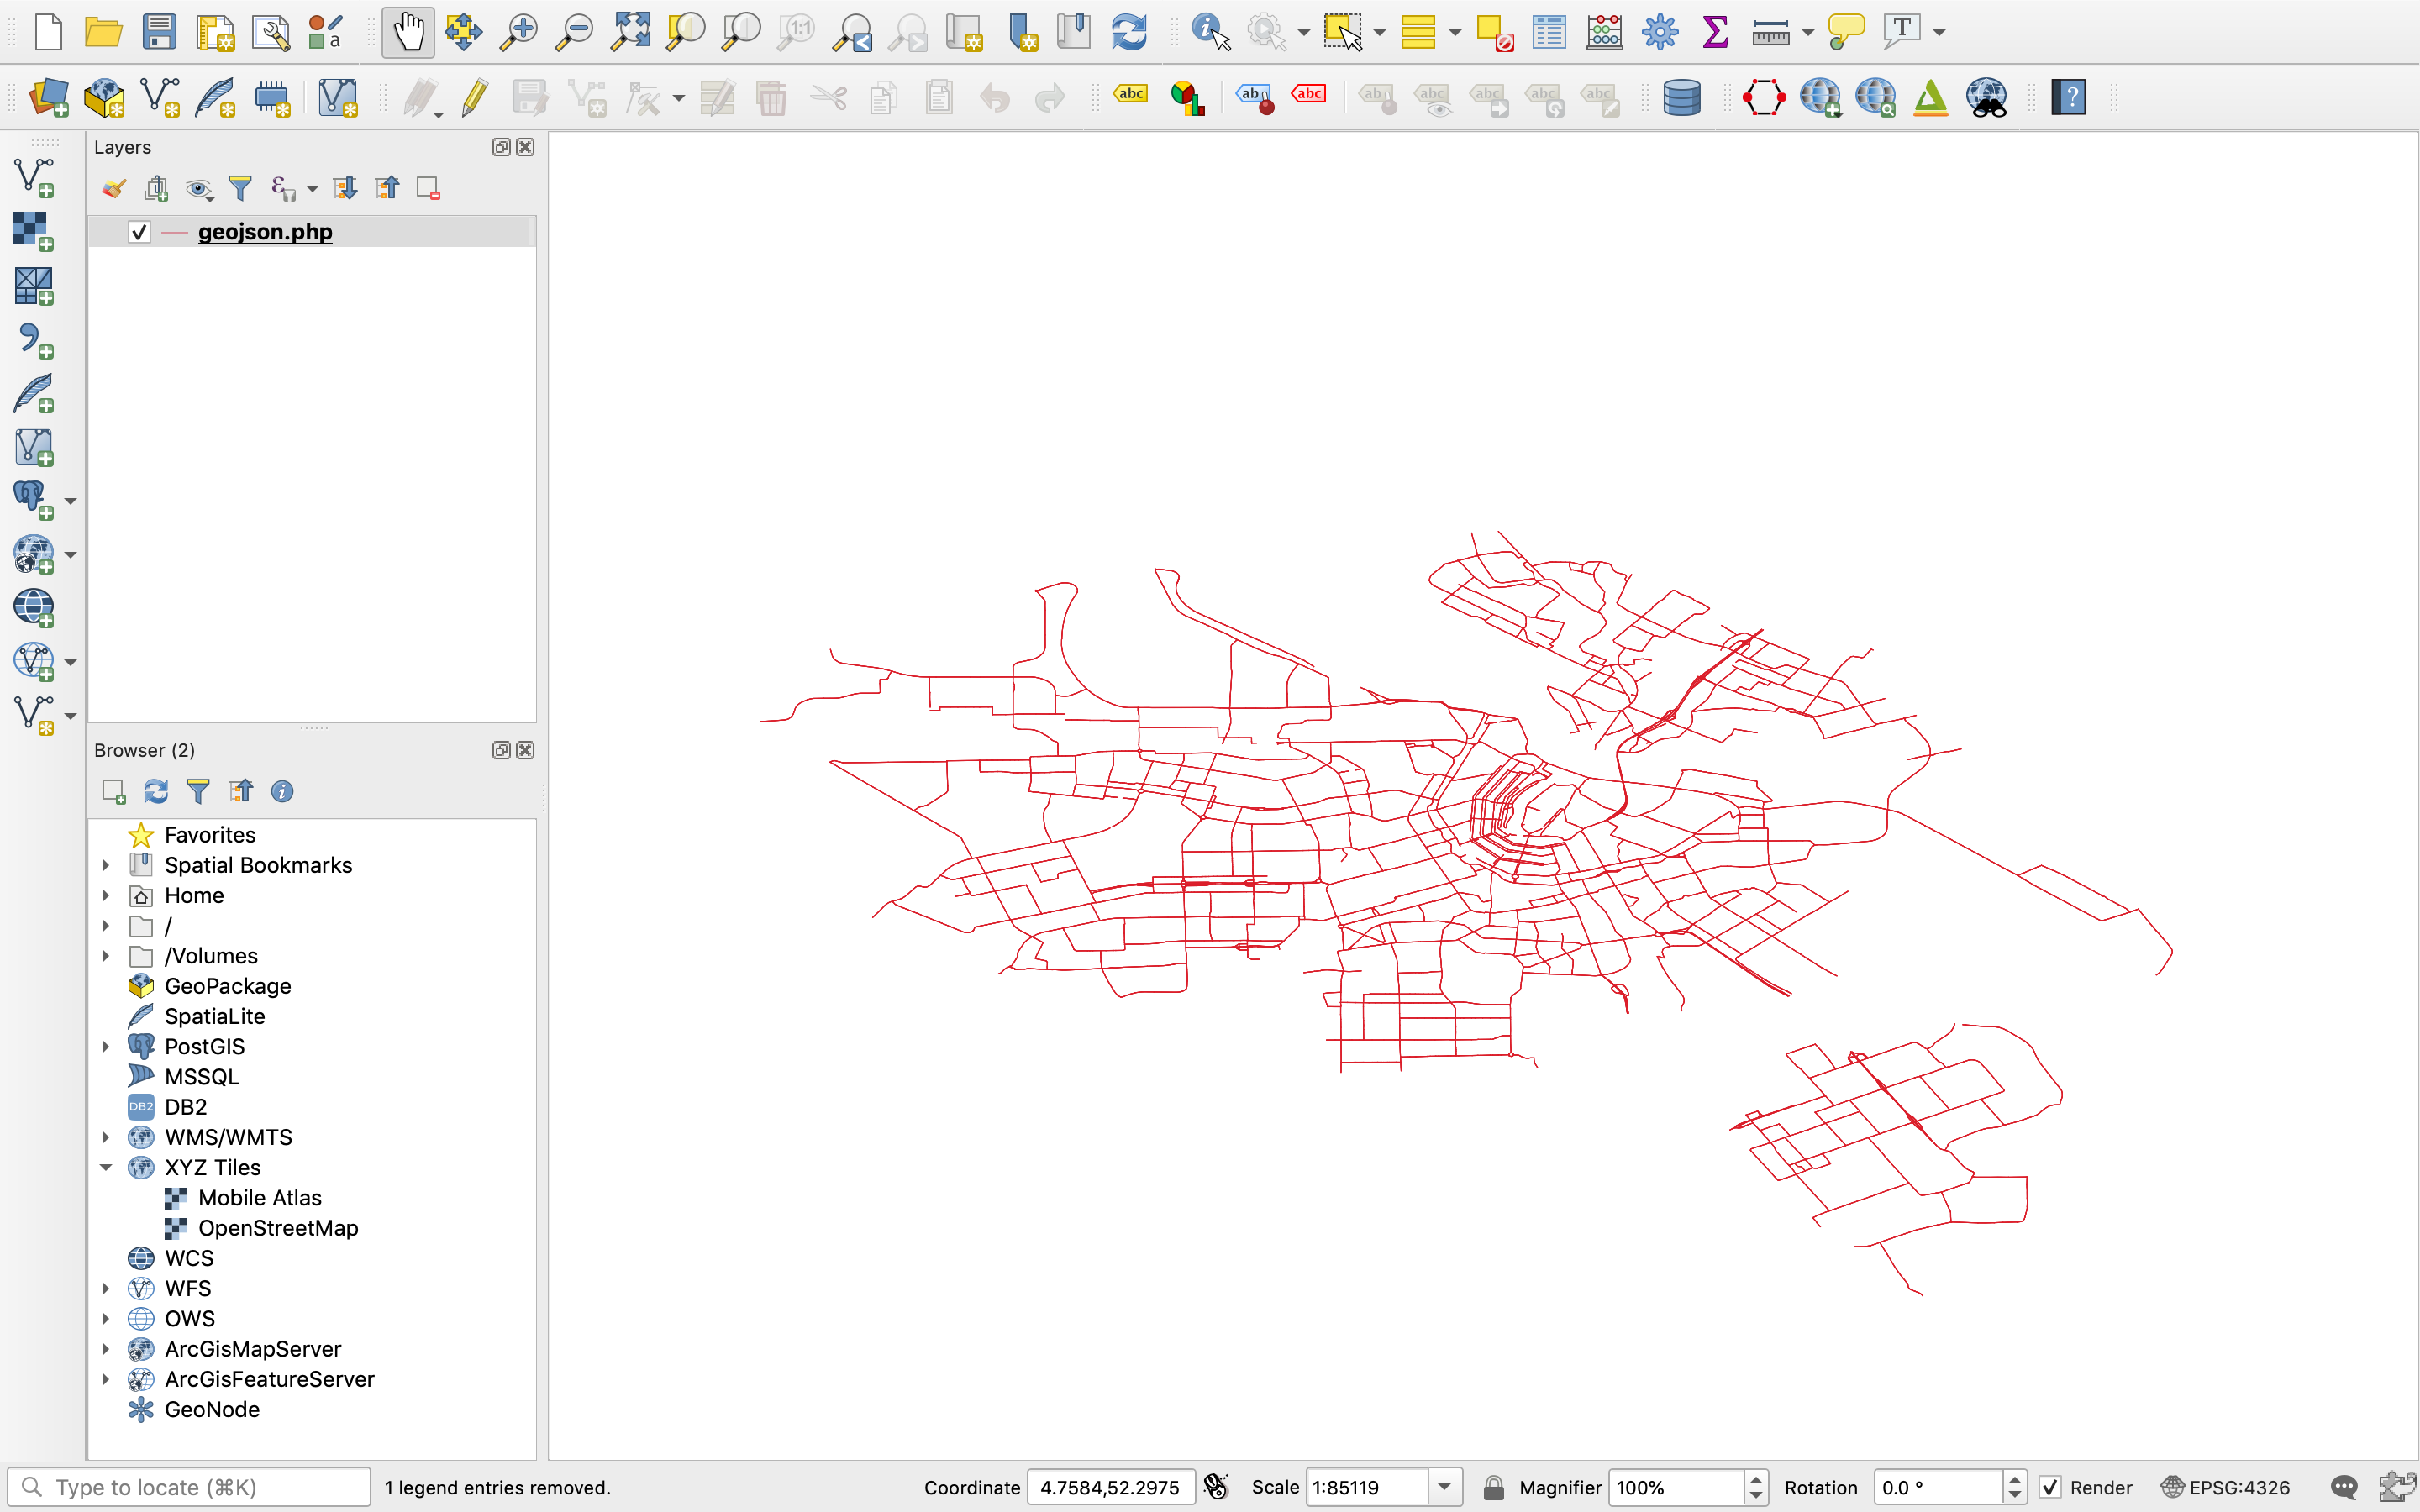
This part of the tutorial will show you how to add a vector layer to your project. The most common file formats for vector data are: GeoJSON, GeoPackage and Esri Shapefile. This example will show how to load a GeoJSON file into QGIS, but the procedure is the same for any other vector file format.
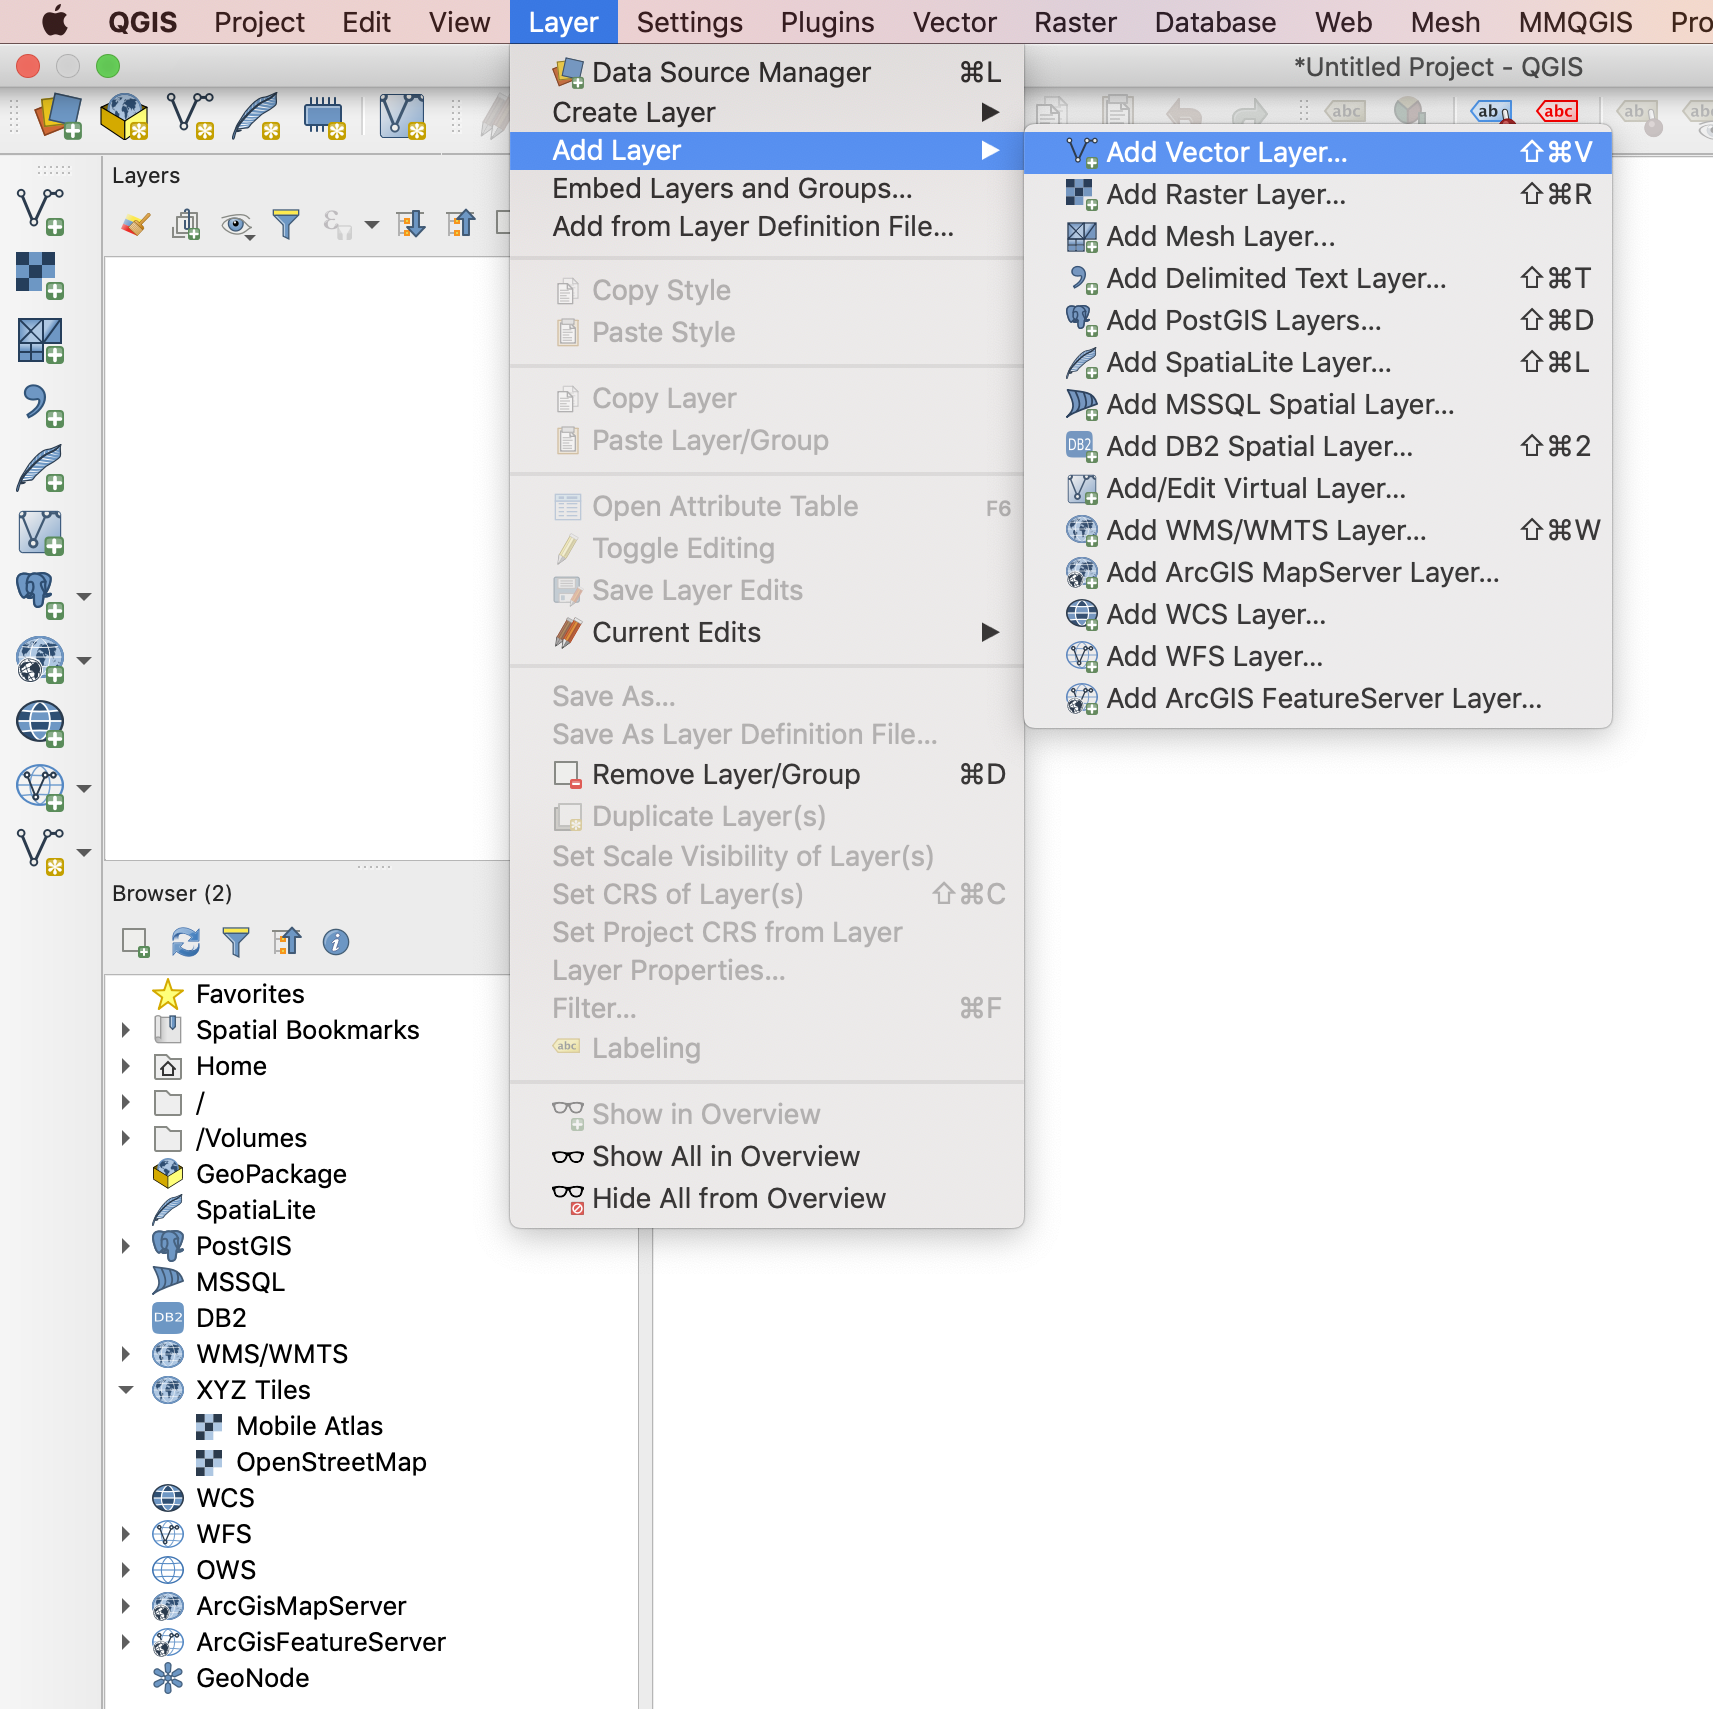
- Step 1: Obtain the data. In this example we will be loading a dataset from the city of Amsterdam into QGIS. If you want to follow along, download the GeoJSON file from the following site
- Step 2: Open QGIS and navigate to Add vector layer….
Alternatively you can click on the “Add vector layer” button in the side toolbar.
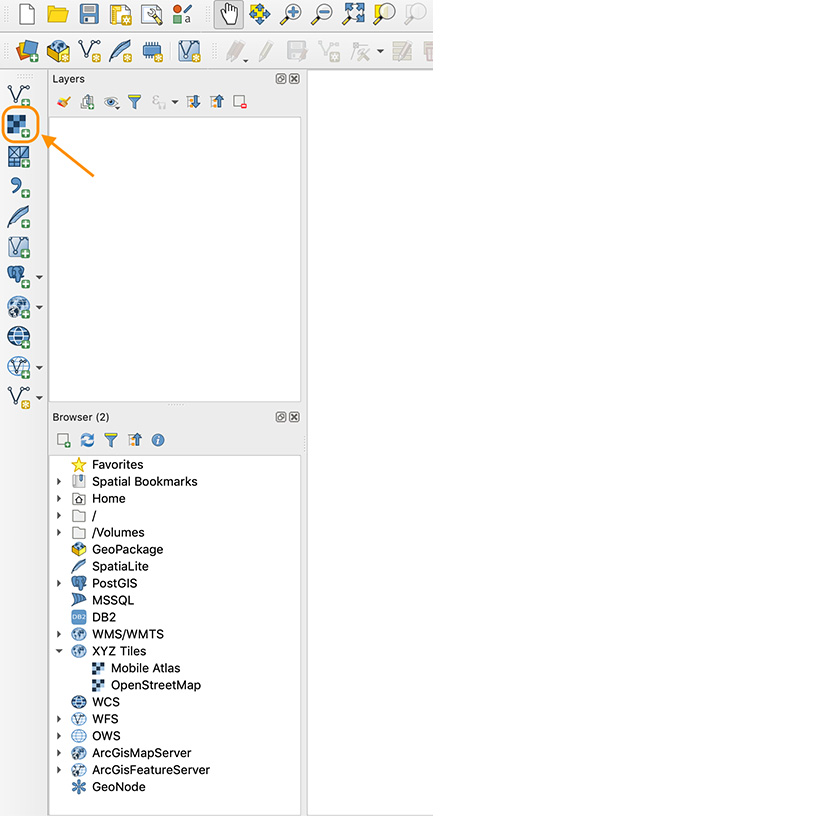
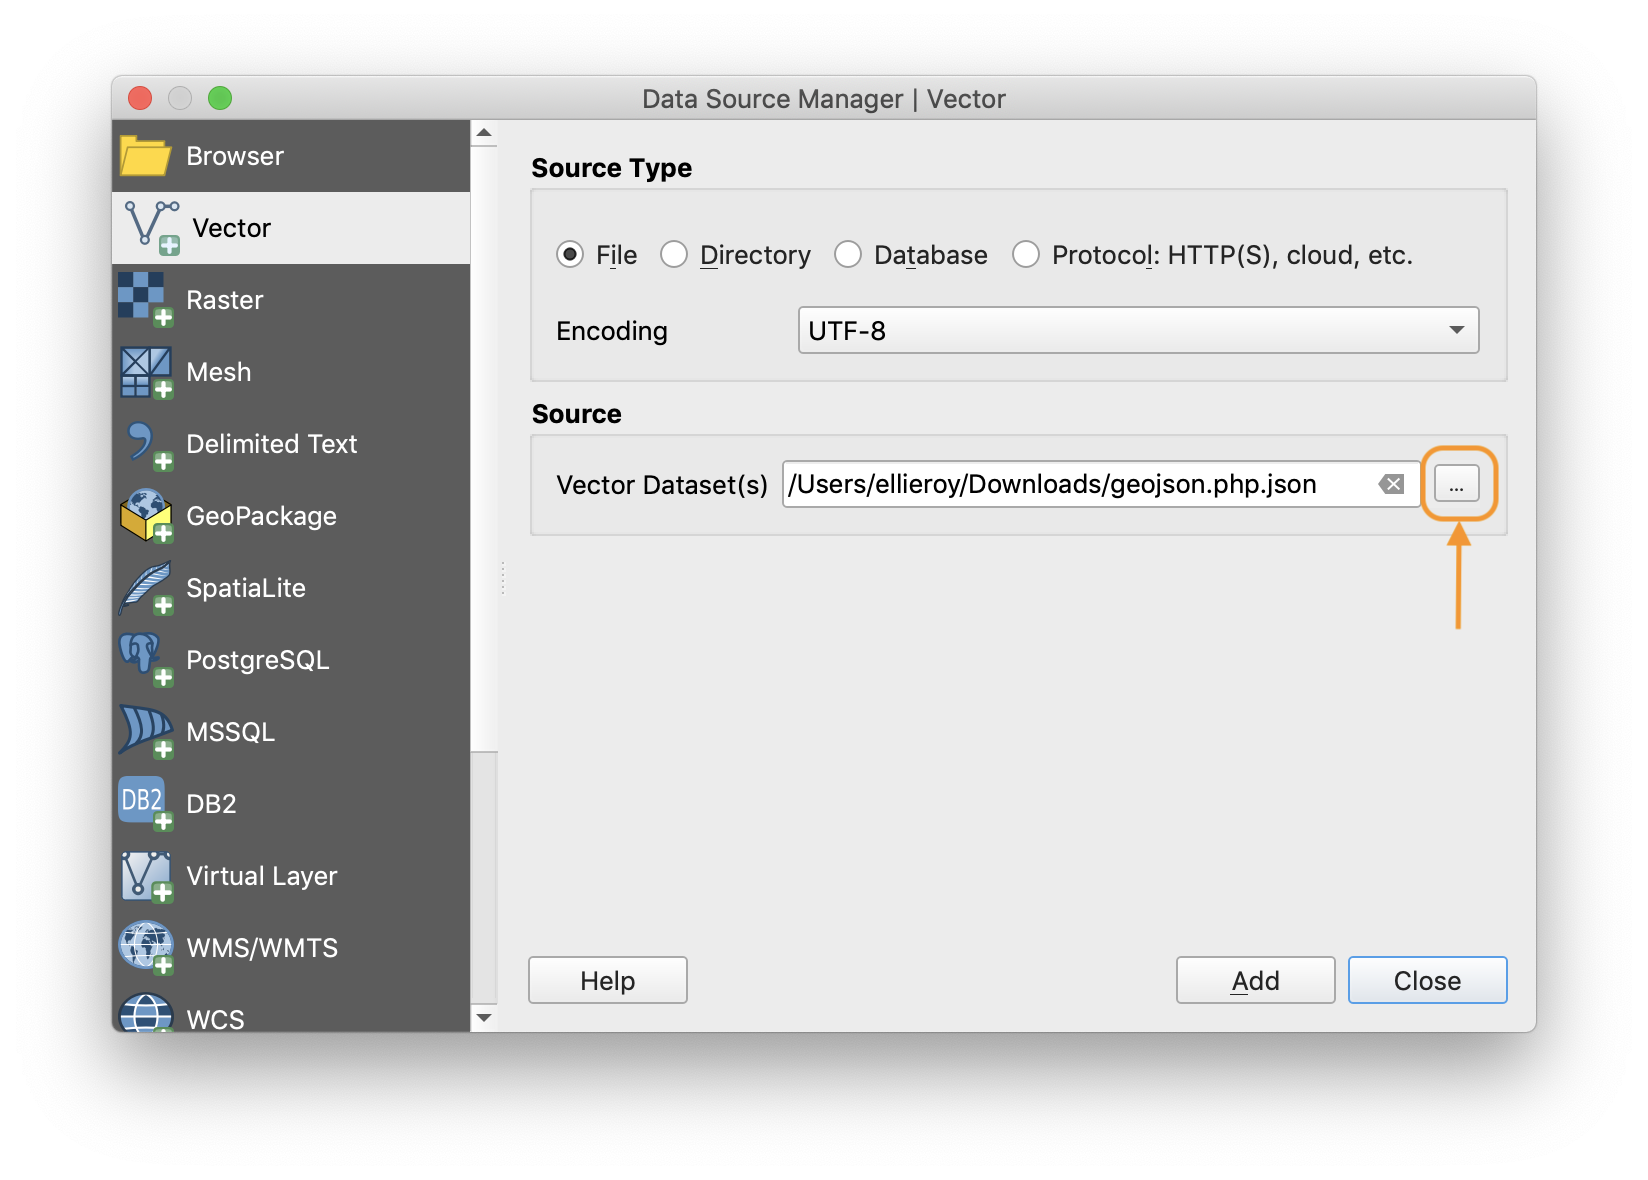
- Step 3: Choose the file path of the data you want to add to the project using the “browse” button.

- Step 4: Click “add” and you will see the layer added to the layers list and the data displayed in the map canvas.
QGIS – Vector Data Layers Creation 2/4
Creating vector datalink copied
As well as simply opening existing data using QGIS, you can also create your own vector data. This tutorial will explain the basic steps of digitising a raster map image, using an example from TU Delft campus. For more information on creating and editing vector data, see the useful links below.
Basic digitising
Step 1: Create a new vector dataset.
- Open QGIS and create a new project.
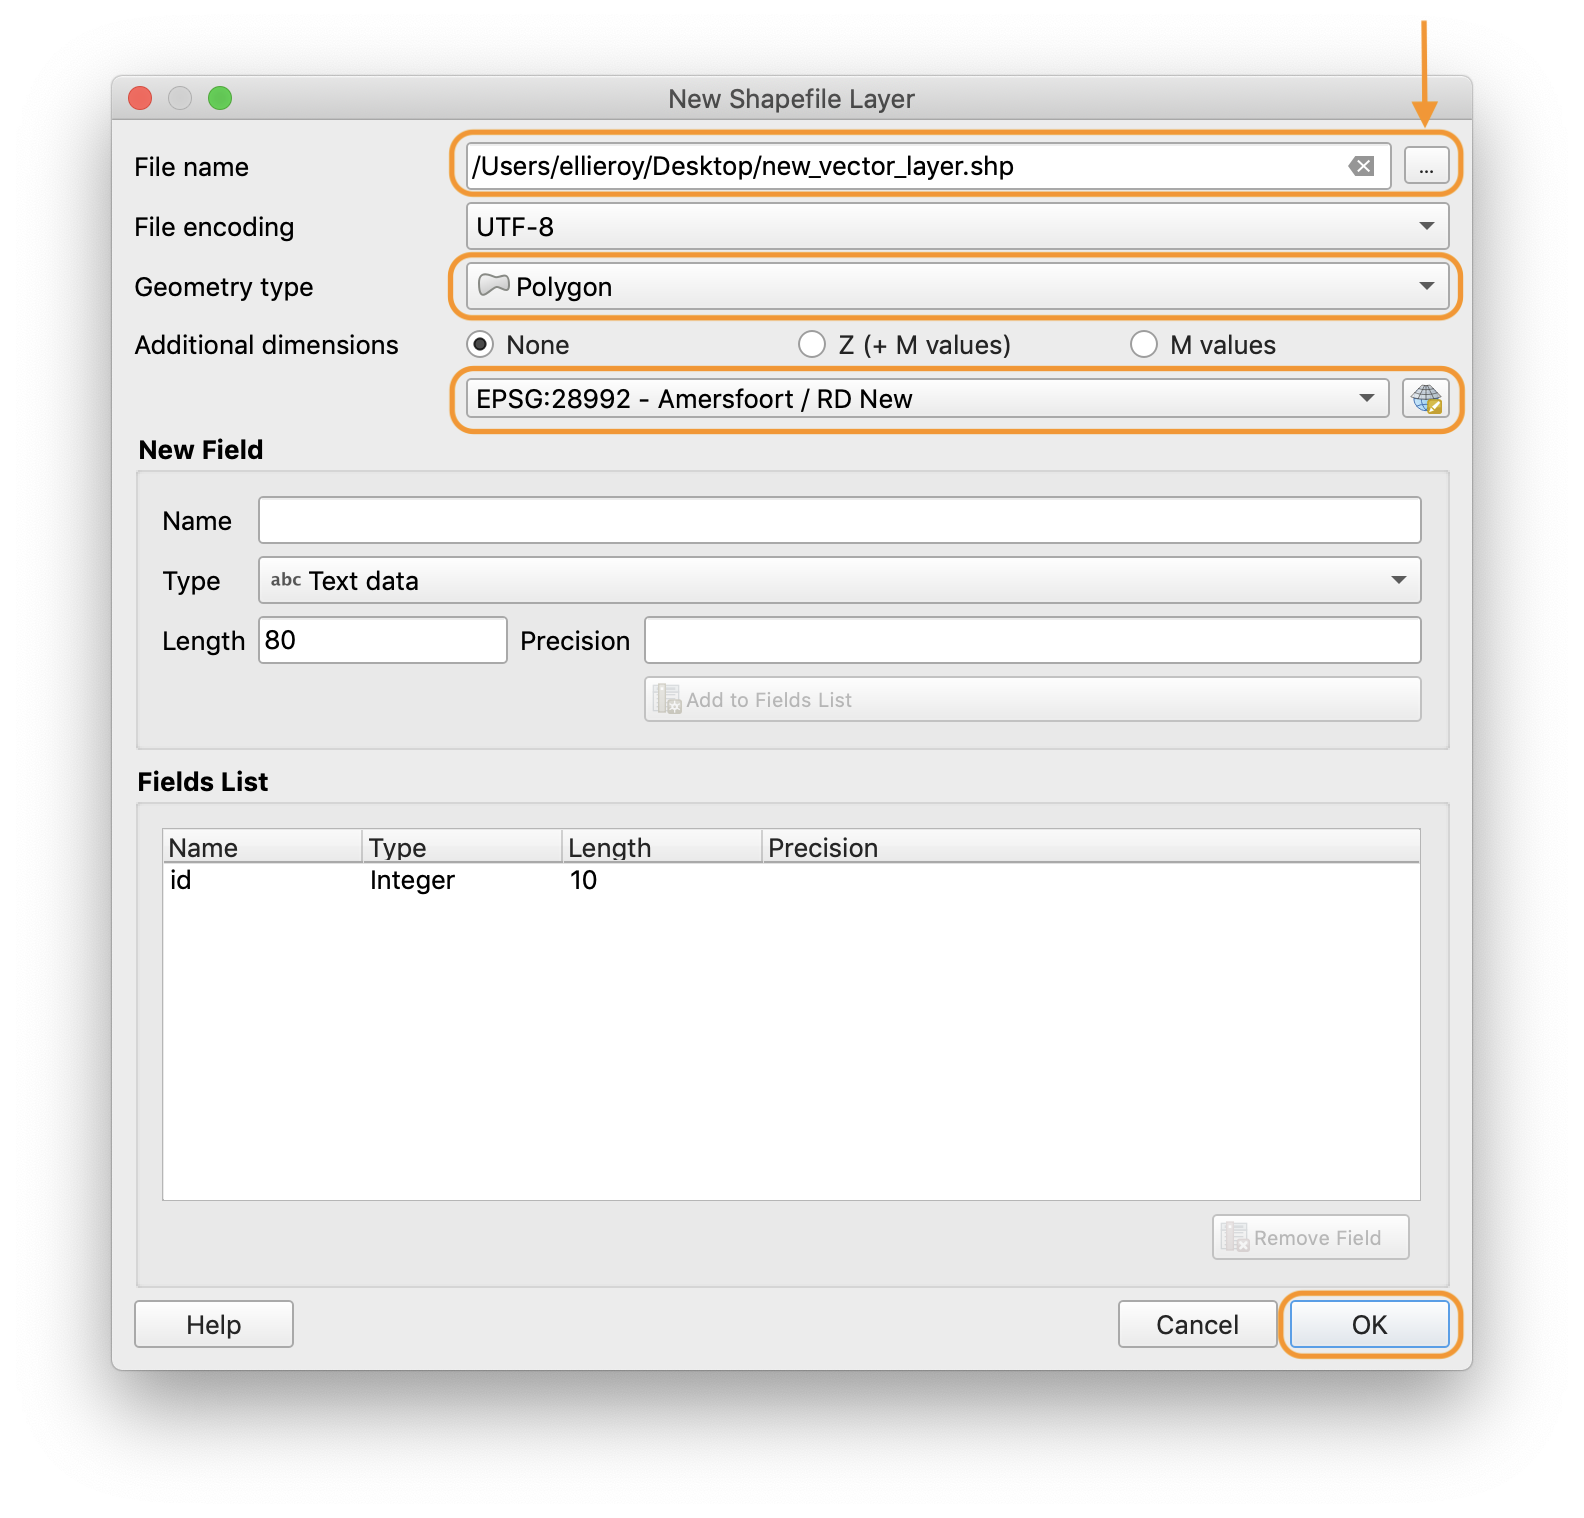
- Navigate to Layer » Create Layer » New Shapefile Layer…
Click the … icon beside the file name field in order to set the file name and path.
- Set the geometry type (polygon / line / point) from the drop-down menu. In this tutorial we will be creating a polygon vector layer.
- Choose the coordinate reference system. In this tutorial we will be using EPSG:28992 – Amersfoort / RD New (the Dutch coordinate system).
- Click “OK”.
Step 2: Add a layer to the project that can be used as a data source.
- In this tutorial we will use an aerial photograph of the Netherlands as a data source.
- The Adding WMS/WFS connections tutorial explains how to access the aerial photograph using QGIS.
Step 3: Navigate to the area that you would like to create a vector dataset for.
- In this example we have navigated to the area around the TU Delft aula and library.

Step 4: Enable toggle editing using the digitizing toolbar.
- Click on your vector layer in the layers list and then click on the yellow pencil icon in the toolbar. This will make the layer editable.
- If you do not see the yellow pencil icon, enable the digitizing toolbar via Digitizing toolbar

Step 5: Draw a polygon on the map canvas.
- Click on the “add polygon feature” icon in the toolbar.
- Click anywhere on the map canvas to start drawing a polygon.
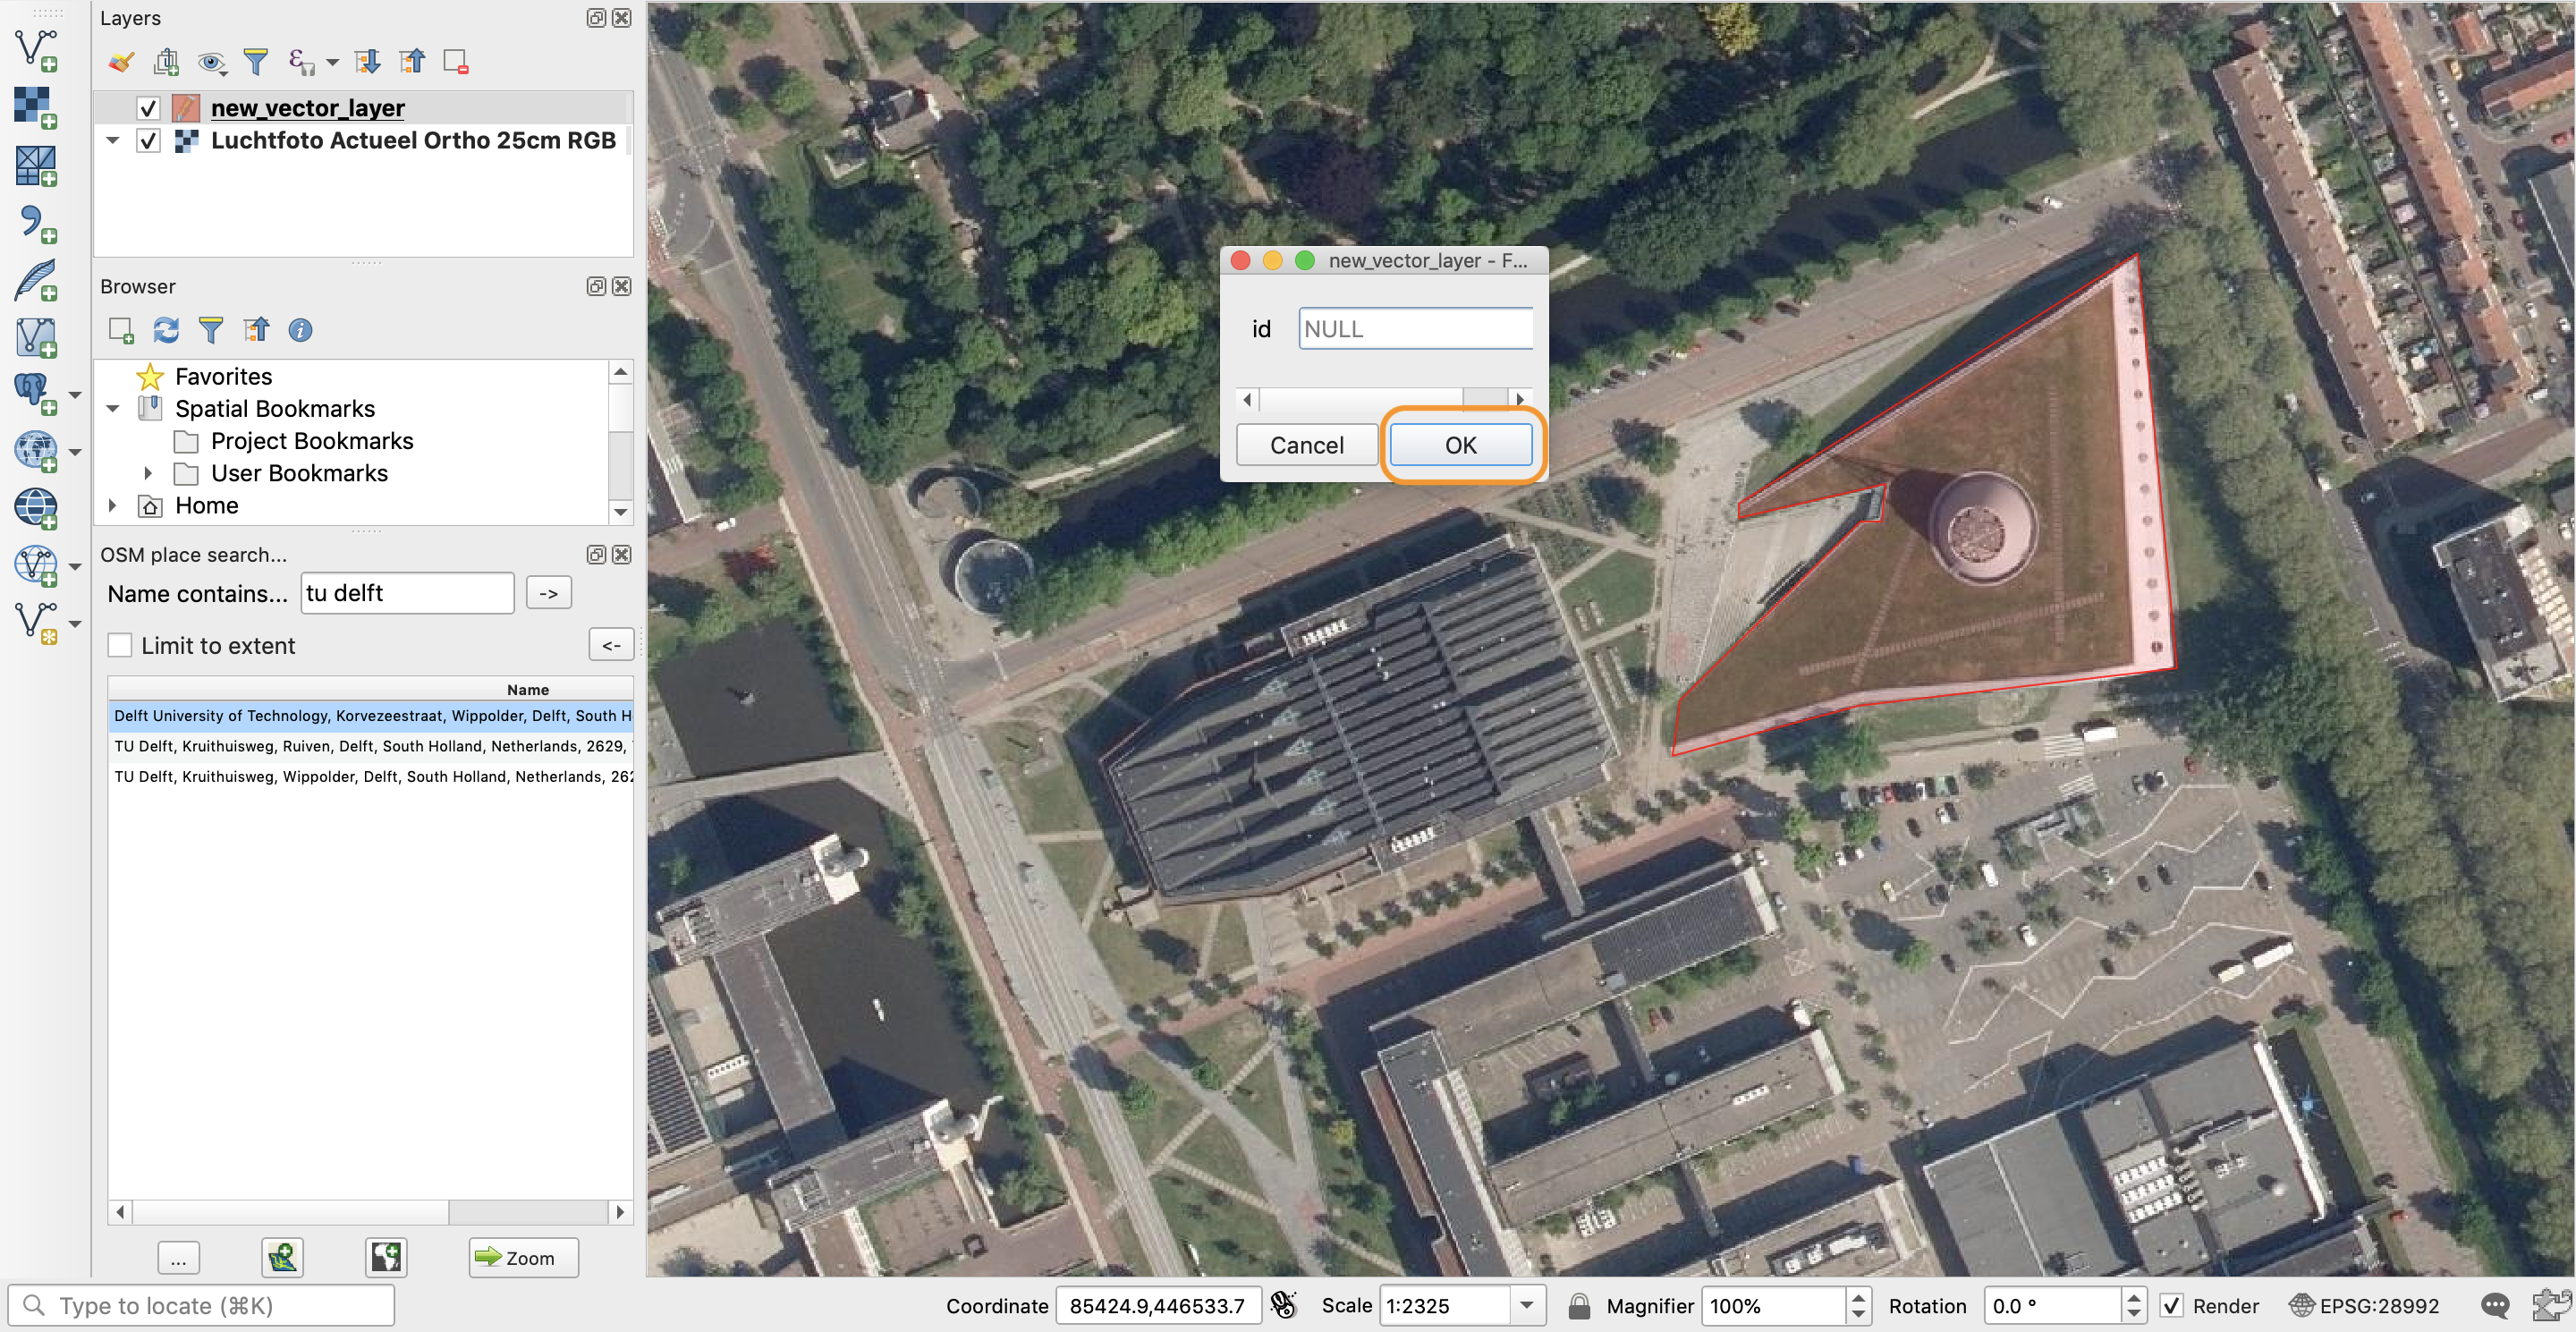
- When you are finished drawing the polygon, right-click and then click “OK” in the window that opens.
- If you make a mistake while drawing, simply press “esc” and you can start again.

Step 6: Save the edits and stop editing.
- Click on the “save layer edits” icon to save the polygon that you have added to the layer.
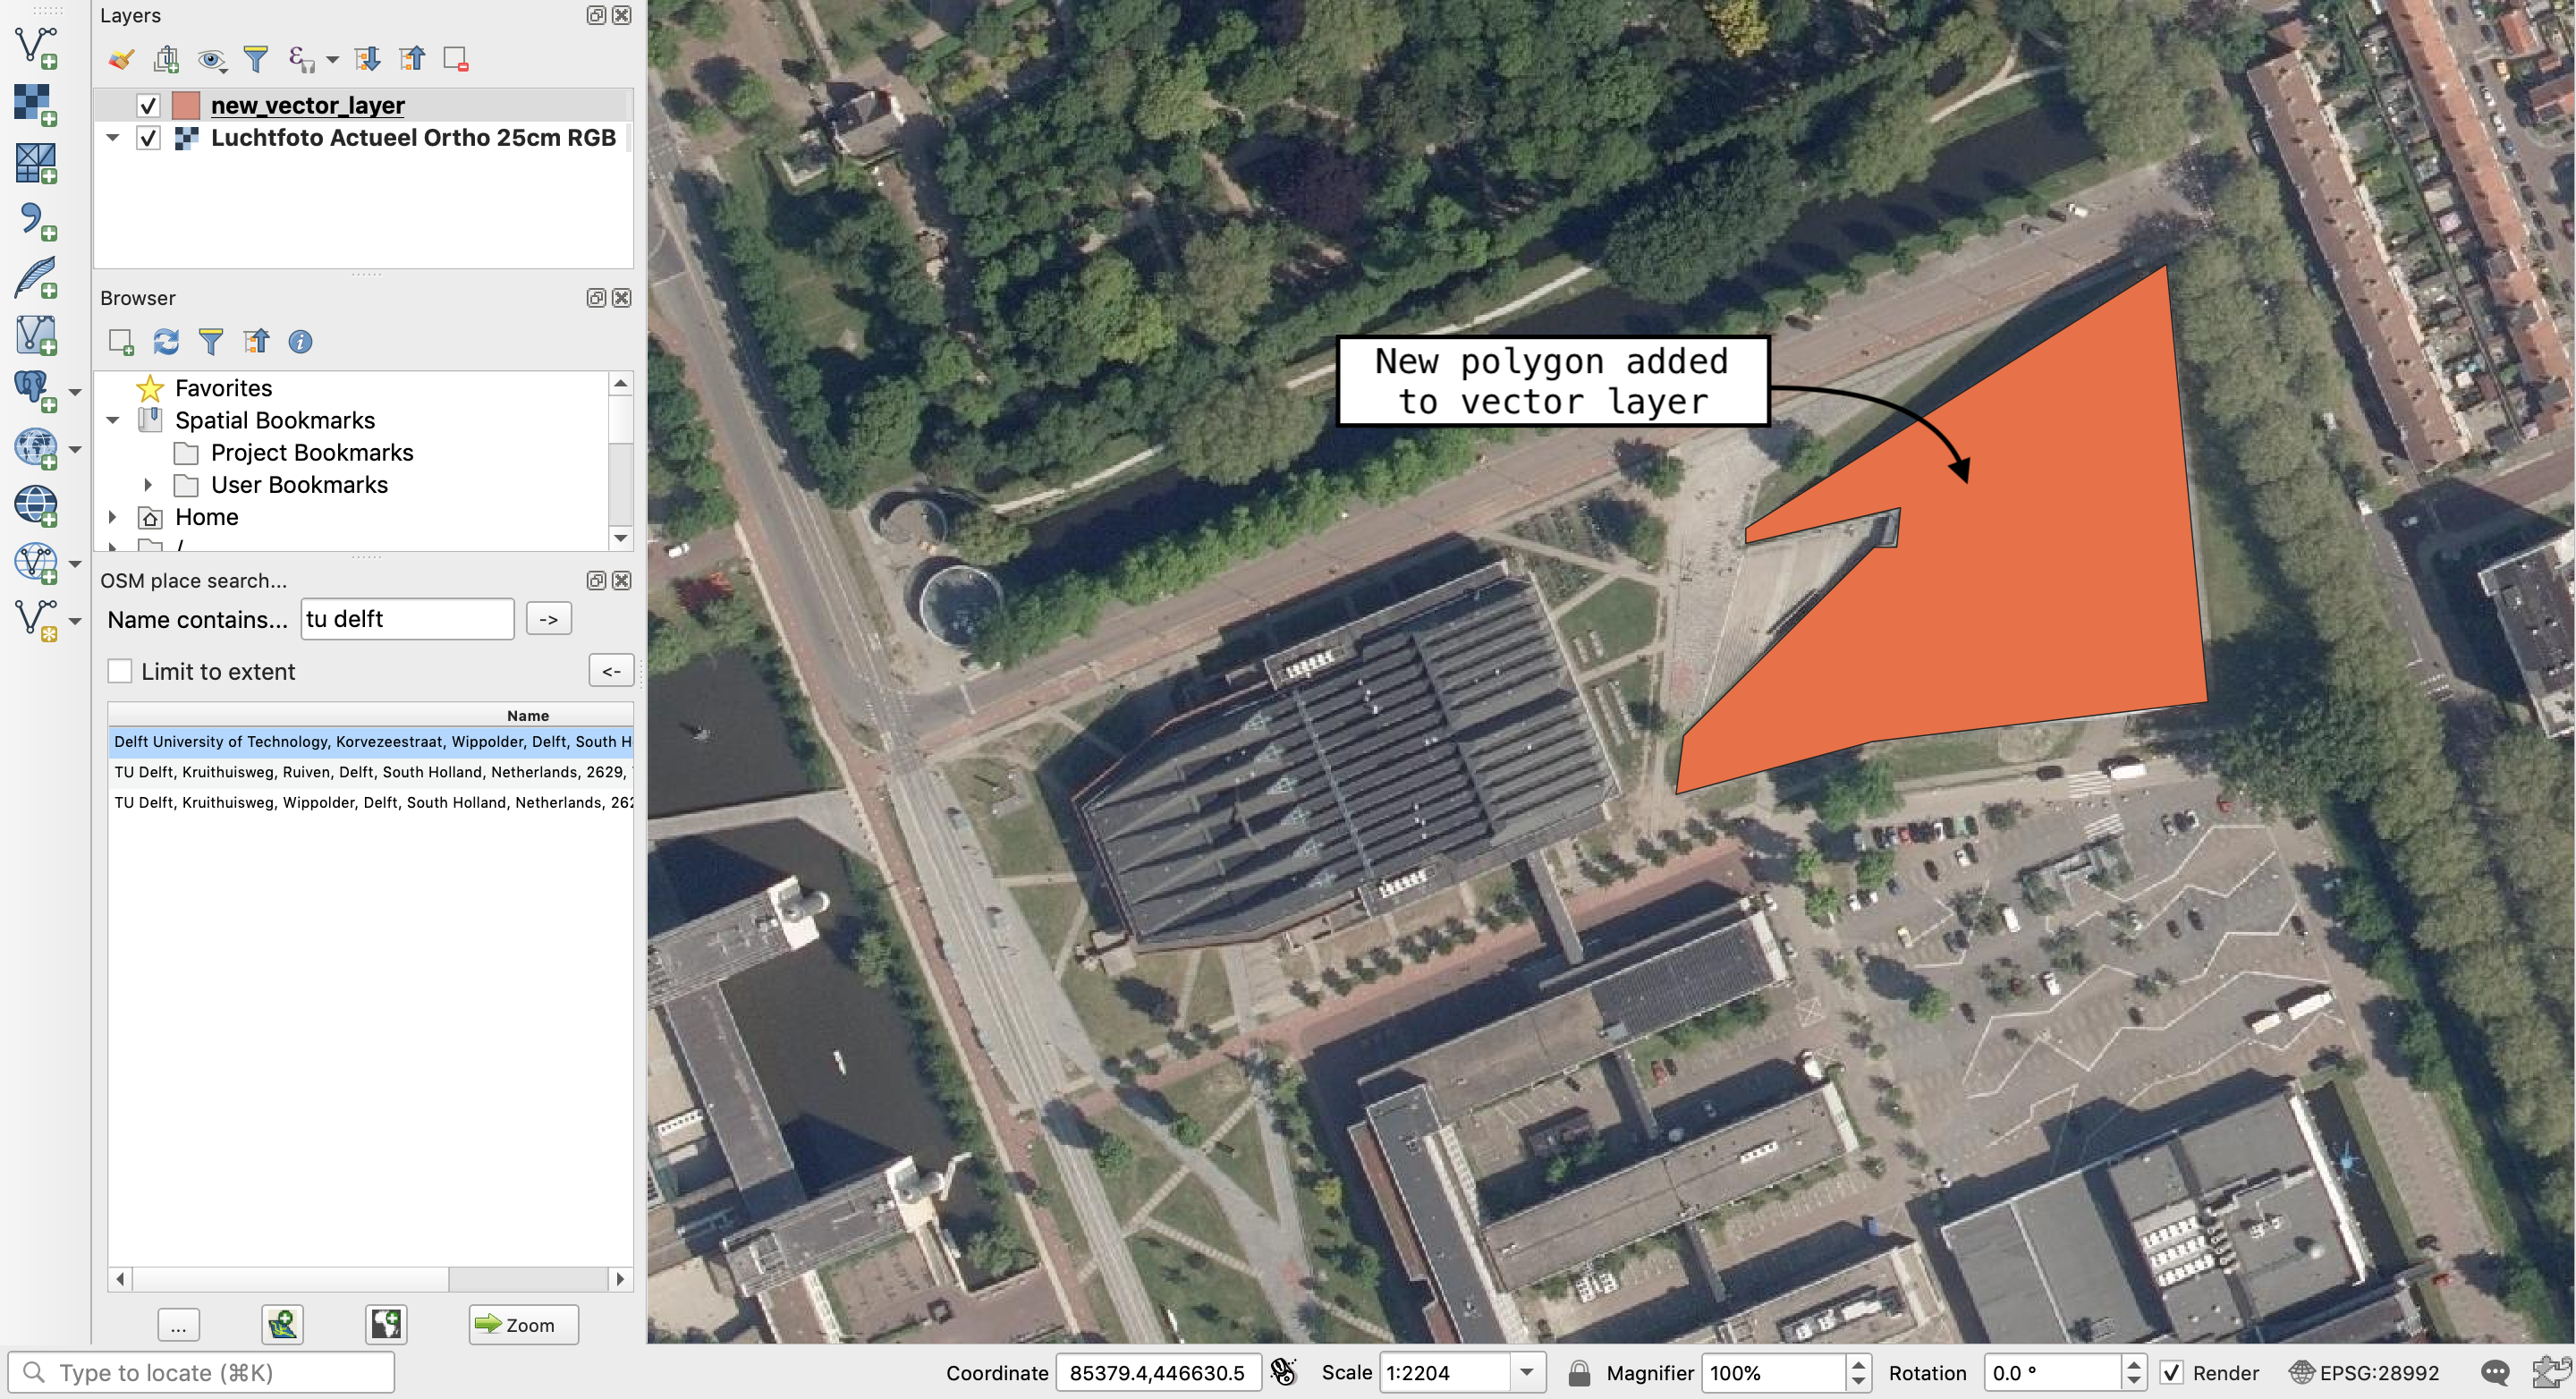
- Click on the yellow pencil icon again to stop editing.
Digitising specific shapes

You can also use the shape digitising toolbar to precisely digitise specific geometrical shapes.
- Open the toolbar via Shape Digitizing Toolbar
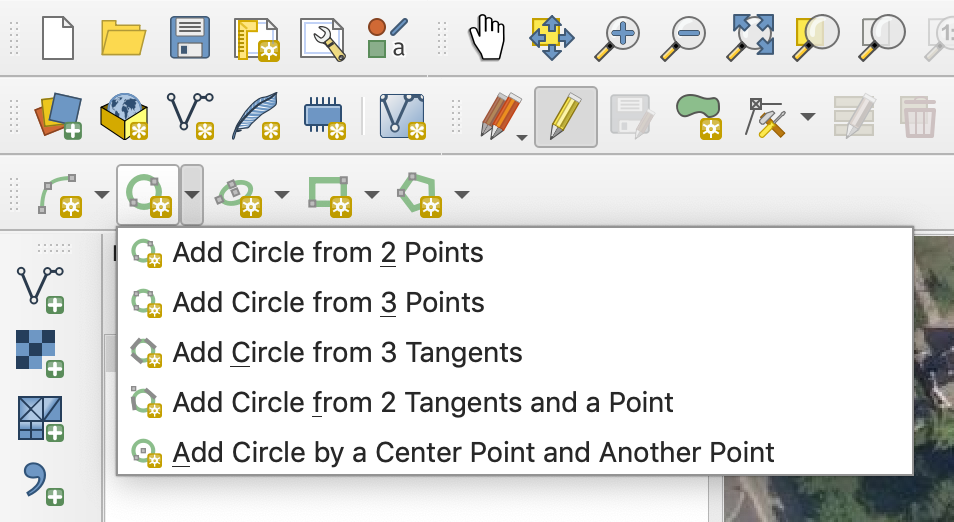
- Follow the same steps as above but draw a polygon using use one of the options from the shape digitising toolbar (instead of using “add polygon feature”).
- For example, you can draw a circle using the 2nd icon from the left.
You can use the drop-down menu beside each icon to see the options for drawing the different shapes.
QGIS – Vector Data Layers Creation 3/4
Adding vectorslink copied
Network analysis
Network analysis can be used to find distances, travel times and shortest paths between two locations.
Define the shortest and fastest path
- QGIS Training manual: “6.3. Network Analysis”
you can access this manual using this link
Language(s): EnglishChapters:
- follow along: the tools and the data
- calculate the shortest path (point to point)
- try yourself fastest path
- follow along: advanced options
- shortest path with speed limit
- service area (from layer)
- in conclusion
- what’s next
Build a road network and define the shortest path between two points in the city of Washington DC
- Ujaval Gandhi: “Basic Network Visualization and Routing (QGIS3)”/”Basis netwerk visualisatie en routeren (QGIS3)”
you can access the English tutorial using this link
you can access the Dutch tutorial using this link
Language(s): English, DutchChapters:
- overview of the task
- get the data
- procedure
Find out the facility with the least travel distance from each address in the city of Washington DC
- Ujaval Gandhi: “Locating Nearest Facility with Origin-Destination Matrix (QGIS3)”/ “Dichtstbijzijnde faciliteit zoeken met Origin-Destination Matrix (QGIS3)”
you can access the English tutorial using this link
you can access the Dutch tutorial using this link
Language(s): English, DutchChapters:
- overview of the task
- get the data
- procedure
Define areas within 15-minutes of walking distance in the metro rail station data for Kochi, India
- Ujaval Gandhi: “Service Area Analysis using Openrouteservice (QGIS3)”/”Analyse Servicegebied met Openrouteservice (QGIS3)”
you can access the English tutorial using this link
you can access the Dutch tutorial using this link
Language(s): English, Dutch
Chapters:- overview of the task
- get the data
- procedure
Determine the travel times to a chosen location in the city of Bangalore, India
- Ujaval Gandhi: “Travel Time Analysis with Uber Movement (QGIS3)”/”Reistijd-analyse met Uber Movement (QGIS3)”
you can access the English tutorial using this link
you can access the Dutch tutorial using this link
Language(s): English, Dutch
Chapters:- overview of the task
- get the data
- procedure
Define the shortest path
- Erik Meerburg (3D geoinformation research group): “Urbanism GIS Course 16: Network analysis”
you can access this video using this link
Language(s): English
Chapters:- introduction (start-1:30)
- geofabric download website (1:30-2:32)
- OpenStreetMap (2:32-5:13)
- network analysis (5:13-9:01)
- open root service (9:01-end)
Line length calculation and statistics
Lines can also be analysed in QGIS. The length can be calculated and some statistics can be performed on them.
Computation of the total length of railroads in the United States
- Ujaval Gandhi: “Calculating Line Lengths and Statistics (QGIS3)”/”Lengten van lijnen en statistieken berekenen (QGIS3)”
you can access the English tutorial using this link
you can access the Dutch tutorial using this link
Language(s): English, Dutch
Chapters:- overview of the task
- get the data
- procedure
Nearest neighbor analysis
The nearest neighbour analysis allows to determine the features that are the closest to a given feature.
Determine the nearest populated place for each location where an earthquake happened
- Ujaval Gandhi: “Nearest Neighbor Analysis (QGIS3)”/”Analyse Nearest Neighbor (QGIS3)”
you can access the English tutorial using this link
you can access the Dutch tutorial using this link
Language(s): English, Dutch
Chapters:- overview of the task
- get the data
- procedure
Use QGIS spatial statistics within the Processing Toolbox
- QGIS Training manual: “6.4. Spatial Statistics”
you can access this manual using this link
Language(s): English
Chapters:- follow along: create a test dataset
- creating random points
- sampling the data
- follow along: basic statistics
- follow along: compute statistics on distances between points
- follow along: nearest neighbour analysis (within layer)
- follow along: mean coordinates
- follow along: image histograms
- follow along: spatial interpolation
- try yourself different interpolation methods
- in conclusion
- what’s next
Area calculation
The area of a surface can be calculated.
Calculate surface area of polygons
- Hans van der Kwast: “Calculate Areas of Polygons in QGIS”
you can access this video using this link
Language(s): English
Time: 1min 32s
Compute area
- Erik Meerburg (Geogoeroe): “Oppervlakken berekenen”
you can access this video using this link
Language(s): Dutch
Time: 13min 25s
Compute total usable area of each building
- Erik Meerburg (Geogoeroe): “BAG: totaal gebruiksoppervlak per pand berekenen”
you can access this video using this link
Language(s): Dutch
Time: 10min 15s
Class percentages
The percentage of features per class can be determined within polygons.
Derive percentage of land use within polygons from CORINE 2018
- Hans van der Kwast: “Calculate percentage of land use per subcatchment in QGIS 3”
you can access this video using this link
Language(s): English
Time: 17min 38s
Chapters:- introduction (start-1:20)
- style (1:20-2:15)
- catchment polygons (2:15-3:00)
- unique numbers (3:00-3:40)
- catchment area (3:40-4:30)
- more steps (4:30-5:15)
- exporting (5:15-6:35)
- expression (7:10-9:25)
- dissolve (9:25-11:50)
- intersect (11:50-12:40)
- fix geometry error (12:40-14:00)
- fix intersection error (14:00-end)
Derive percentage of land use using the field calculator
- Hans van der Kwast: “Calculate Percentage Land Cover per Subcatchment in QGIS”
you can access this video using this link
Language(s): English
Time: 3min
Chapters: -
- introduction (start-0:20)
- calculate percentage (0:20-1:30)
- add class names (1:30-end)
Street intersection density computations
Street intersection density computations refer to determining the number of streets per area.
Calculate the street intersection density for the city of Chennai in India
Analysis tools from the processing toolbox
The processing toolbox can also be used to perform spatial statistics. Basic statistics (e.g. mean, sum, median calculation) can be done, but also more advanced ones (e.g. nearest neighbour analysis).
Use QGIS spatial statistics within the Processing Toolbox
- QGIS Training manual: “6.4. Spatial Statistics”
you can access this manual using this link
Language(s): English
Chapters: -
- follow along: create a test dataset
- follow along: basic statistics
- follow along: compute statistics on distances between points
- follow along: nearest neighbour analysis (within layer)
- follow along: mean coordinates
- follow along: image histograms
- follow along: spatial interpolation
- try yourself different interpolation methods
- in conclusion
- what’s next
Height analysis
The height of walls can be analysed by using a vector file with lines and Actueel Hoogtebestand Nederland (AHN) data, which contains the elevation data of the Netherlands.
Height analysis based on lines and AHN data in Amsterdam
- Erik Meerburg (Geogoeroe): “Hoogte analyse kademuren in QGIS”
you can access this video using this link
Language(s): Dutch
Time: 24min 53s
Population density analysis
The population density can be computed and analysed.
Population density analysis
- Erik Meerburg (Geogoeroe): “Is de Voorhof de dichtstbevolkte buurt van Nederland?”
you can access this video using this link
Language(s): Dutch
Time: 3min 37s
QGIS – Vector Data Layers Creation 4/4
Useful linkslink copied
- QGIS Training Manual
- QGIS User Guide
- Ujaval Gandhi (QGIS Tutorials and Tips website)
- Hans van der Kwast YouTube channel
- Erik Meerburg (3D geoinformation research group) YouTube channel
- Erik Meerburg (Geogoeroe) YouTube channel
- Module on creating vector data
- More on GIS file formats
- QGIS tutorial on adding layers
- Adding a legend
- making valid geometries
Linked tutorials
Vector vs. Raster data
Follow-up tutorial
Write your feedback.
Write your feedback on "QGIS – Vector Data Layers Creation"".
If you're providing a specific feedback to a part of the chapter, mention which part (text, image, or video) that you have specific feedback for."Thank your for your feedback.
Your feedback has been submitted successfully and is now awaiting review. We appreciate your input and will ensure it aligns with our guidelines before it’s published.
