Transforming Building Plans into Graph Structures
-
Intro
-
Basic Ideas
-
Transforming the plans manually
-
Transforming the plans with Rhino and Grasshopper
-
Transforming the plans with Artificial Intelligence
-
Conclusion
Information
| Primary software used | Rhino |
| Course | Transforming Building Plans into Graph Structures |
| Primary subject | Analysis & simulation |
| Secondary subject | Network Analysis |
| Level | Beginner |
| Last updated | March 25, 2025 |
| Keywords |
Transforming Building Plans into Graph Structures 0/5
Transforming Building Plans into Graph Structures
With this tutorial you will learn how to transform a graph into a vectorized graph structure. This tutorial is based on a reader for the course AR0108 Mastermind available here.
Nourian, P., & Bai, N. (2021). Reuse: On Evaluating the Fitness of Spatial Configurations Before & After Retrofitting for Reuse of Architectural Heritage. In A. Pereira Roders (Ed.), Mastermind CRASH: A method to reveal the impact of architectural redesign (pp. 23-72). TU Delft OPEN Publishing.
Transforming Building Plans into Graph Structures 1/5
Basic Ideaslink copied
We will first come into the basic concepts behind the idea of transforming building plans into graphs
Spatial Configuration
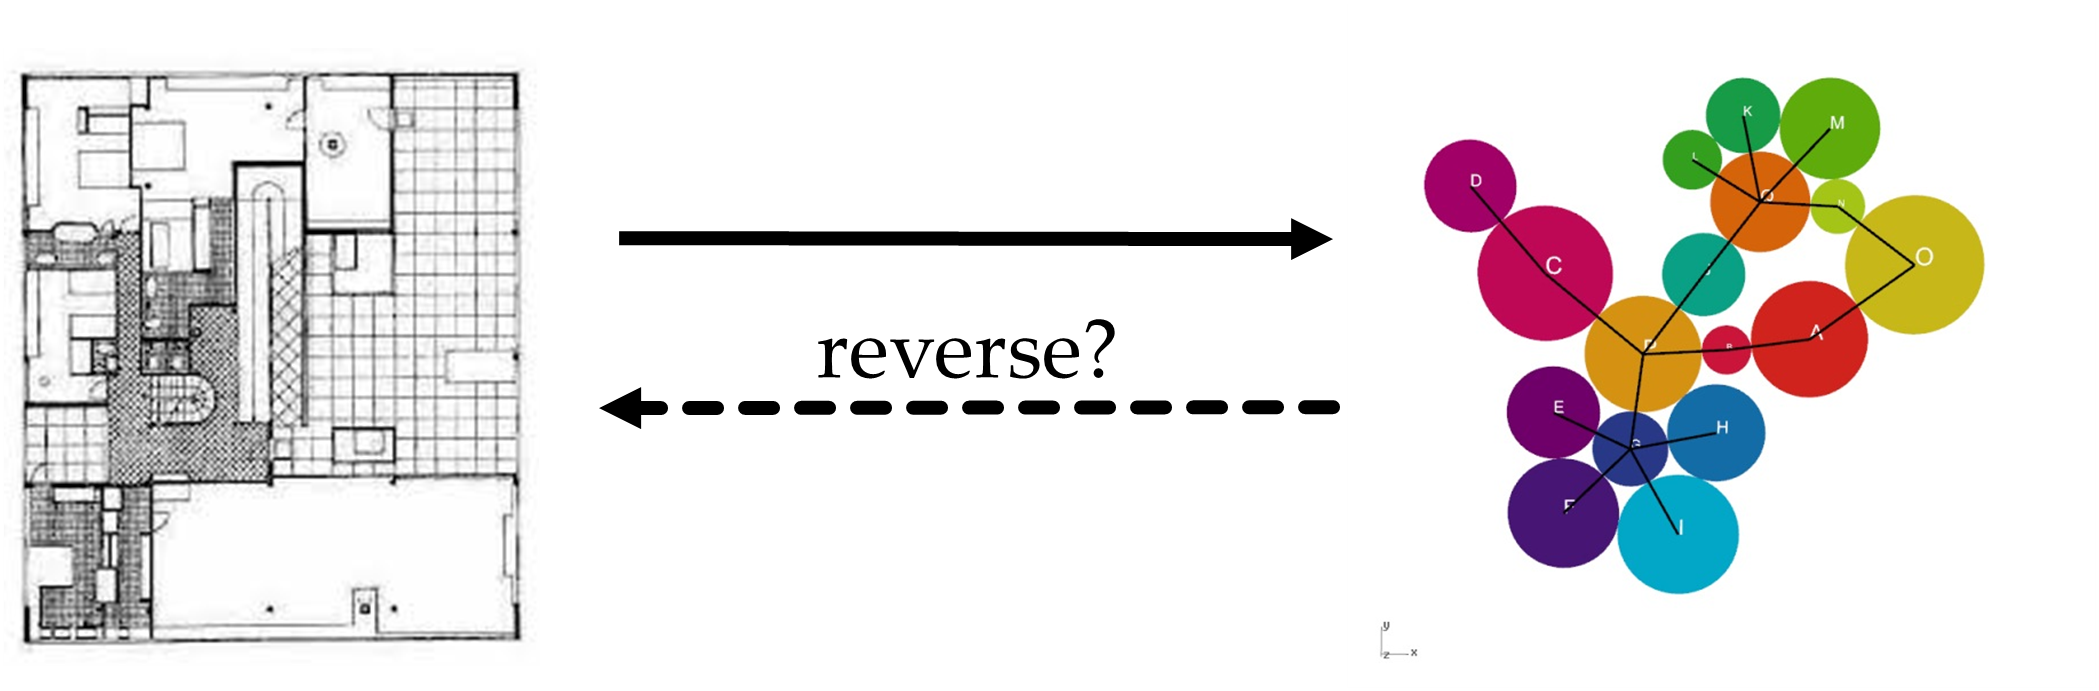
Spatial Configuration is the particular way in which spaces are linked to each other in a building or a built environment. Technically speaking, using the concepts from Graph Theory and Social Network Analysis, the way things are related to each other can be modelled as a graph of nodes/vertices and links/edges. Therefore, space can also be seen as a set of labelled objects (nodes/vertices) connected to each other with links/edges. Such an abstraction of space to graph/network is shown below. You may be quite familiar with the form, as it highly resembles bubble diagrams that you may have encountered in your early years in architecture. Interestingly, the nature of bubble diagrams and networks such as metro networks can be described in matrices.
Bubble Diagram and Graphs
For many architecture students, bubble diagrams are the beginning step for the architecture design projects in early years. They provide a structural understanding of the functional requirements of a building: an entrance needs to be connected with a corridor before entering the living room, the canteen needs to be close to the kitchen, etc. This was important for us as novice architecture students to know if our design fulfils the basic needs and provided us ideas on how to arrange architectural floor plans rationally.
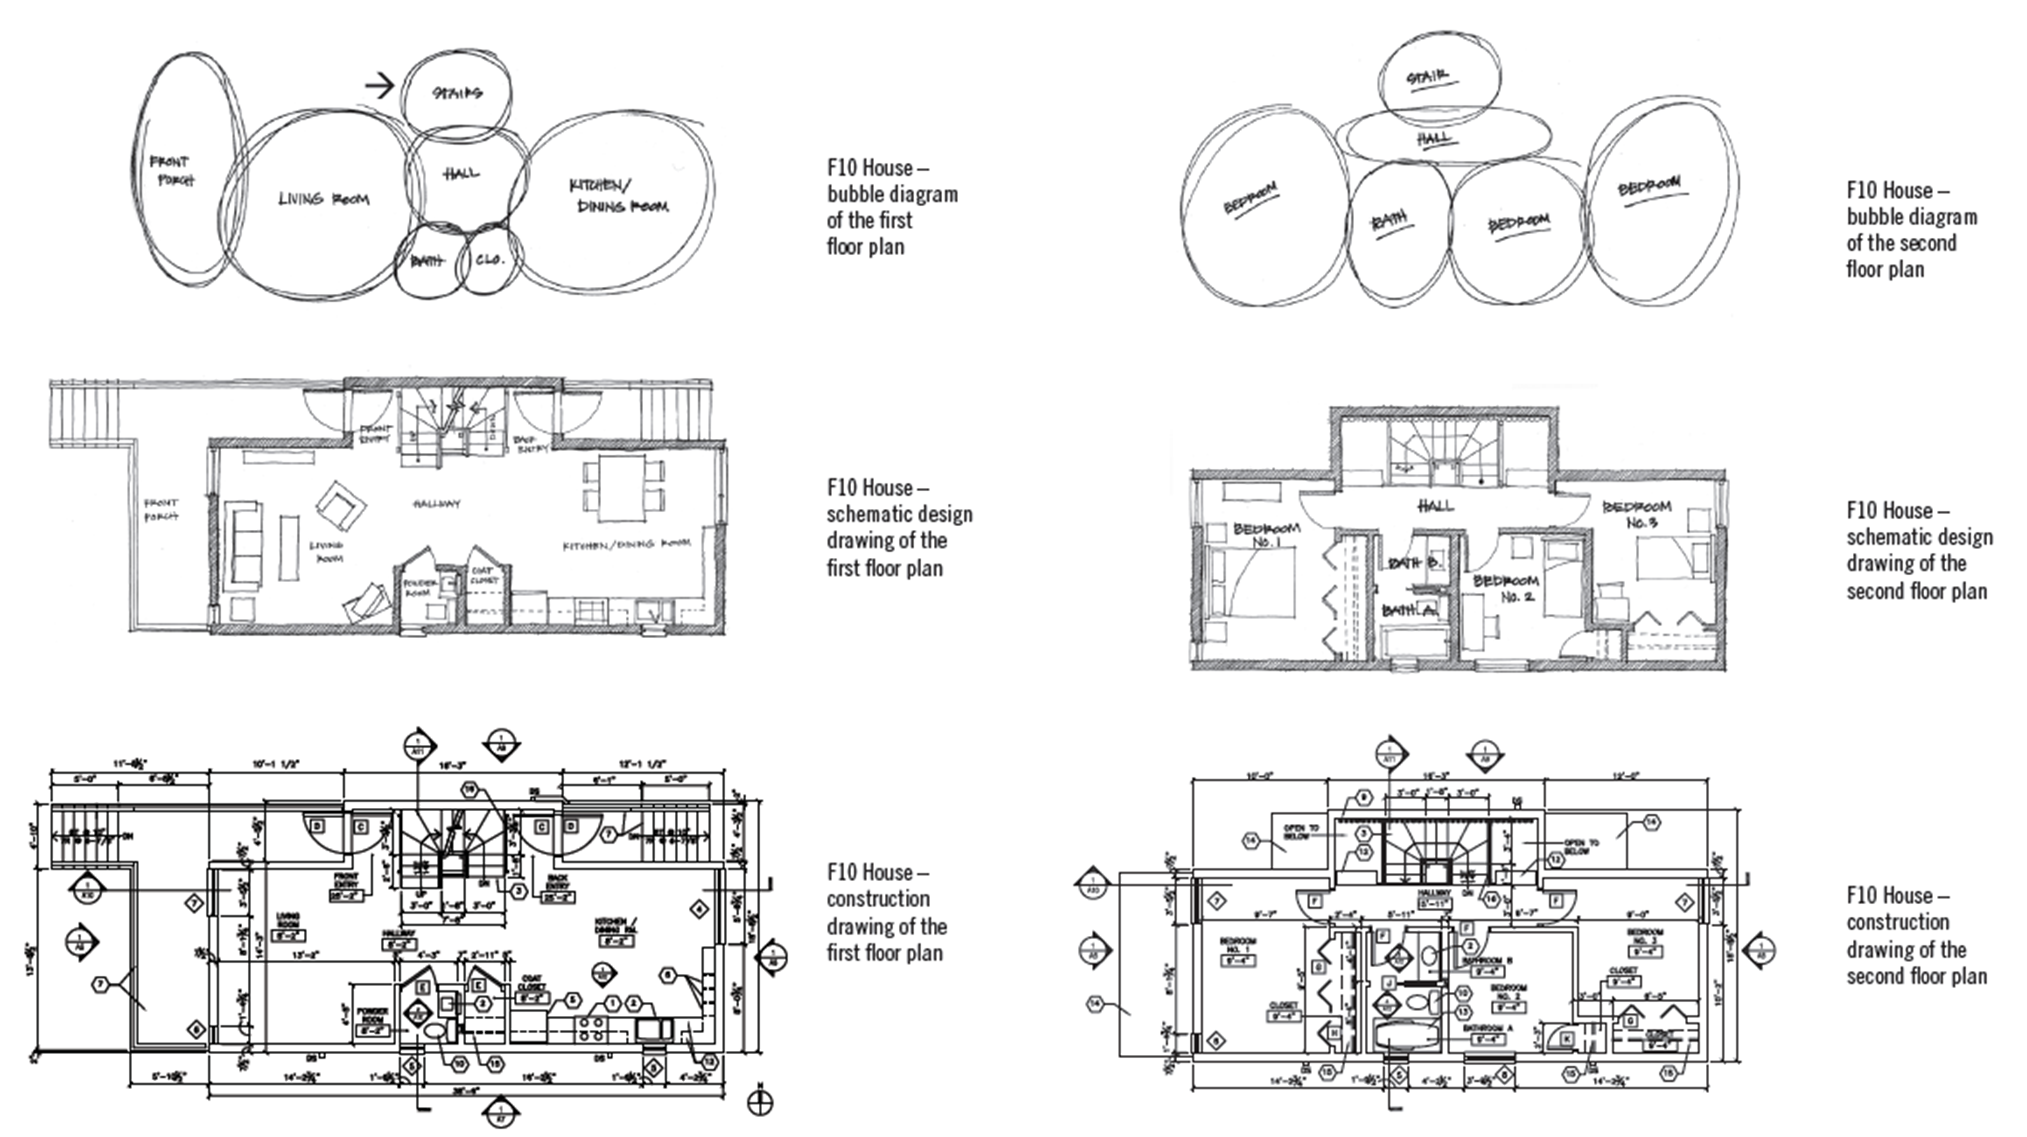
The bubble diagram is in itself a graph: rooms of different functions are represented as nodes, and the direct connections (for example a door) are represented as links (or edges). All our analyses depend on those graphs.
Masengarb, J., Rehbein, K., & Norris, B. (2008). The architecture handbook: a student guide to understanding buildings. Chicago Architecture Foundation. pp. 230-239
Graph Theory
For what it means to be a graph/network, check the following tutorial first.
Transforming Building Plans into Graph Structures 2/5
Transforming the plans manuallylink copied
If the plans are not very complex, and if you decide to abstract the spaces into nodes using a coarser resolution (e.g., one room per each node), you can manually transform the plans into graphs, as simple as drawing a bubble diagram using a transparent paper.
Read the plans and Note where the links are
Trained as architects, it is very intuitive to first read the building plans carefully to understand how the space and the functions are organized. Most of the connectivity information for generating the nodes and edges on the spatial graph/network is clearly shown on the plan. A simple (probably too simple for our purpose) but powerful pioneer of such approach is the Convex Map in space syntax, where each room is abstracted as a node and the doors become the edges connection the nodes.
Following are two examples from the Space Syntax community, transforming plans into convex maps to show the spatial configuration.
Check how the convex maps are defined: https://www.spacesyntax.online/applying-space-syntax/building-methods/representations-of-space/
Also check how the convex maps can be made with the UCL Depthmap software for space syntax analysis: http://archtech.gr/varoudis/depthmapX/LearningMaterial/depthmap7convex.pdf
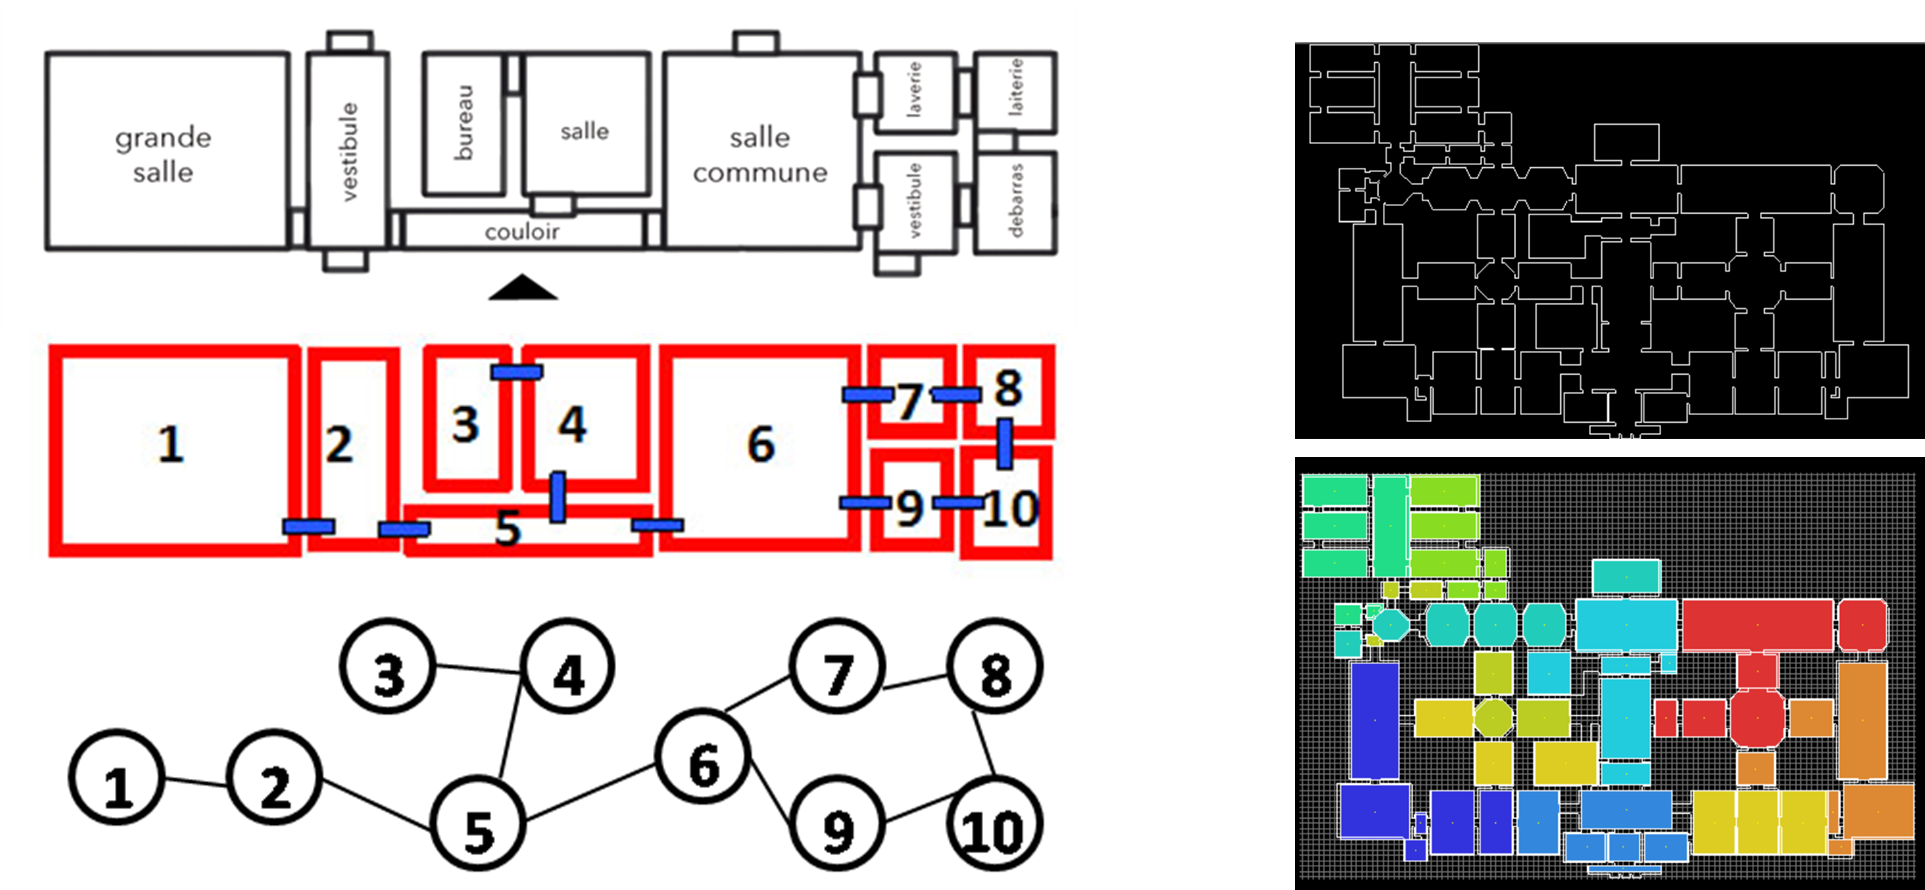
It is also possible to deviate from simply abstracting nodes from the rooms, but to make sub-divisions of the spaces in a room, especially based on their functions. Besides the practical functions, the walkable spaces inside a building can also be annotated with one of the following type:
- Walking spaces are corridors, stairs, ramps, escalators, and all such spaces that should be kept free of obstacles as bridges between pairs of spaces. These spaces mark the routes that are wide enough for people to walk through.
- Standing spaces are platforms on both sides of doors, landings of stairs, or corridor junctions which must be kept horizontal and free of obstacles. These spaces are for humans to stand on for a short while, find their way, and possibly change their paths. Thus, the intersections of walking spaces with other walking spaces or sitting spaces are labelled as standing spaces.
- Sitting spaces are horizontal spaces for stationary objects and moveable furniture. At a medium level of detail, these spaces are rooms to which one can attribute a name/function, at a high level of detail these are the tiles of space where stationary (moveable) objects are placed. Stationary immoveable objects which permanently block pedestrian movement are ignored in this classification because they do not exist in the walkable space network.
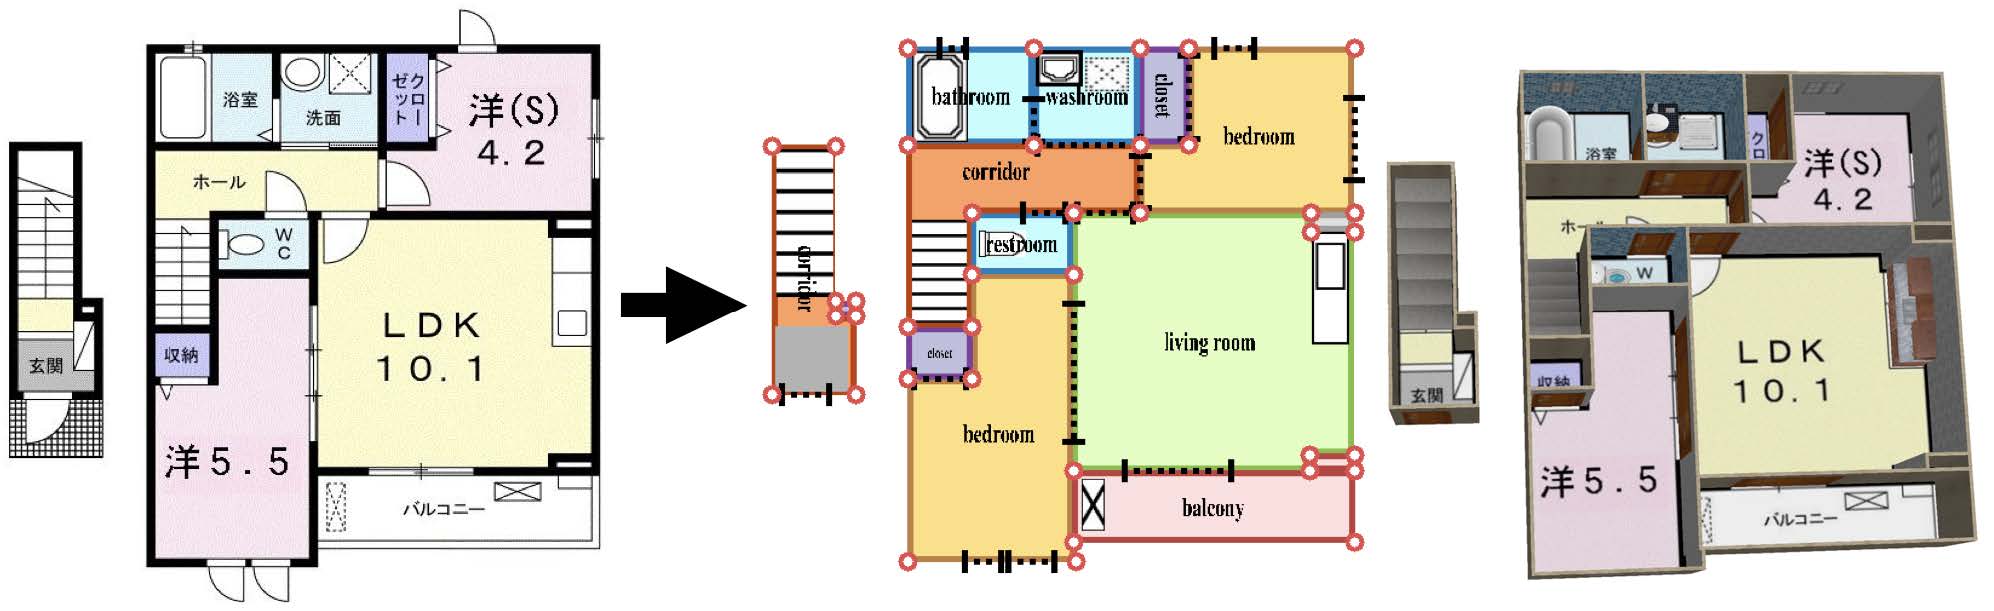
An example of making subdivisions of rooms based on their sub-type of functions is shown below. Note how the graphs in the right side of the figure demonstrate the nodes and links of the sub-divided plan.
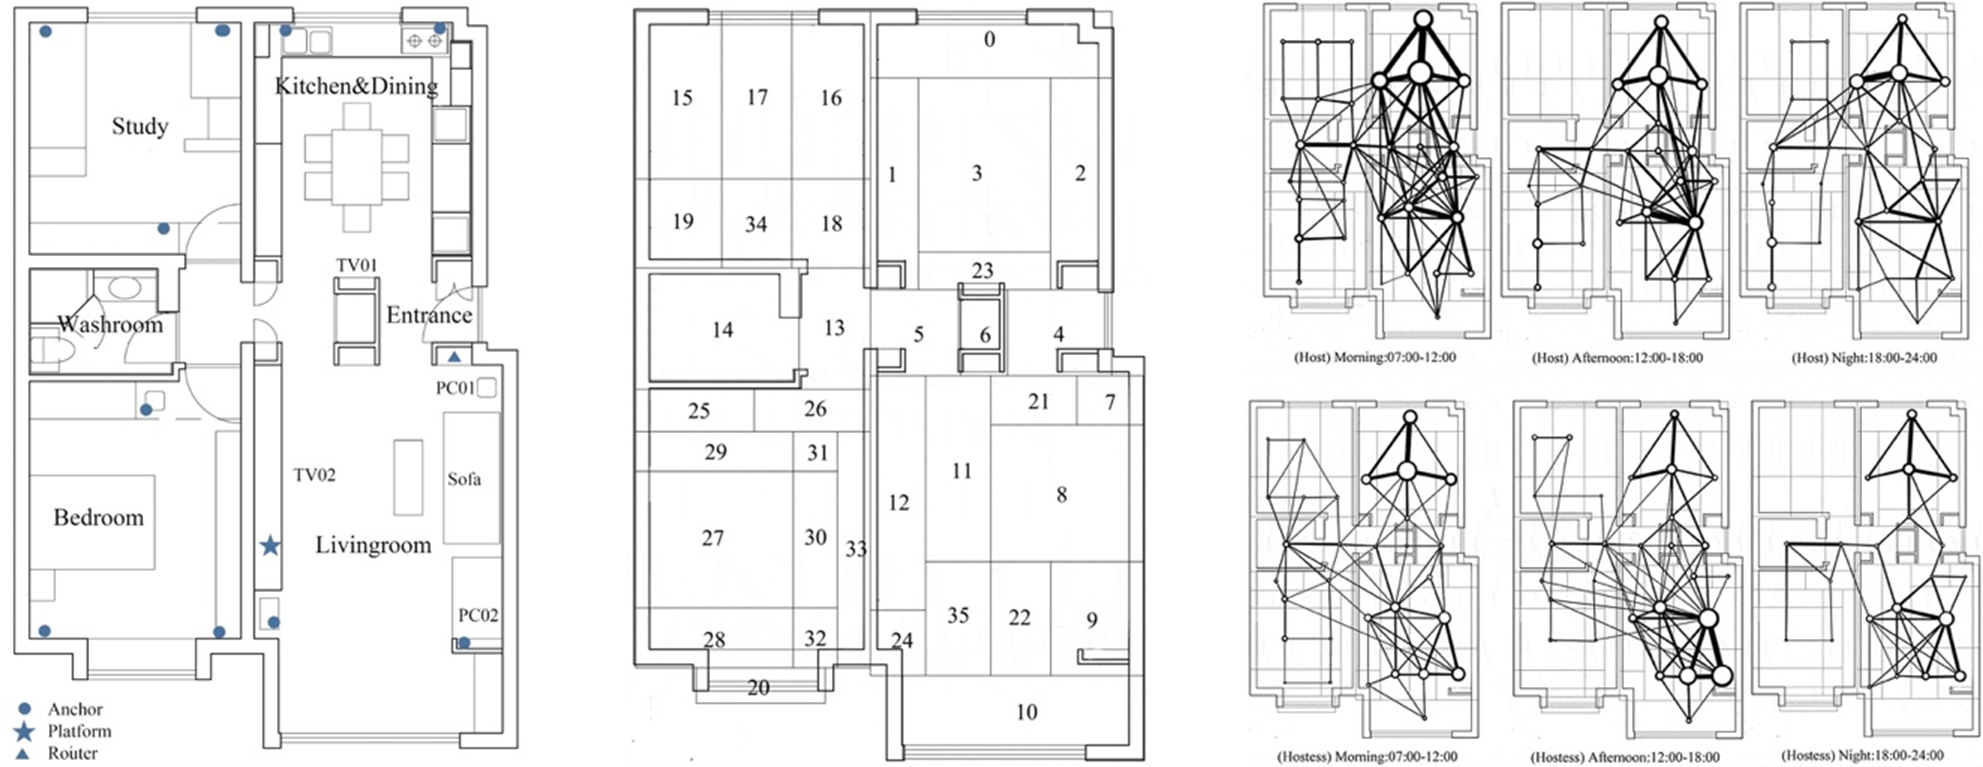
Check the original paper of using indoor positioning devices to track real-time occupation in buildings, where building a graph from the plan is an important step.
Yang, L., & Huang, W. (2019). Multi-scale analysis of residential behaviour based on UWB indoor positioning system-a case study of retired household in Beijing, China. Journal of Asian Architecture and Building Engineering, 18(5), 494–506. https://doi.org/10.1080/13467581.2019.1682000
Formating of the Transformed Plans
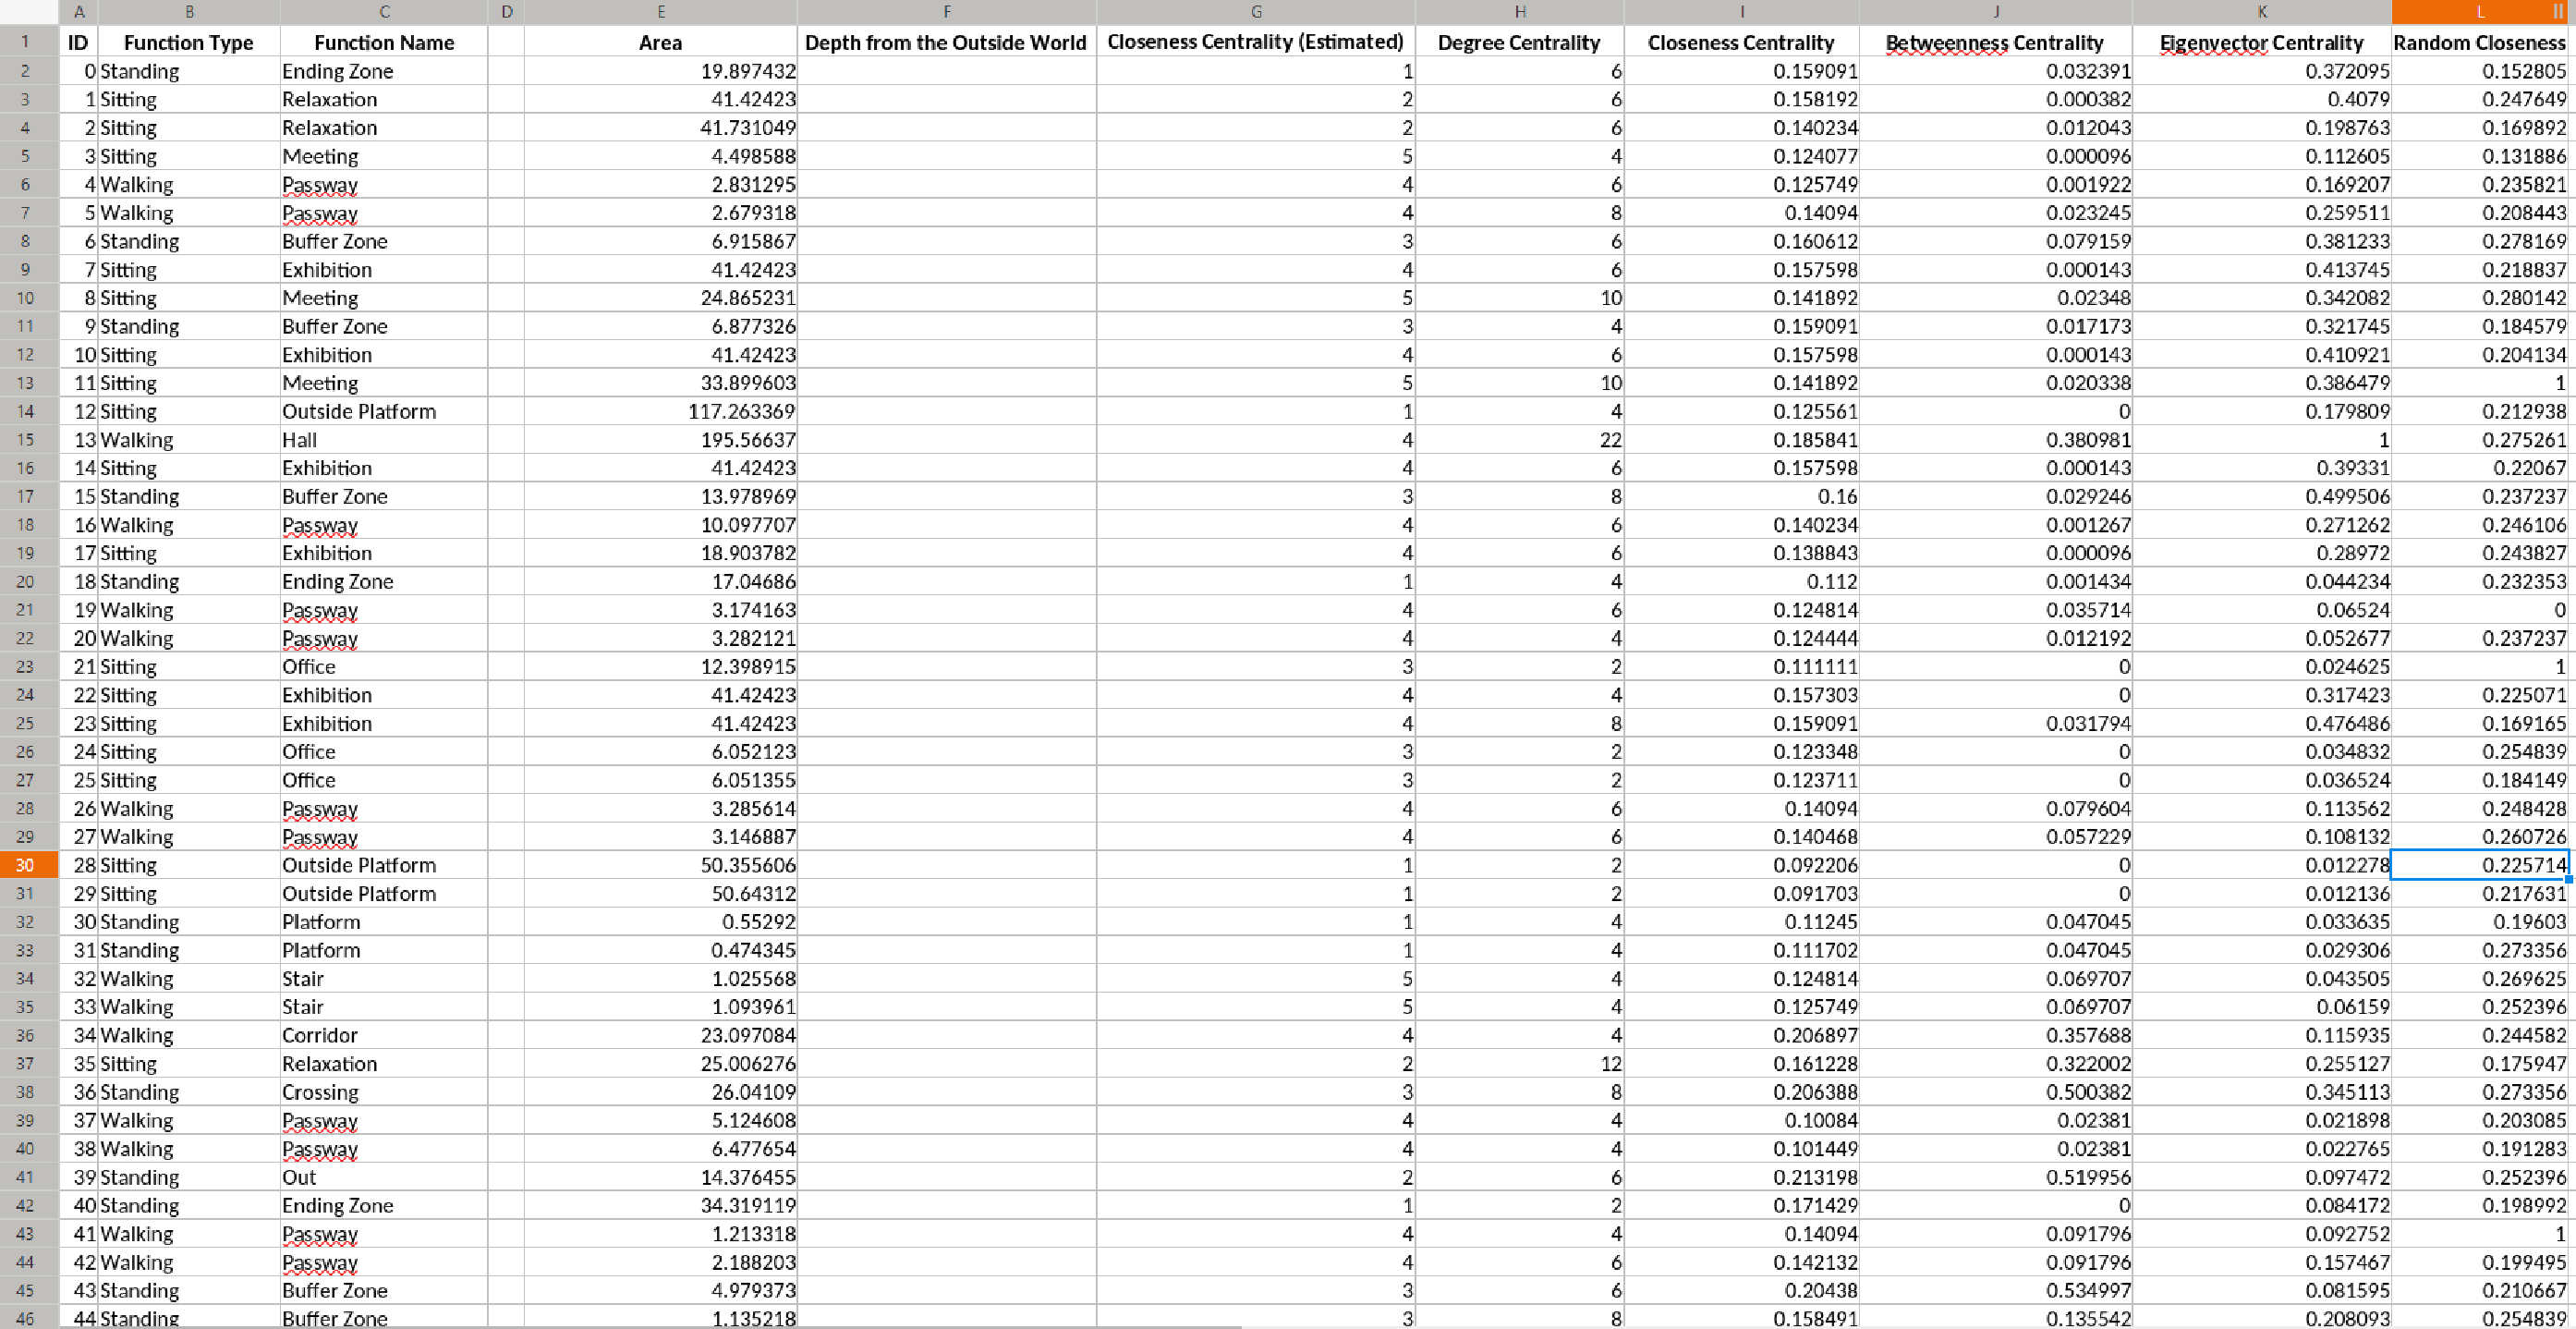
The way how you divide the space is quite flexible and you are free to choose. What is actually important is how you structure and format the transformed plan as a graph. Essentially, you will need two tables to record the structure of a graph: a node table and a link table.
- The most important property of a node table is the ID of each sub-divided space, as with all the figures shown above. Put the nodes down in an Excel file and take note on each of them. You may consider noting down information, such as:
- their function name (real functions such as meeting room, exhibition space, pathways, etc.)
- their function type (high-level functions such as circulation, technical and mechanical, functional, etc.)
- their space type (sitting, standing, or walking, as mentioned above)
- their areas in square metres
- any other additional first-source information that you consider interesting for your analyitical purpose
- secondary information to be computed and added later (such as centrality measures)
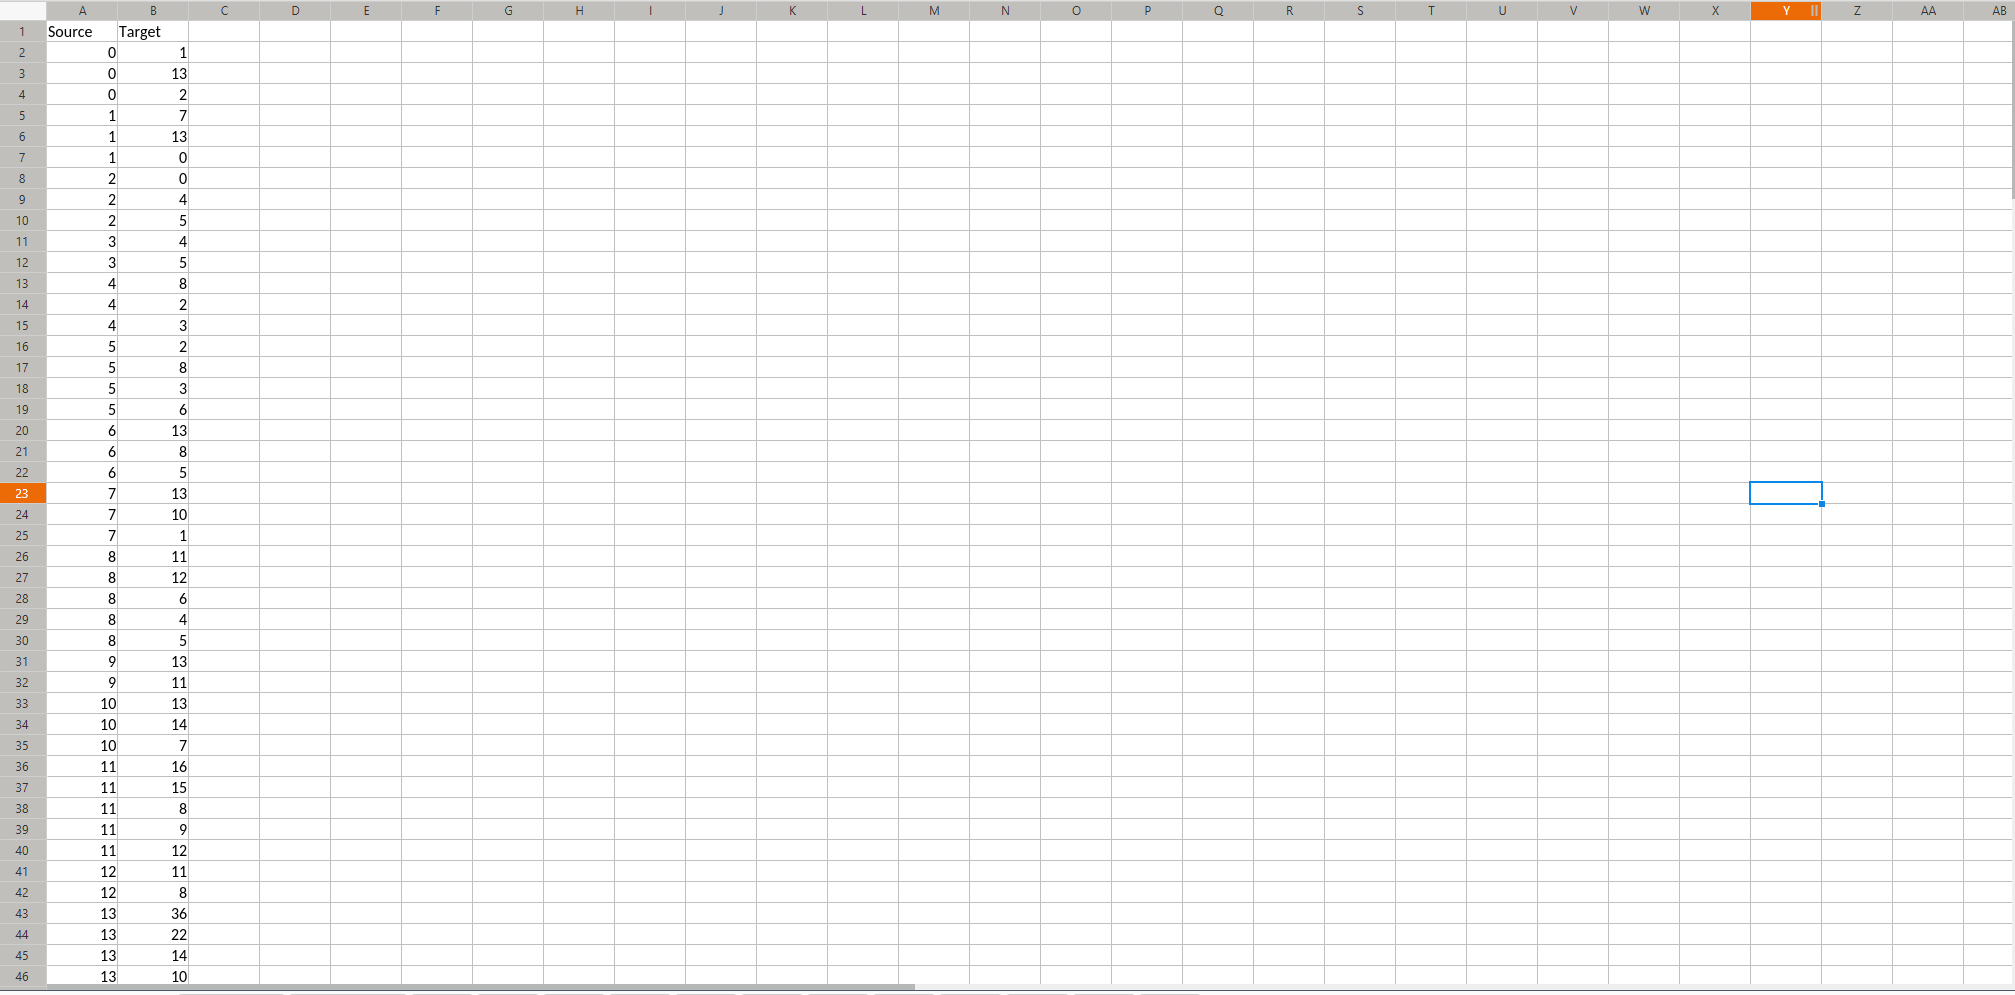
- In the link table, it is more straightforward. Practically only two columns are needed – source and target, where you write down the IDs of the two nodes (rooms) that are connected (i.e., directly accessible from each other). Since usually the accessibility is a bi-directional relation, we only need to write down the symetrical pair once. Still, you may creatively add more attributes to each of the link, such as:
- the real-world traffic flow of human occupants
- computer-simulated traffic flow of users
- the type of connections between the two nodes (openly adjacent, semi-open with a door, visually connected via a window, etc.)
Long story short, the only technically required columns for constructing the graph structure of a plan (for the computers) are:
- the IDs in the node table, which needs to be uniquely paired to the plan
- the source and target IDs in the link table, which need to mark all the direct links in the plan
Except for these, all the other information is merely for us, as architects and researchers, to understand the meanings and contexts of the graphs better.
Practical Tips
Some practical tips for special occassions of floor plan transformation:
- In case of multiple floors, you may consider to choose between the following options:
- set up a node for the stairs, escalators, and/or elevators for each floor, and connect these nodes together in a logical order (e.g., the stairs and escalators of 2nd floor connected to that of 3rd and 1st, but not to the 4th, but all the elevators are connected together);
- set up a node reflecting on the reality (e.g., one node for the stair connecting 1st and 2nd floor, and only one node for the elevator floor), then connect these nodes to the standing space in front of the circulation spaces.
- To show the entrances, you may want to:
- construct a node representing the entire outside world (with infinite area of square metres), and connect all the entrances to the same node;
- construct a node for each of the immediate streets outside of each entrance, and connect the nodes of streets together based on their accessibility.
- Don’t make the function types too complicated. You may want to have no more than 20 types of functions in your building case study.
- Decide on the granuality of the nodes wisely:
- For a large project, we might want to have more abstract nodes (such as rooms or cluster of rooms)
- For small projects with requirements of finegrained analyses, we might want to have more spatially sub-divided nodes (such as sitting spaces and standing spaces divided by furniture)
- A rule of thumb for a good graph is to have more than 10, and less than 200 nodes.
Transforming Building Plans into Graph Structures 3/5
Transforming the plans with Rhino and Grasshopperlink copied
Alternatively, you can accelerate the transformation and structuring processes with the help of Rhino and Grasshopper. The following are tips and tricks on how to draw walkable surface meshes in Rhino 5 on Windows. For Mac versions or other versions of Rhino some things might be different.
You can access the exemplary files in .3dm and .gh for this tutorials in the following:
Drawing Node Meshes in Rhino
You can first draw the nodes of floor plans as meshes.
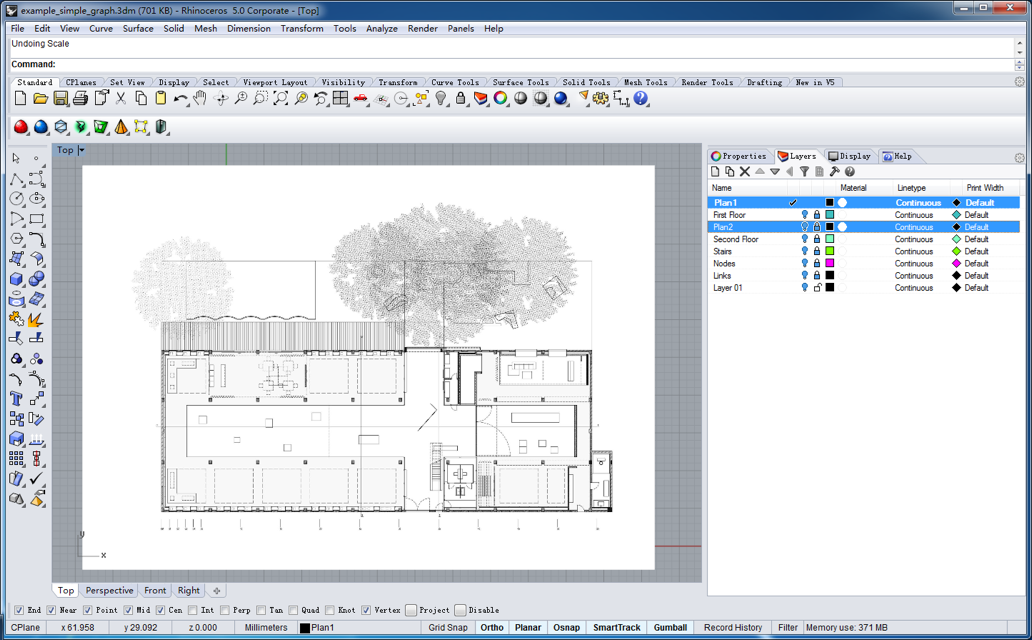
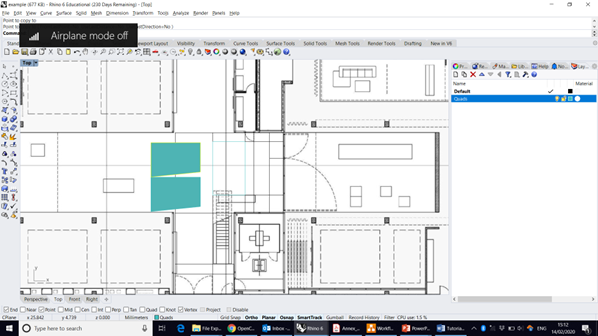
Import your plan into Rhino using command “PictureFrame” and “scale ” it to the proper size. Place the floor plans of different height into their correct position. We suggest you to make different layers for each plan.
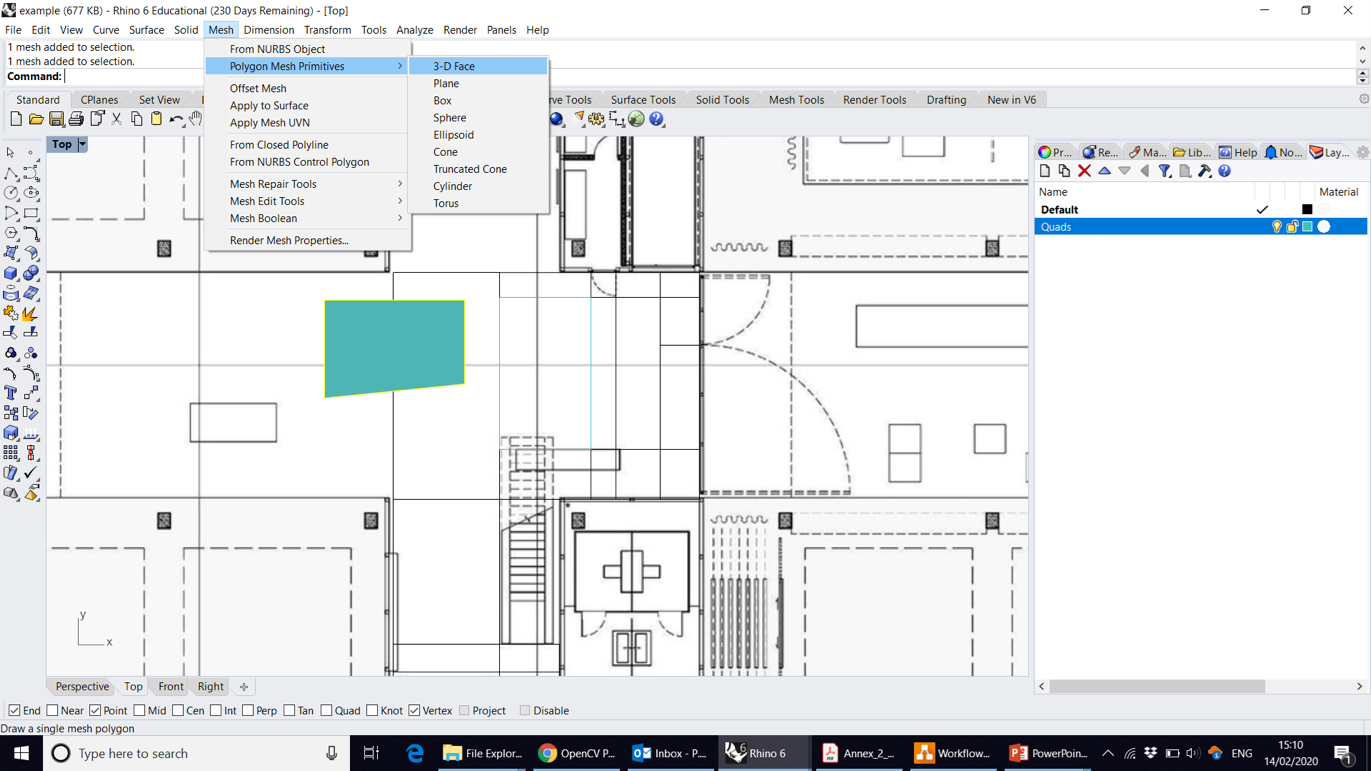
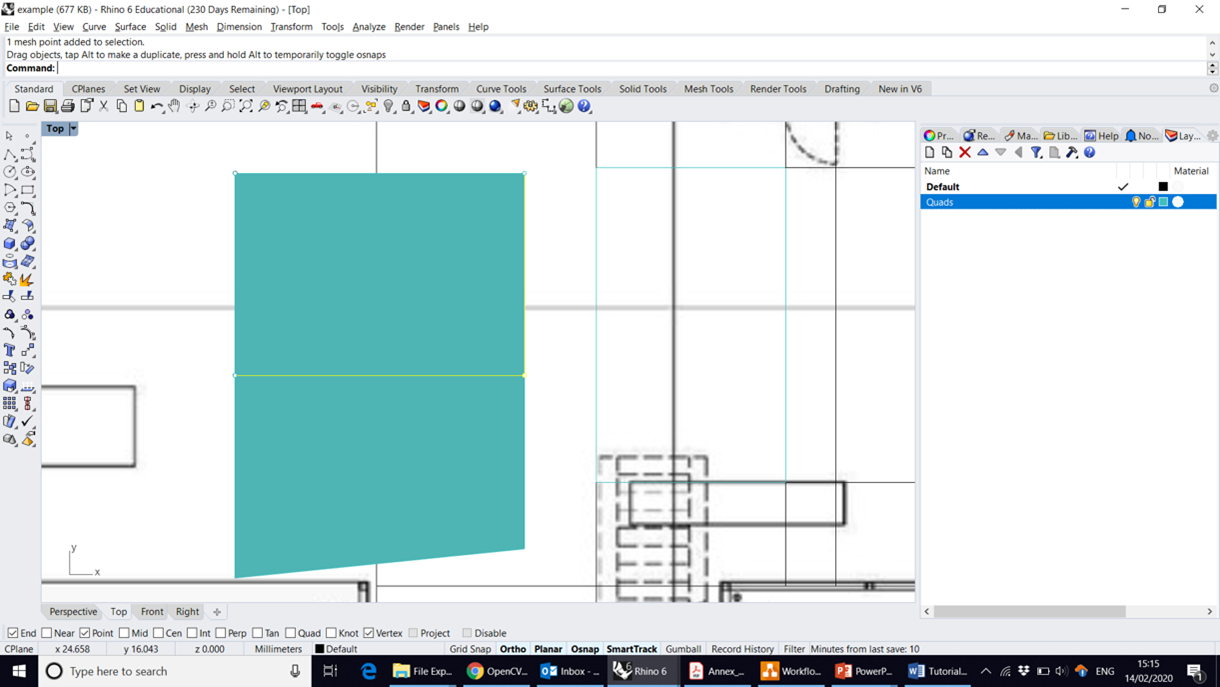
Add a new layer and call it Quad-Meshes (or add different layers for different plan height), then give the layer a distinct color, e.g. Turquoise or something like that. Then start drawing the quad mesh faces using the 3D Mesh face command. It is important to make an abstract quadmesh representing the overall “outside world”, which later you will need to connect to all the nodes representing the entrance/exit.
Make sure that the snapping option for mesh vertices is turned on.
You can press Function+F10 to turn on Mesh Vertices in case you need to edit the mesh quads. Alternatively, you can access this tool via the command line by typing “PointsOn”.
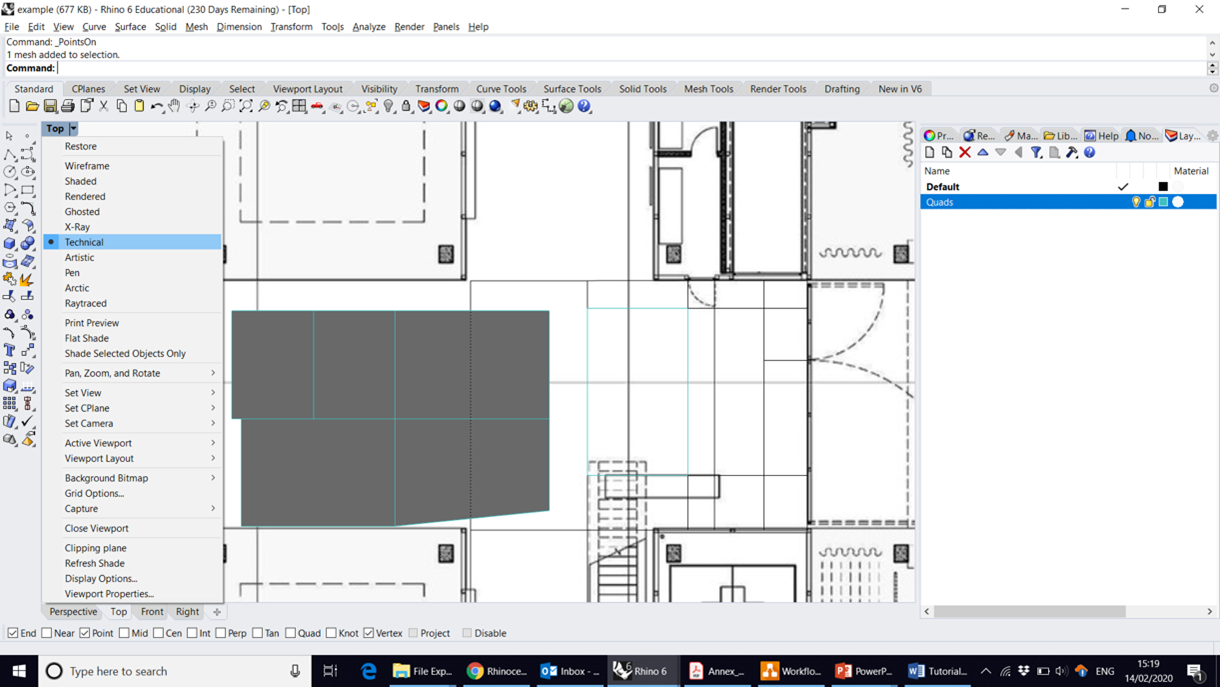
It might be handy to set the view style to technical:
Organizing Nodes in Grasshopper
Then you can organize the meshes drawn in Rhino with Grasshopper for clarity.
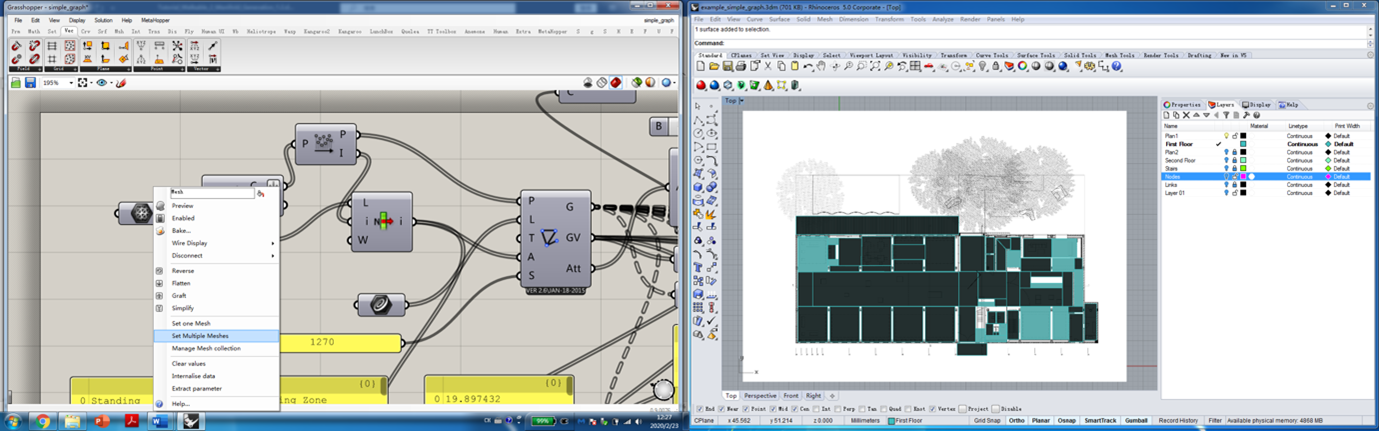
After drawing the meshes, add them into the grasshopper with button “set multiple meshes” and compute the centre points of all of them, sort the points to make the later labelling job easier:
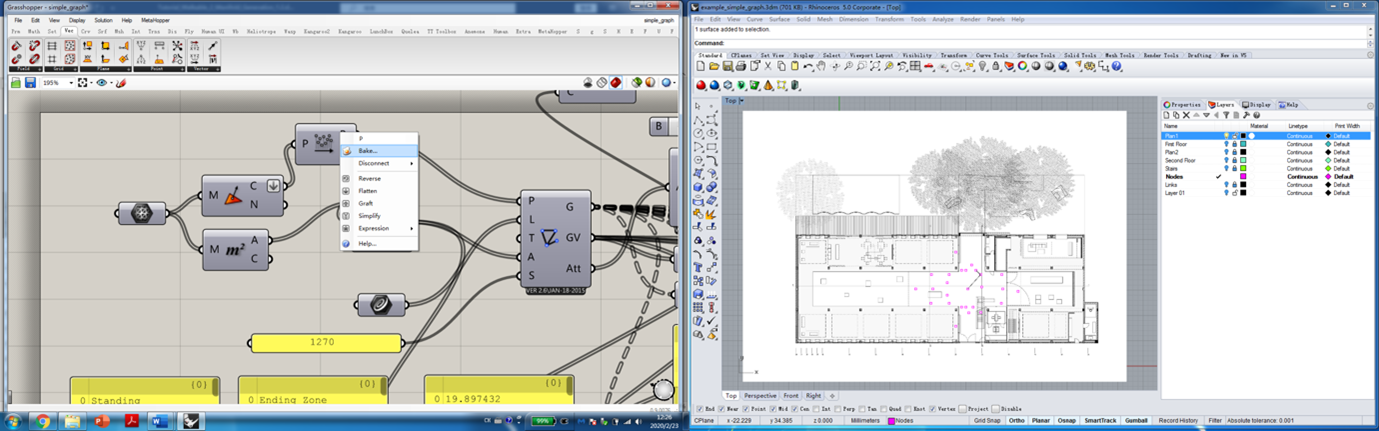
Create a new layer called “Nodes”. Bake the sorted points in grasshopper back to rhino, and put the nodes into the layer “Nodes”:
Drawing the Links
Then you can draw the links among the node meshes in Rhino and also organize them in Grasshopper.
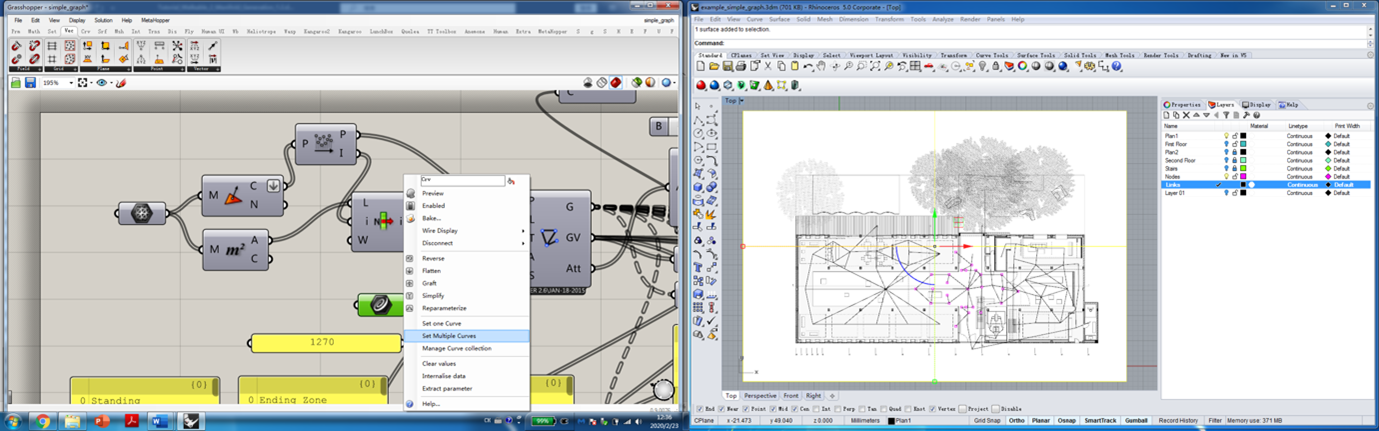
Create a new layer called “Links”. Draw a link between the nodes if there is a direct connection between the spaces, i.e., people can walk across the space. Use “Line” tool/command to draw the links in Rhino. After drawing all the links, select all of them and use “add multiple curves” to add them into grasshopper. This is a very important step, as you need to be careful of the topological relations/connections. It is very easy to miss one or two links at the beginning. However, it does not matter that much as you can always add the ones that you have missed in the beginning later. But make sure to re-add all the links to grasshopper when you make any changes. Remember to connect entrance/exits nodes to the outside-world node. It will be used to demonstrate the accessibility of the building.
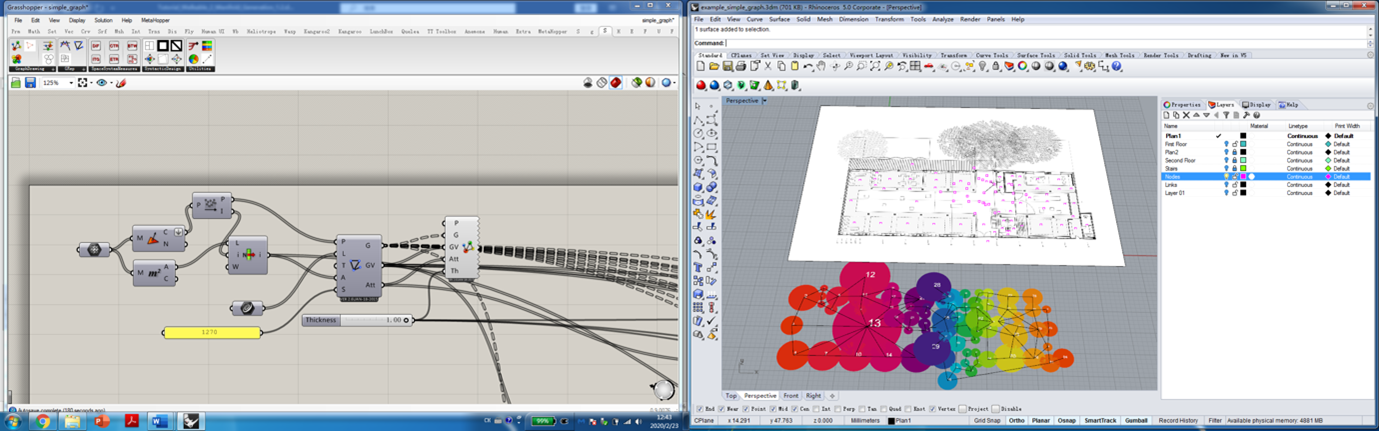
Input the links and nodes that you have into the tool “GraphFromNodes&Links” and output the default values into the tool “DiskoGraphDrawing” of SYNTACTIC library and you will see a default graph with indices of each node displayed (you need to set a plane in Rhino for the graph to display).
Annotating the Nodes in Excel
Now you can copy-paste the information from Grasshopper to an Excel file of node and link tables, the same as the process of transforming the plans manually.
Now that you have the topological nodes and the plan displayed next to each other, you will need to open you excel sheet and label each node with their function type (sitting/standing/walking) and their function name from the list you have in the last week. The same as the last tutorial.
Later you can copy-paste the labels that you make into grasshopper panels and you can then change your display with a better denotation. You can also copy-paste the data/information from grasshopper into excel to prepare the Area column in the node list and From/To columns in link list, which will later be used in Gephi.
Play with the grasshopper example given to you. In Grasshopper, you can see where a component comes from (which menu/plugin) by pressing Ctrl+Alt+ Clicking LMB (Left Mouse Button). You have full freedom to discover what are the tools doing if interested.
Transforming Building Plans into Graph Structures 4/5
Transforming the plans with Artificial Intelligencelink copied
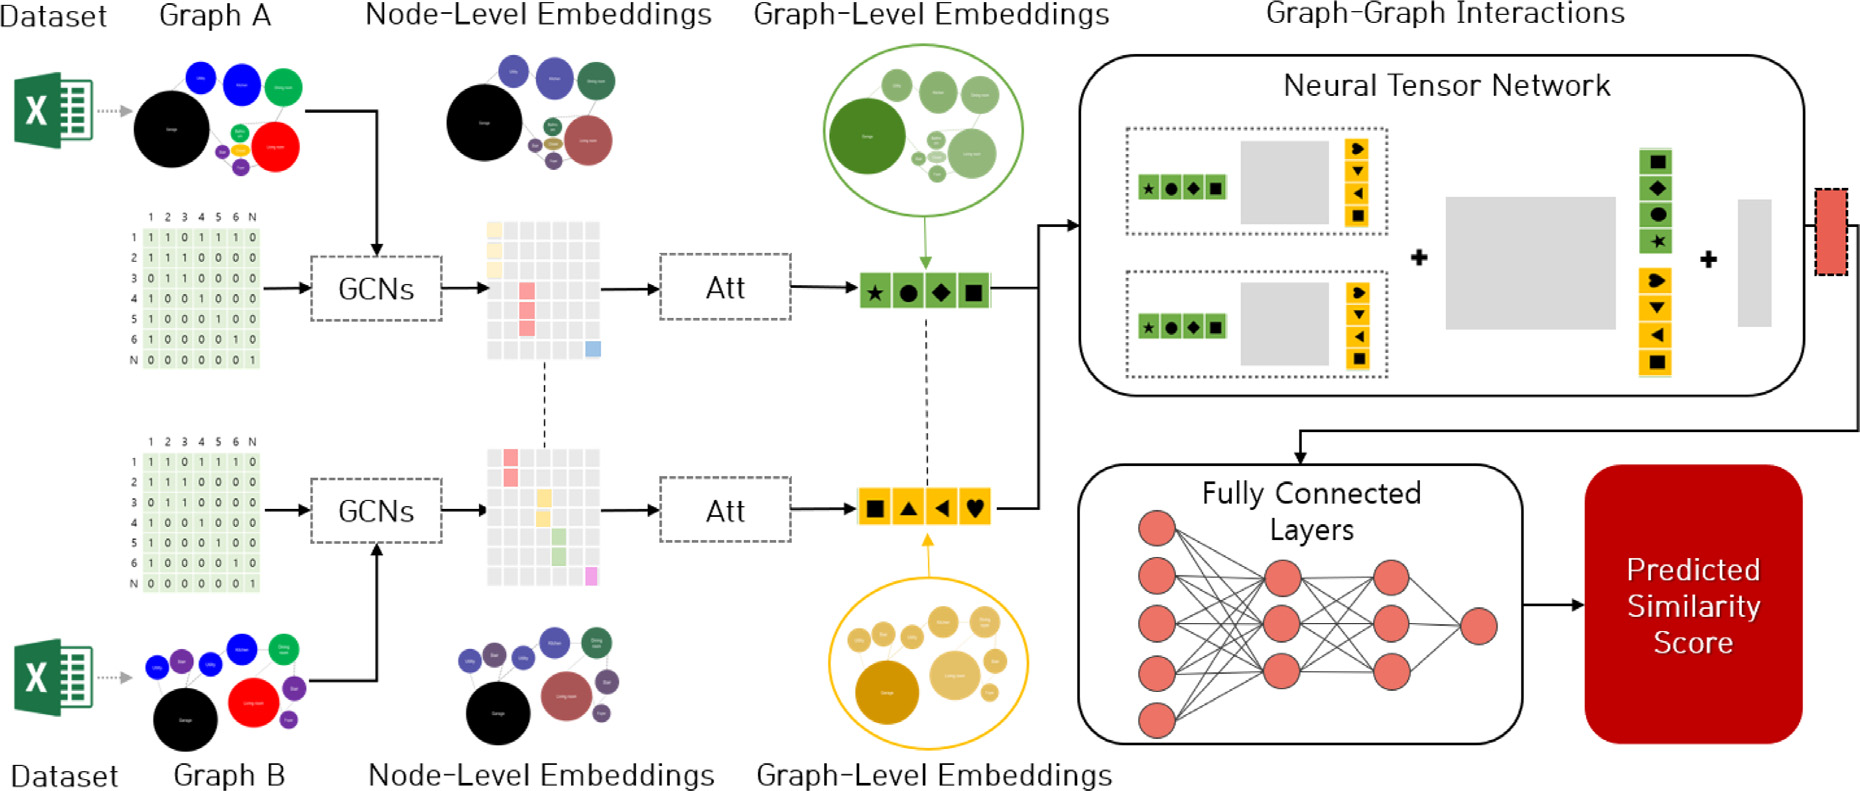
With the fast development of Artificial Intelligence, graph-based models are being developed to automatically transform raster building plans into vector graphs. This is a very crucial step for plan generation and recommendations.
This is, however, out of the scope of this tutorial at the current stage. But you are welcome to discover possibilities with some additional resources if you are already aware of the usage of these tools.
Raster-to-Vector: Revisiting Floorplan Transformation
Liu, C., Wu, J., Kohli, P., & Furukawa, Y. (2017). Raster-to-vector: Revisiting floorplan transformation. In Proceedings of the IEEE International Conference on Computer Vision (pp. 2195-2203).
Check the GitHub page
House-GAN
Nauata, N., Chang, K. H., Cheng, C. Y., Mori, G., & Furukawa, Y. (2020). House-gan: Relational generative adversarial networks for graph-constrained house layout generation. In Computer Vision–ECCV 2020: 16th European Conference, Glasgow, UK, August 23–28, 2020, Proceedings, Part I 16 (pp. 162-177). Springer International Publishing.
Check the GitHub page
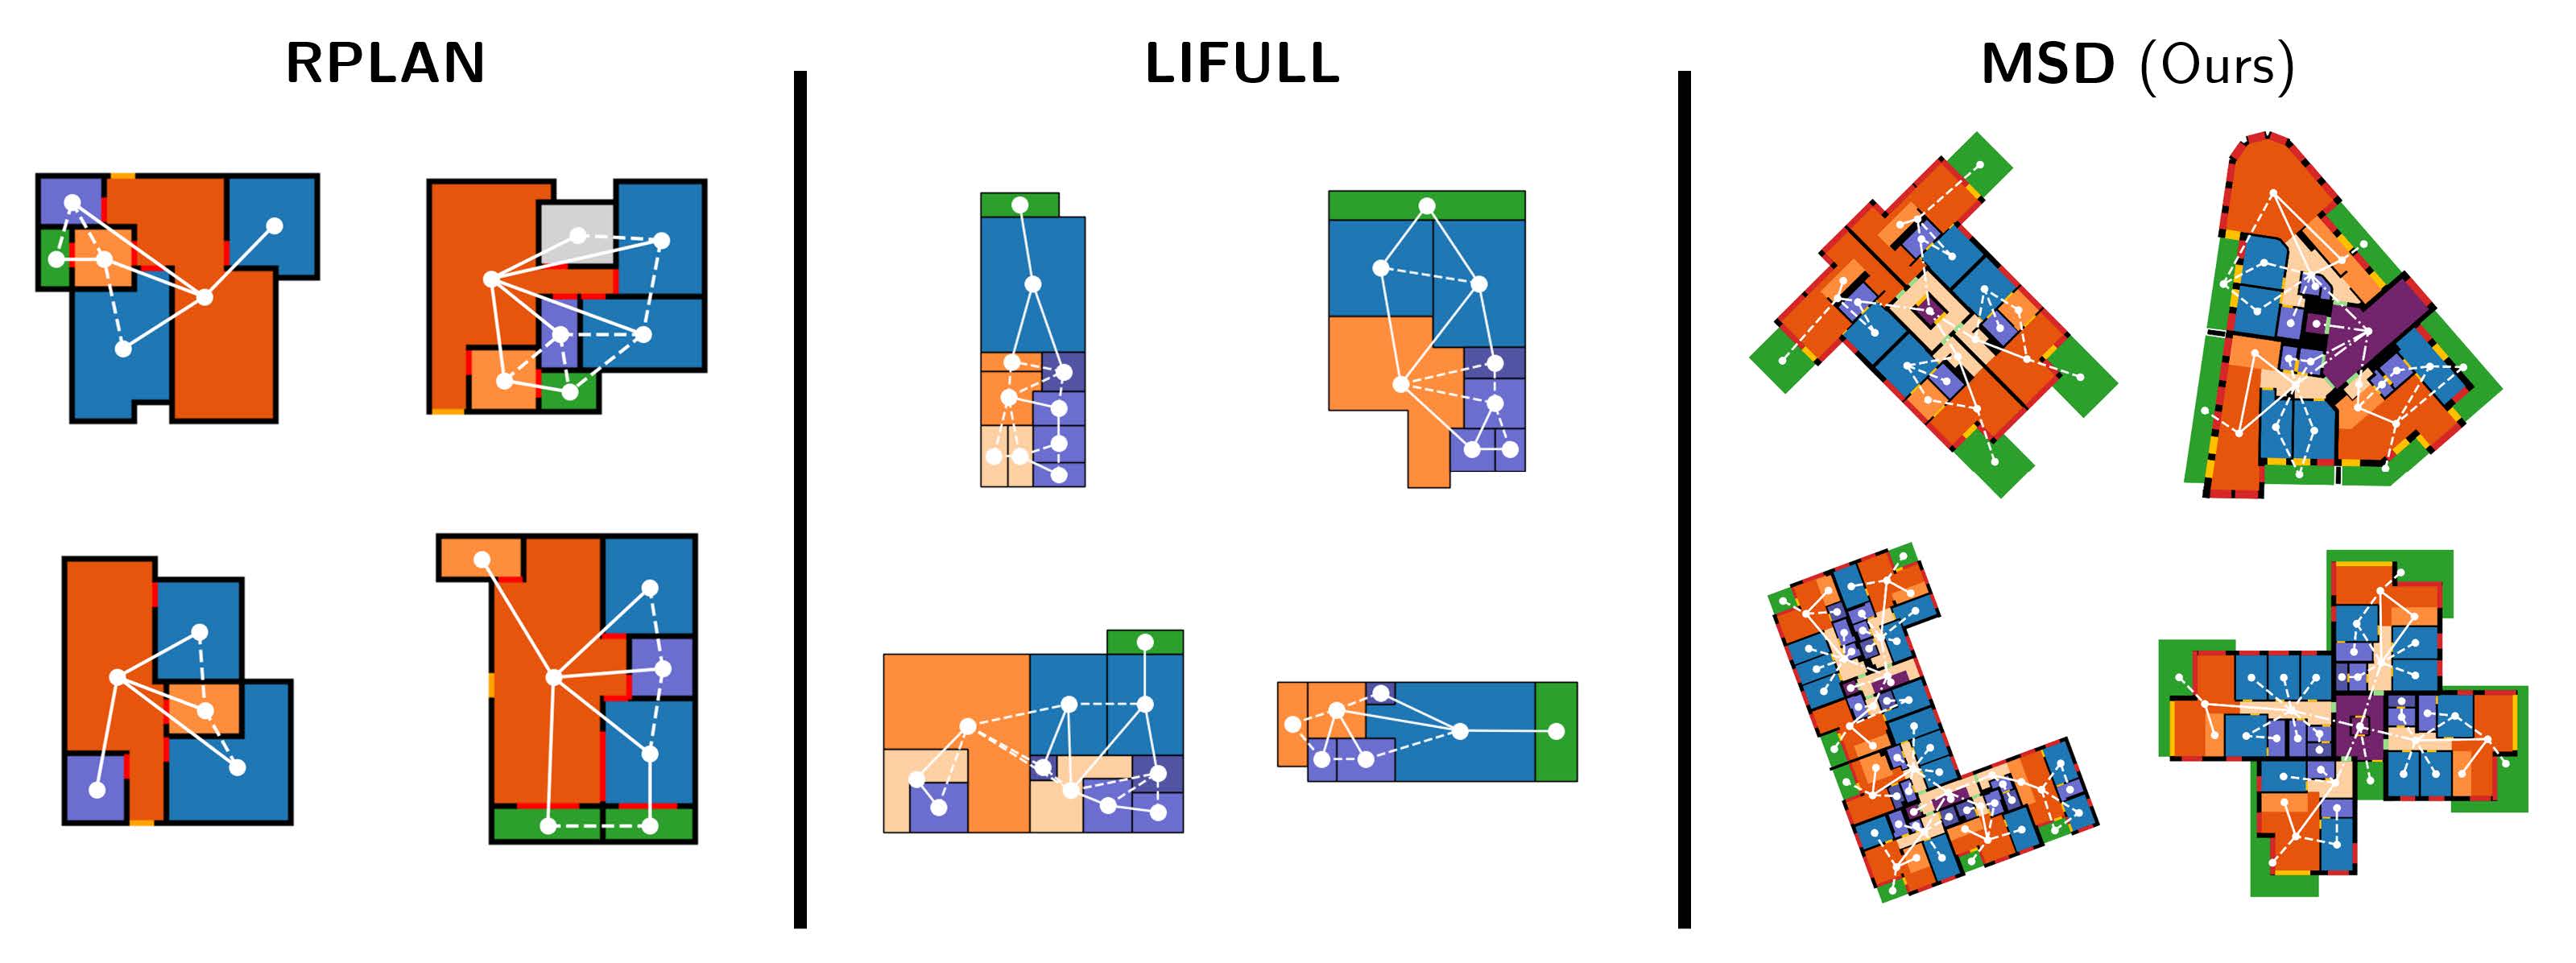
MSD: A Benchmark Dataset for Floor Plan Generation of Building Complexes
Van Engelenburg, C., Mostafavi, F., Kuhn, E., Jeon, Y., Franzen, M., Standfest, M., … & Khademi, S. (2024, September). MSD: A Benchmark Dataset for Floor Plan Generation of Building Complexes. In European Conference on Computer Vision (pp. 60-75). Cham: Springer Nature Switzerland.
Check the GitHub page
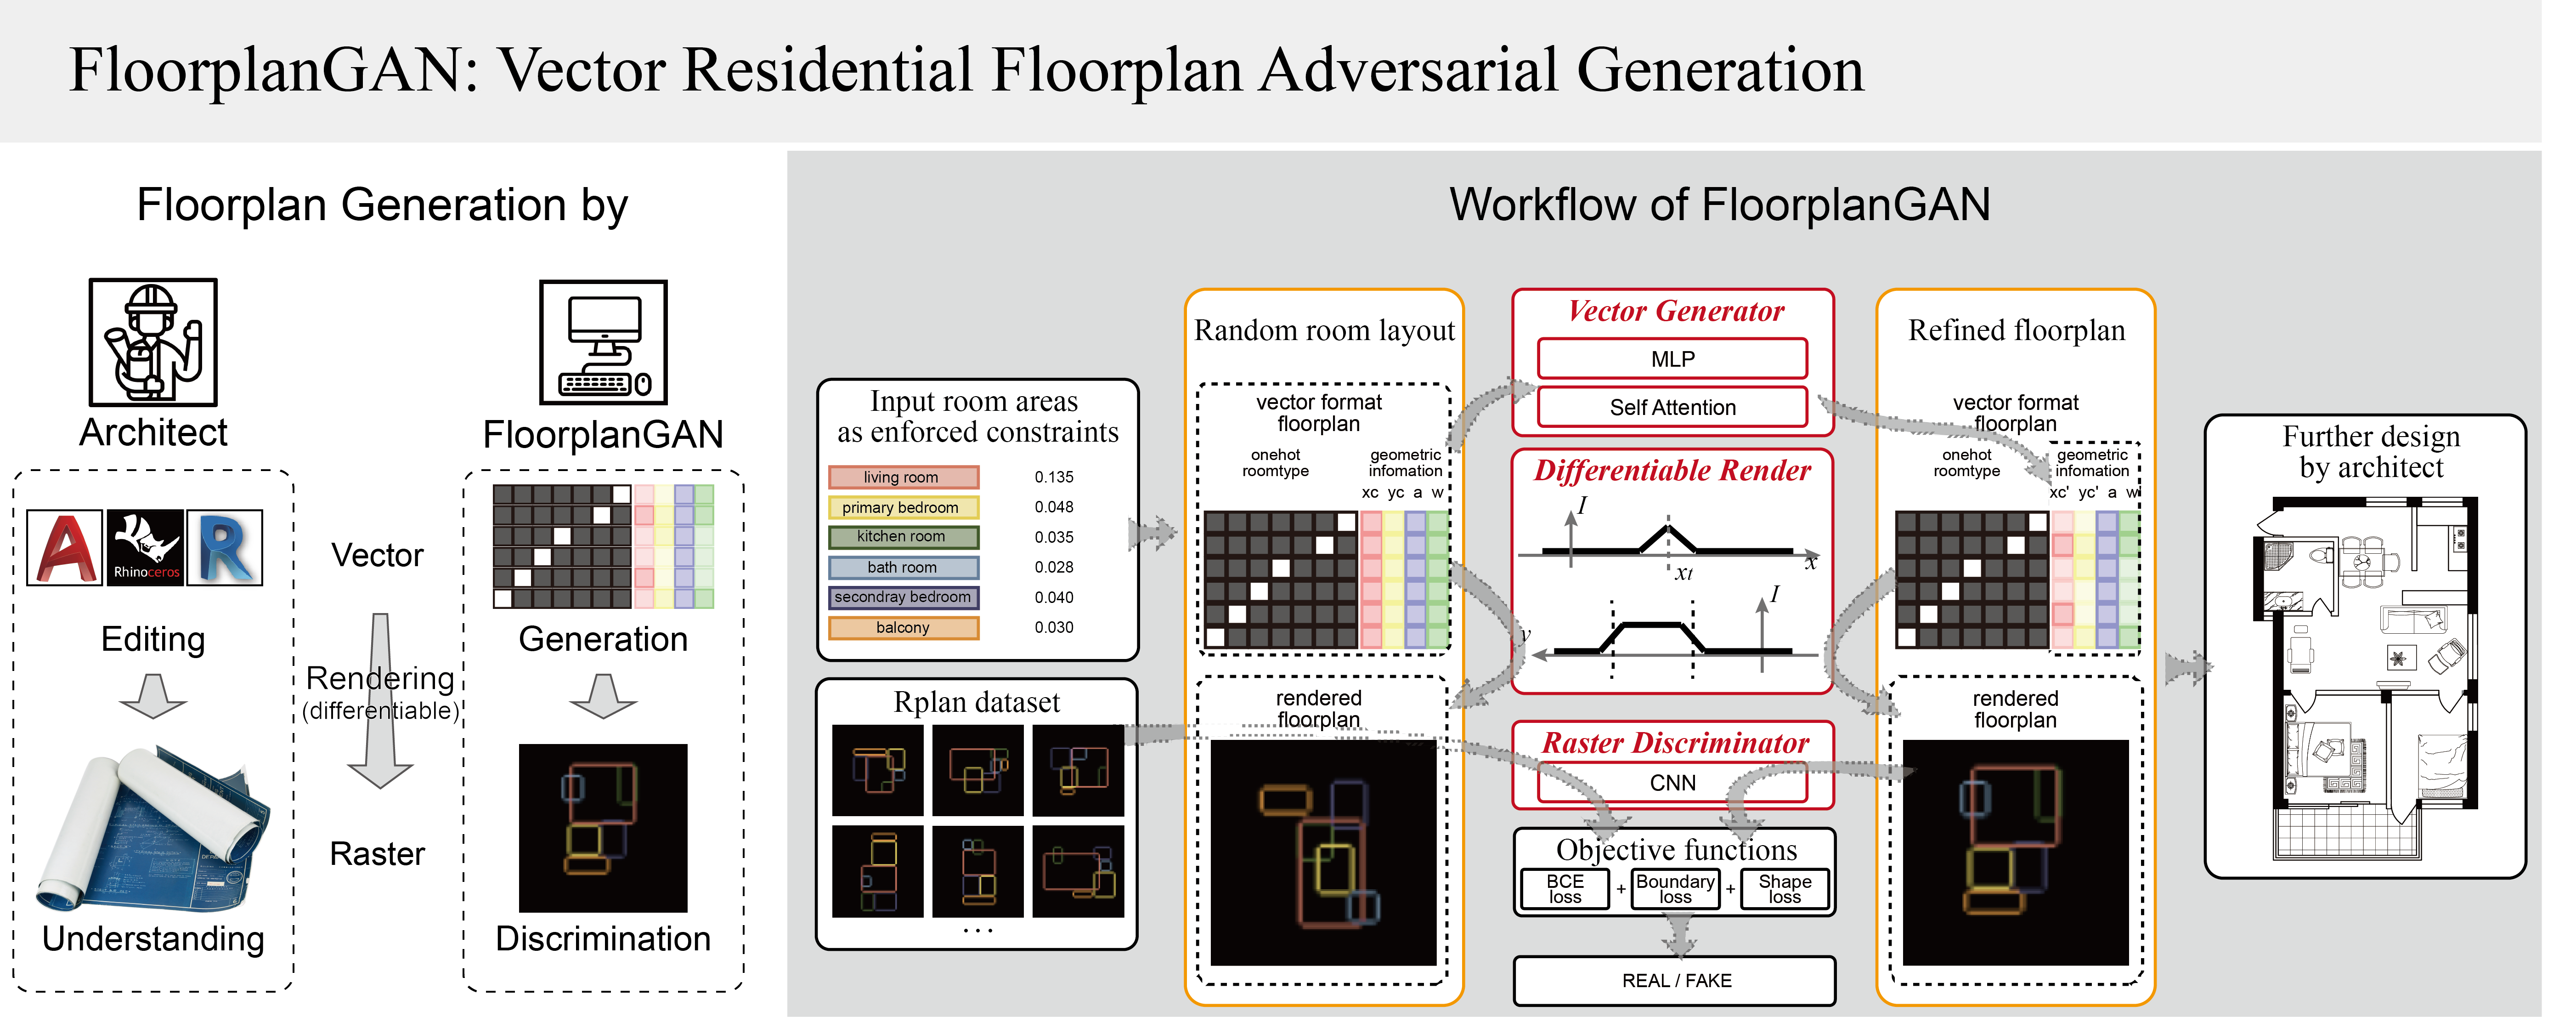
FloorplanGAN: Vector residential floorplan adversarial generation
Luo, Z., & Huang, W. (2022). FloorplanGAN: Vector residential floorplan adversarial generation. Automation in construction, 142, 104470.
Check the GitHub page
Other Relevant Publications
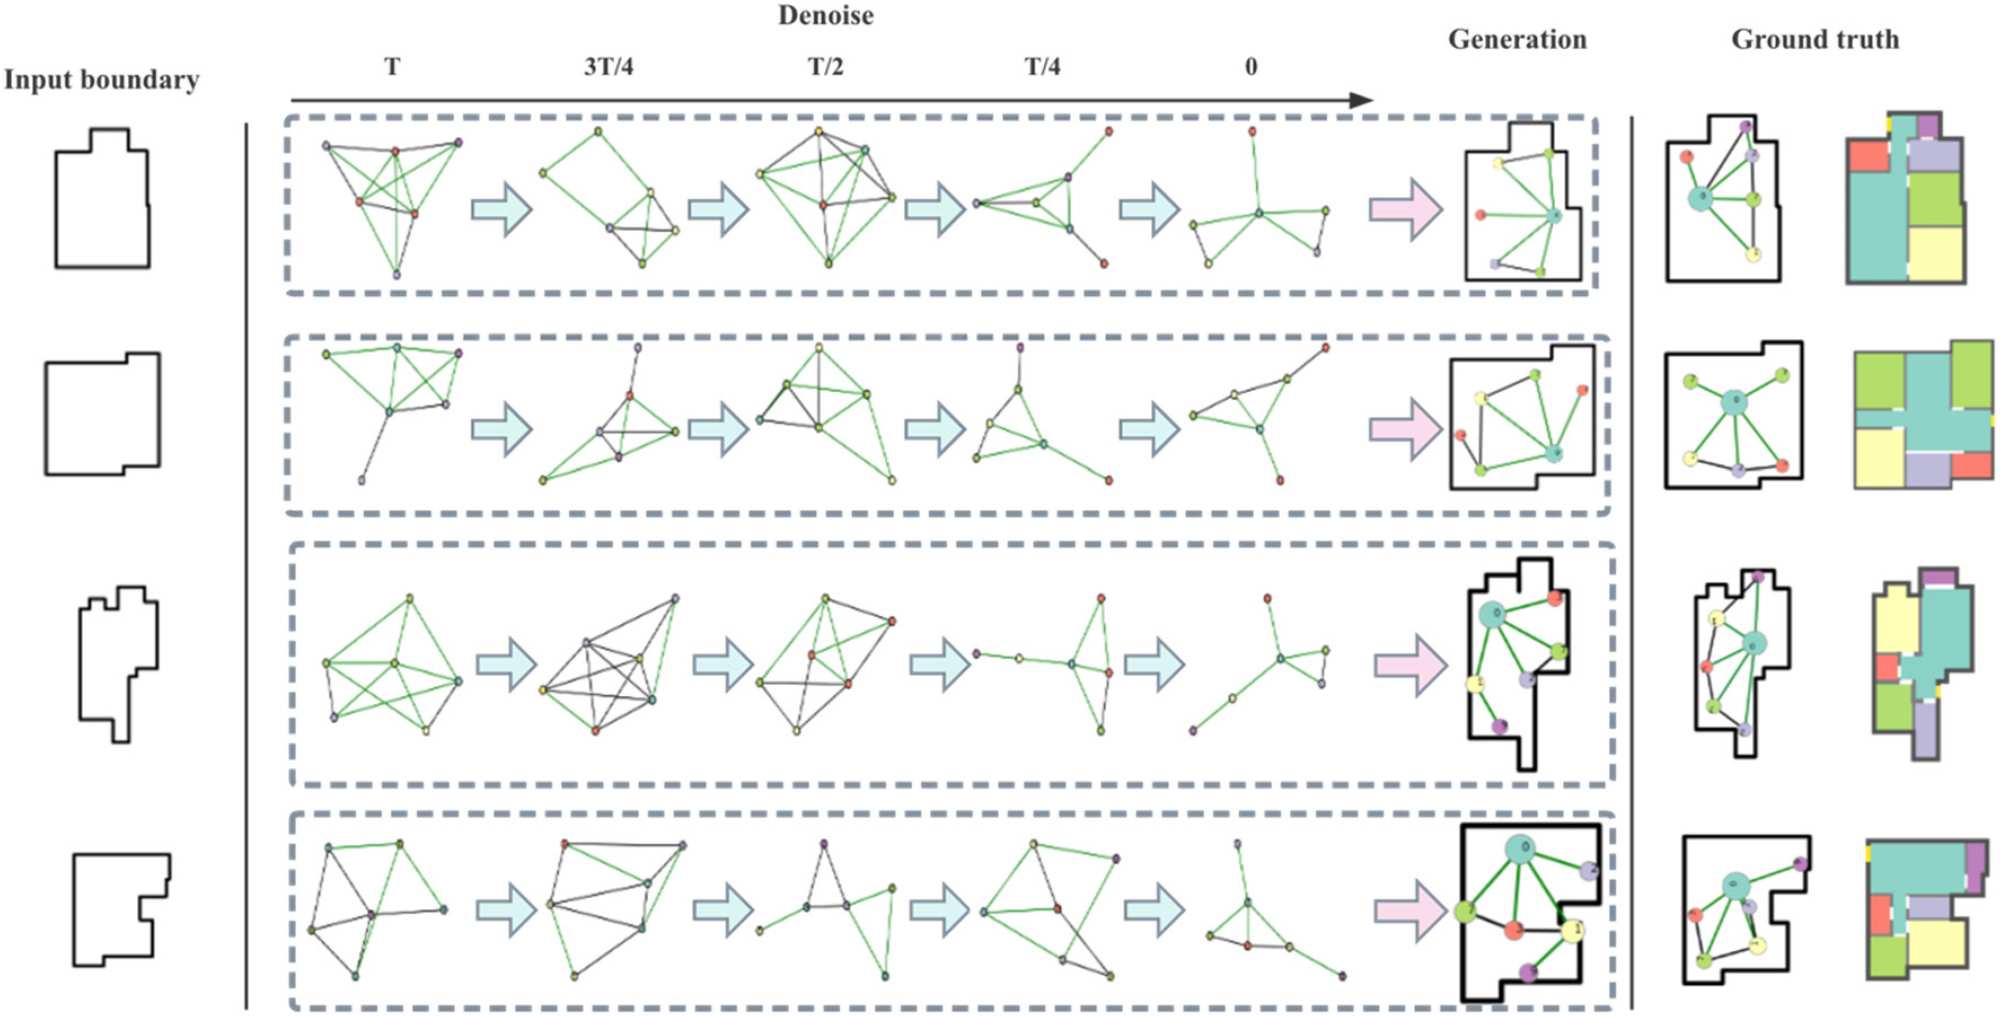
Su, P., Lu, W., Chen, J., & Hong, S. (2024). Floor plan graph learning for generative design of residential buildings: a discrete denoising diffusion model. Building Research & Information, 52(6), 627-643.
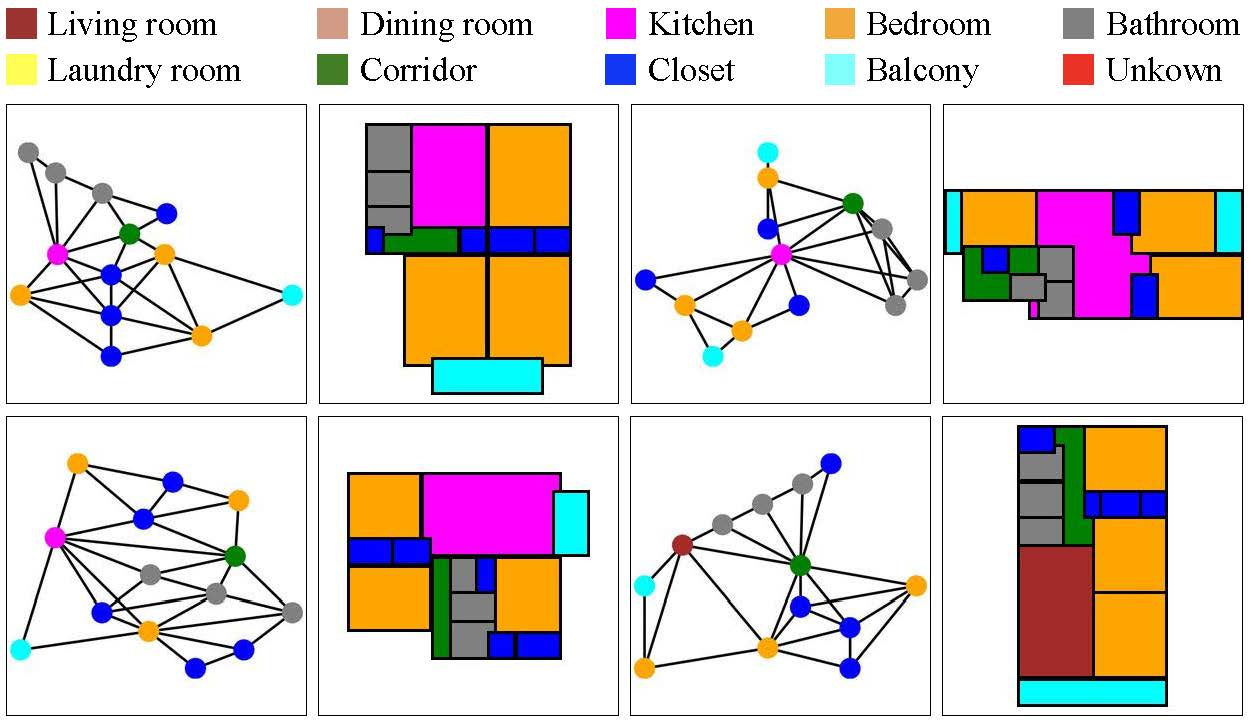
Park, H., Suh, H., Kim, J., & Choo, S. (2023). Floor plan recommendation system using graph neural network with spatial relationship dataset. Journal of Building Engineering, 71, 106378.
Transforming Building Plans into Graph Structures 5/5
Conclusionlink copied
You have a lot of possibilities of transforming building plans into graphs. Now you can proceed on analysing them with powerful tools of graph/network analysis.
Write your feedback.
Write your feedback on "Transforming Building Plans into Graph Structures"".
If you're providing a specific feedback to a part of the chapter, mention which part (text, image, or video) that you have specific feedback for."Thank your for your feedback.
Your feedback has been submitted successfully and is now awaiting review. We appreciate your input and will ensure it aligns with our guidelines before it’s published.