Thesis: Visual Analytics for Generative Design Exploration – van Kastel
-
Intro
-
Technical Aspects
Information
| Primary software used | Python |
| Software version | 1.0 |
| Course | Computational Intelligence for Integrated Design |
| Primary subject | AI & ML |
| Secondary subject | Machine Learning |
| Level | Advanced |
| Last updated | November 27, 2024 |
| Keywords |
Responsible
| Teacher | |
| Faculty |
Thesis: Visual Analytics for Generative Design Exploration – van Kastel 0/1
Thesis: Visual Analytics for Generative Design Exploration – van Kastel
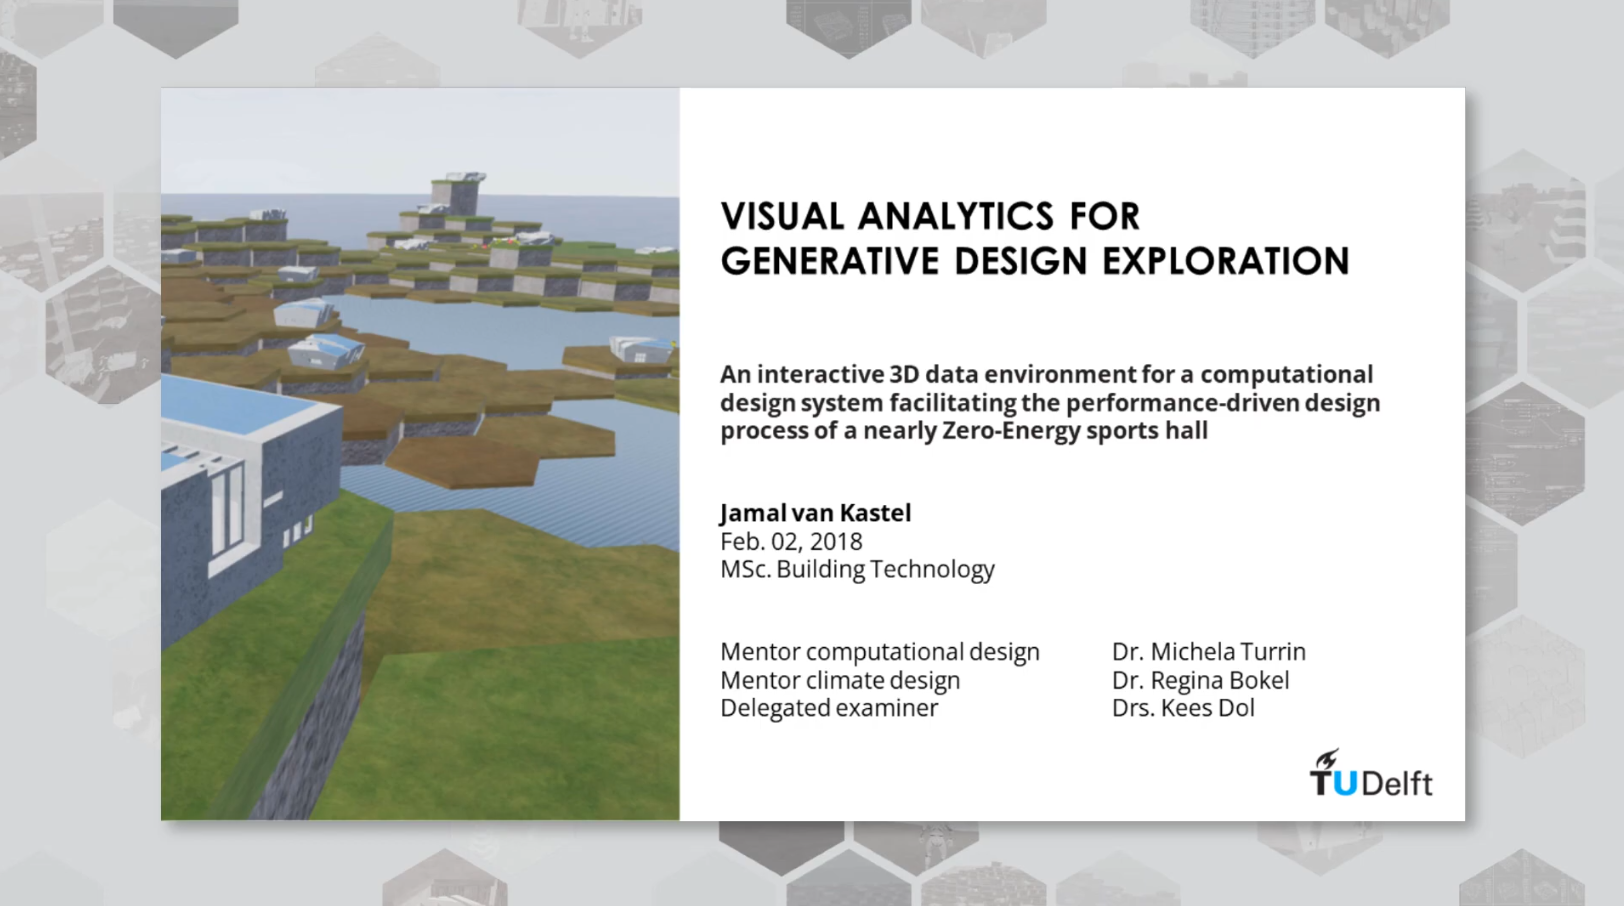
Visual Analytics for Generative Design Exploration: An interactive 3D data environment for a computational design system facilitating the performance-driven design process of a nearly Zero-Energy sports hall – Jamal van Kastel
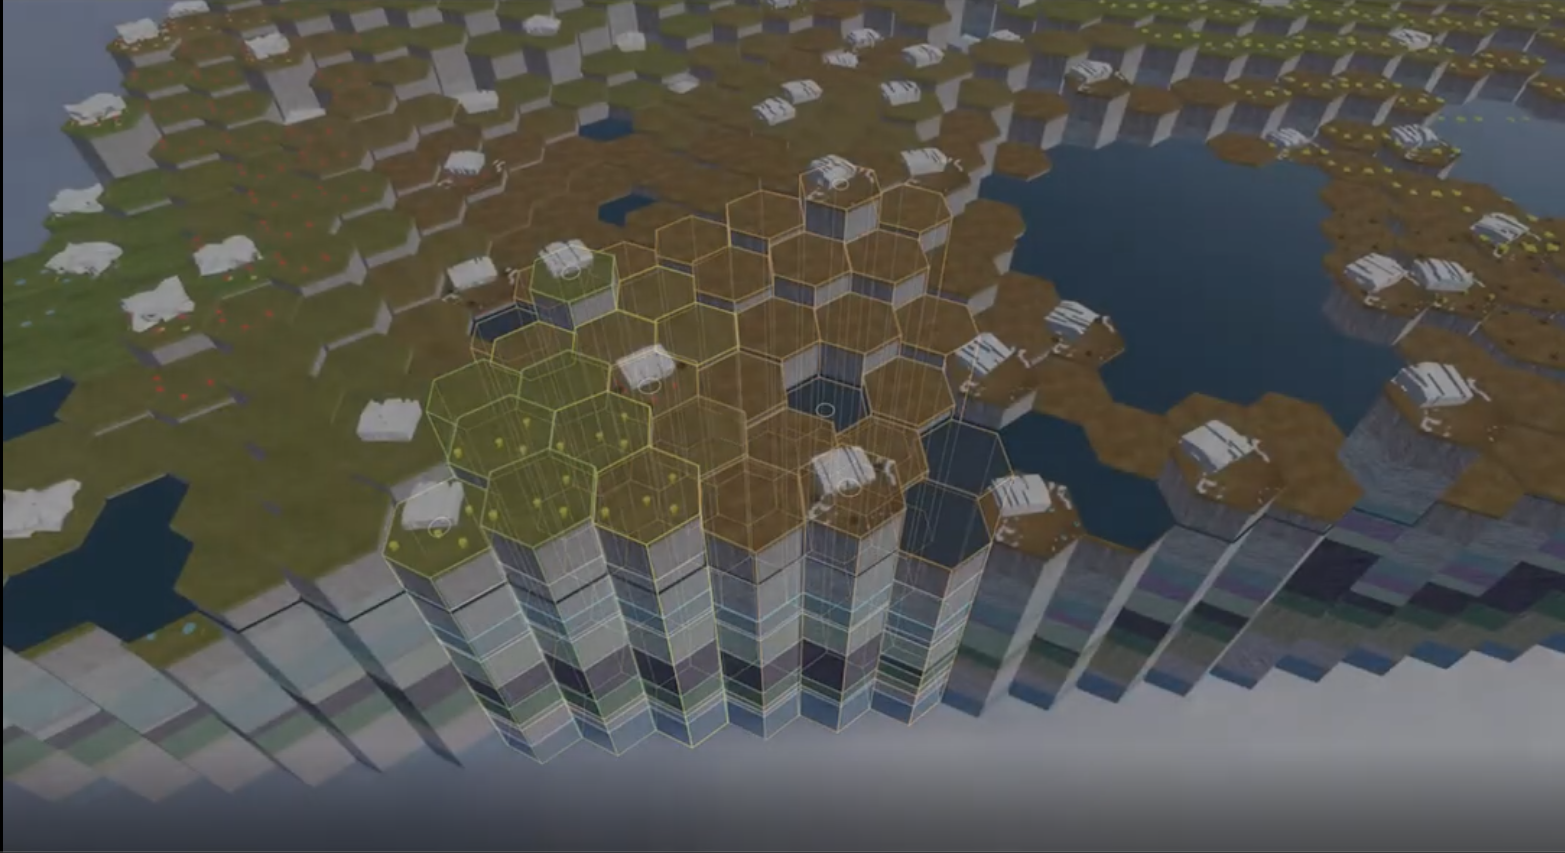
This thesis’ main contribution is a visual analytics tool that allows for the visualization of data and design geometries in a highly dynamic, game-like 3D data environment, allowing for the exploration of both quantified and non-quantified performances of a collection of design options.
This thesis’ Computational Design System aids in the design of a nearly Zero-Energy sports hall for a sports facility in Overhoeks, Amsterdam.
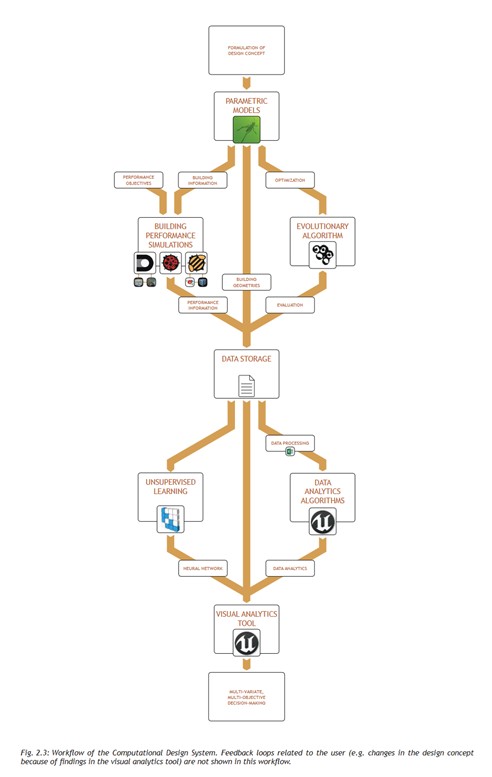
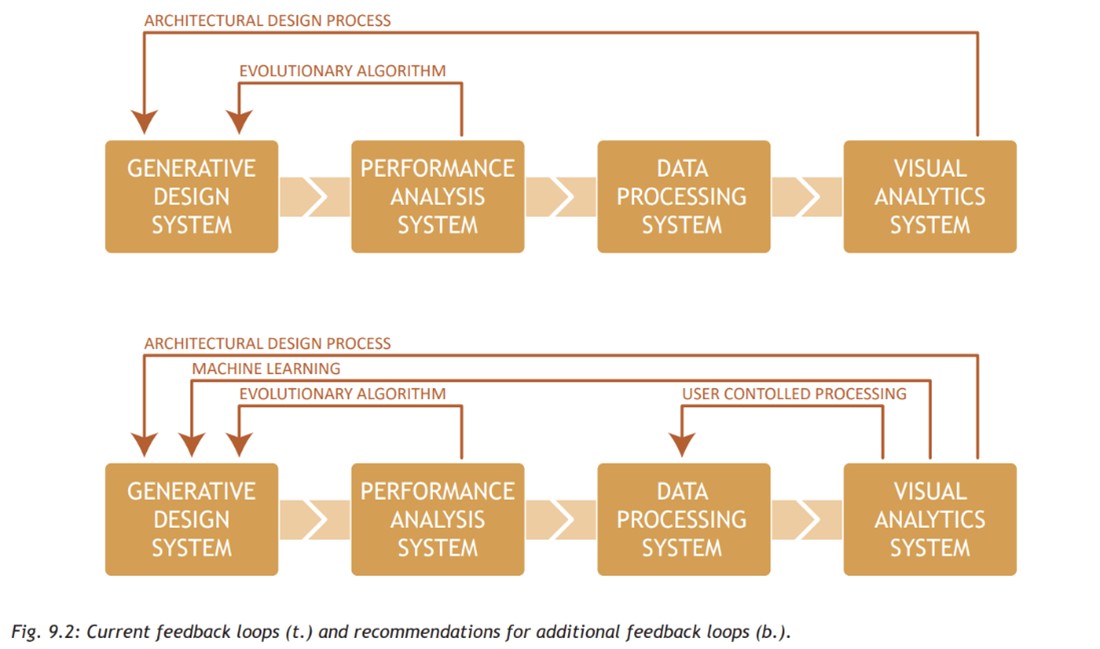
The Computational Design System (CDS) consists of two different parts of a workflow, each addressing specific steps. The first half of the workflow is used to generate a dataset of design options. The latter half is used to evaluate this dataset.
APA: van Kastel, J.. (2018). Visual Analytics for Generative Design Exploration [Master thesis, TU Delft]. https://repository.tudelft.nl/islandora/object/uuid%3Aad6f454b-0e67-4664-88d4-87d2132a1f71?collection=education
Here you can find the repository of the master thesis Visual Analytics for Generative Design Exploration – van Kastel
Project Information
- Title: Visual Analytics for Generative Design Exploration
- Author(s): Jamal van Kastel
- Year: 2018
- Link: https://repository.tudelft.nl/islandora/object/uuid%3Aad6f454b-0e67-4664-88d4-87d2132a1f71?collection=education
- Project type: Master thesis, Building Technology
- ML Tags: Decision Trees, Clustering, Self-Organizing Maps
- Topic tags: Generative Design, analytic hierarchal process (AHP)
Thesis: Visual Analytics for Generative Design Exploration – van Kastel 1/1
Technical Aspectslink copied
Software & Plug-ins
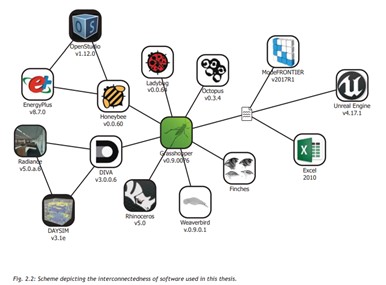
Rhinoceros and Grasshopper for generating building models which will be used for the performance simulations
Grasshopper plug-ins for building performance simulations:
- DIVA, Radiance, DAYSIM for illuminance
- Ladybug for PV energy values
- Honeybee, EnergyPlus, OpenStudio for operative temperatures
Octopus GH plug-in for multi-objective optimization with an evolutionary algorithm
ModeFRONTIER, a stand-alone design optimization software, for clustering data using a SOM
Microsoft Excel & Unreal Engine for processing building information
Unreal Engine for visual analytics
Summary
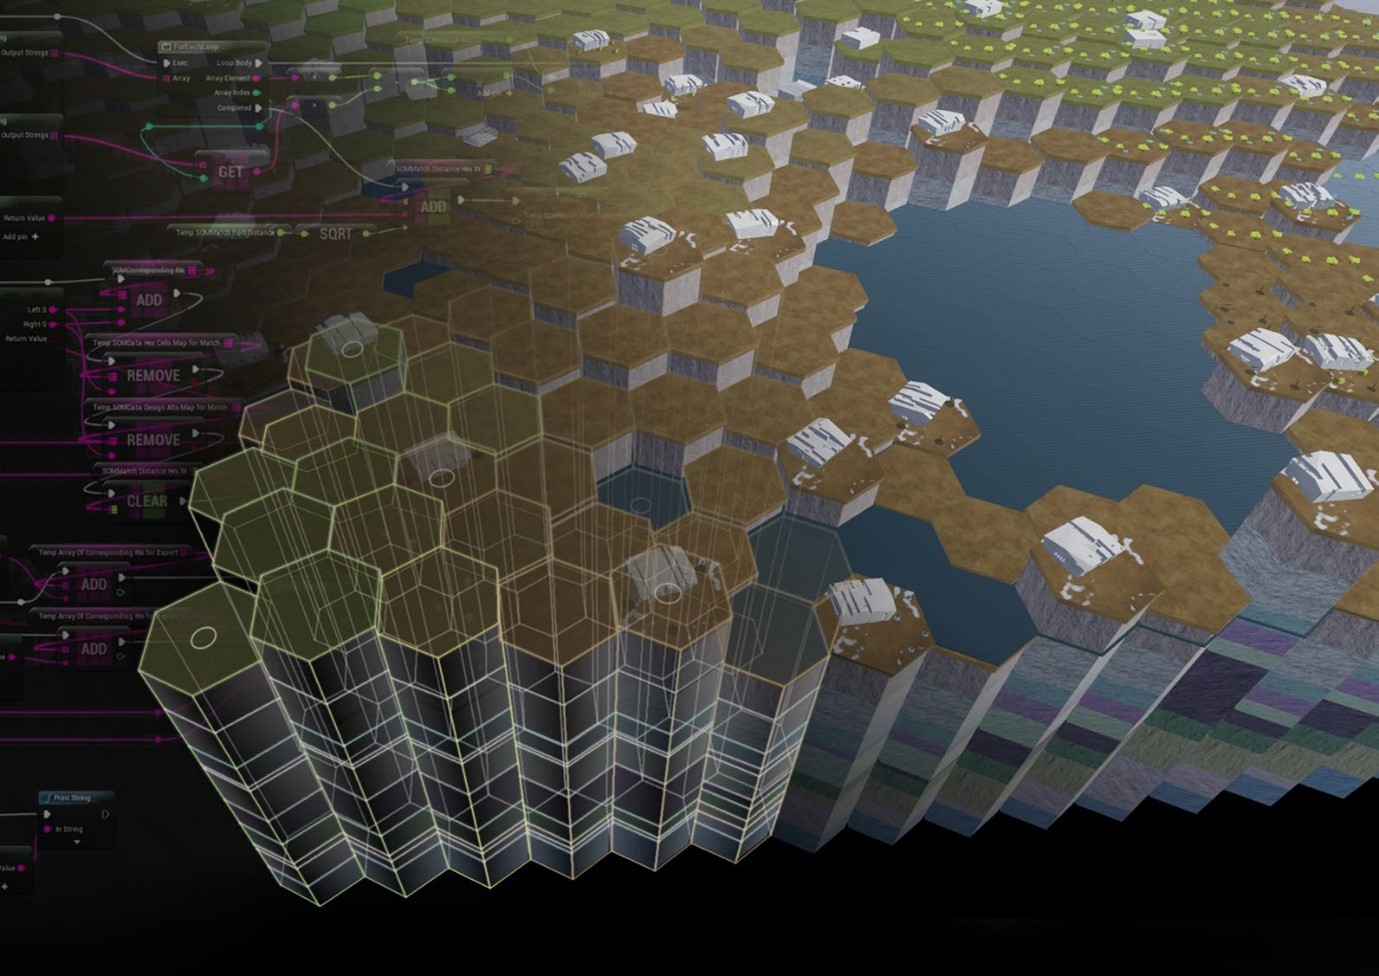
The Computational Design System (CDS) consists of two different parts of a workflow, each addressing specific steps. The first half of the workflow is used to generate a dataset of design options. The latter half is used to evaluate this dataset.
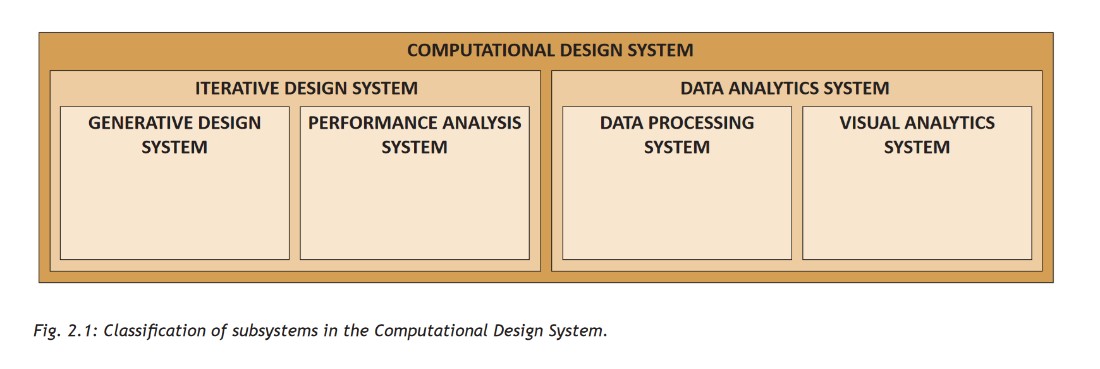
The Iterative Design System is used as follows:
- Design alternatives are generated using parametric models developed in Rhino & Grasshopper. Multiple Grasshopper scripts are used to generate design options that encompass multiple design concepts.
LIMITATIONS: generating random geometry does not necessarily result in a single optimal solution therefore optimizations are completed - Simulations are run on each model using Grasshopper plug-ins the results are used to further optimize energy, thermal & lighting performance of the different geometry
- Evolutionary solver Octopus is used to automatically generate design options, iteratively converging towards optimized design solutions.
Then the Data Analytics system is used as follows:
- The data is processed and clustered to aid the designer in decision making. Machine learning is used for some of the techniques. The data in processed in multiple different ways to provide different levels of information:
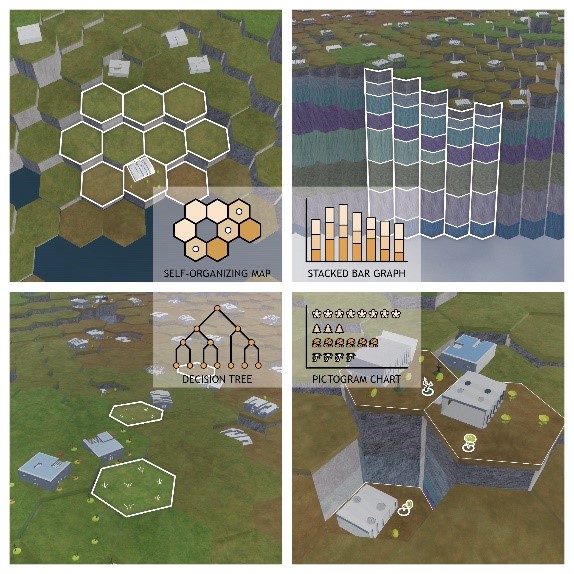
- Self Organizing Maps are used to reduce the dimensionality of the data, creating a two-dimensional representation of the high-dimensional design space. The Self-Organizing Map creates ‘soft clusters’ of similar design options and augments the dataset with approximations for non-simulated areas of the design space.
LIMITATIONS: not easy-to-read overview of the cells’ performance. - A decision tree is used to cluster the data based on the user-defined criteria
- Hierarchical clustering is used to cluster the data based on the user-defined criteria
- Annual Performance Data is visualized using a method best described as a combination of a stacked bar graph and an analytic hierarchal process, these are methods used to differentiate between non-empirical values of options
- Pictograms are used to visualize the designs with best or worst performances, this is to aid the designer in quickly identifying these characteristics
- A correlation matrix can be used to further indicate interrelationships between design aspects
- Self Organizing Maps are used to reduce the dimensionality of the data, creating a two-dimensional representation of the high-dimensional design space. The Self-Organizing Map creates ‘soft clusters’ of similar design options and augments the dataset with approximations for non-simulated areas of the design space.
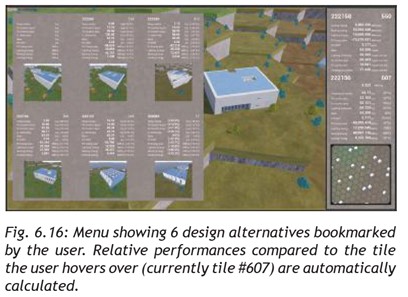
- The above noted different methods of clustering and visualizing the data are combined in the Unreal Engine to create a highly interactive environment for visual analytics. The visual analytics tool positions all buildings in a ‘data landscape’, a visual representation of the various data analytics techniques. Features of the landscape give insight in the buildings’ performances. By integrating multiple data analytics methods and facilitating access through game-like means of interactivity, users can intuitively explore the design space to make informed design decisions.
Workflow
Write your feedback.
Write your feedback on "Thesis: Visual Analytics for Generative Design Exploration – van Kastel"".
If you're providing a specific feedback to a part of the chapter, mention which part (text, image, or video) that you have specific feedback for."Thank your for your feedback.
Your feedback has been submitted successfully and is now awaiting review. We appreciate your input and will ensure it aligns with our guidelines before it’s published.
