QGIS – Raster data layers and tools
-
Intro
-
Adding layers
-
Resources for adding raster data
-
Resources for data tools
-
Resources for raster mosaics
-
Resources for raster-vector conversion
-
Useful links
Information
| Primary software used | QGIS |
| Software version | 1.0 |
| Course | QGIS – Raster data layers and tools |
| Primary subject | 3D Modelling |
| Secondary subject | Geospatial and Geographic Information Systems |
| Level | Intermediate |
| Last updated | November 11, 2024 |
| Keywords |
Responsible
| Faculty |
QGIS – Raster data layers and tools 0/6
QGIS – Raster data layers and tools
The following tutorials show some analyses and computations that can be done with raster data.
QGIS – Raster data layers and tools 1/6
Adding layerslink copied
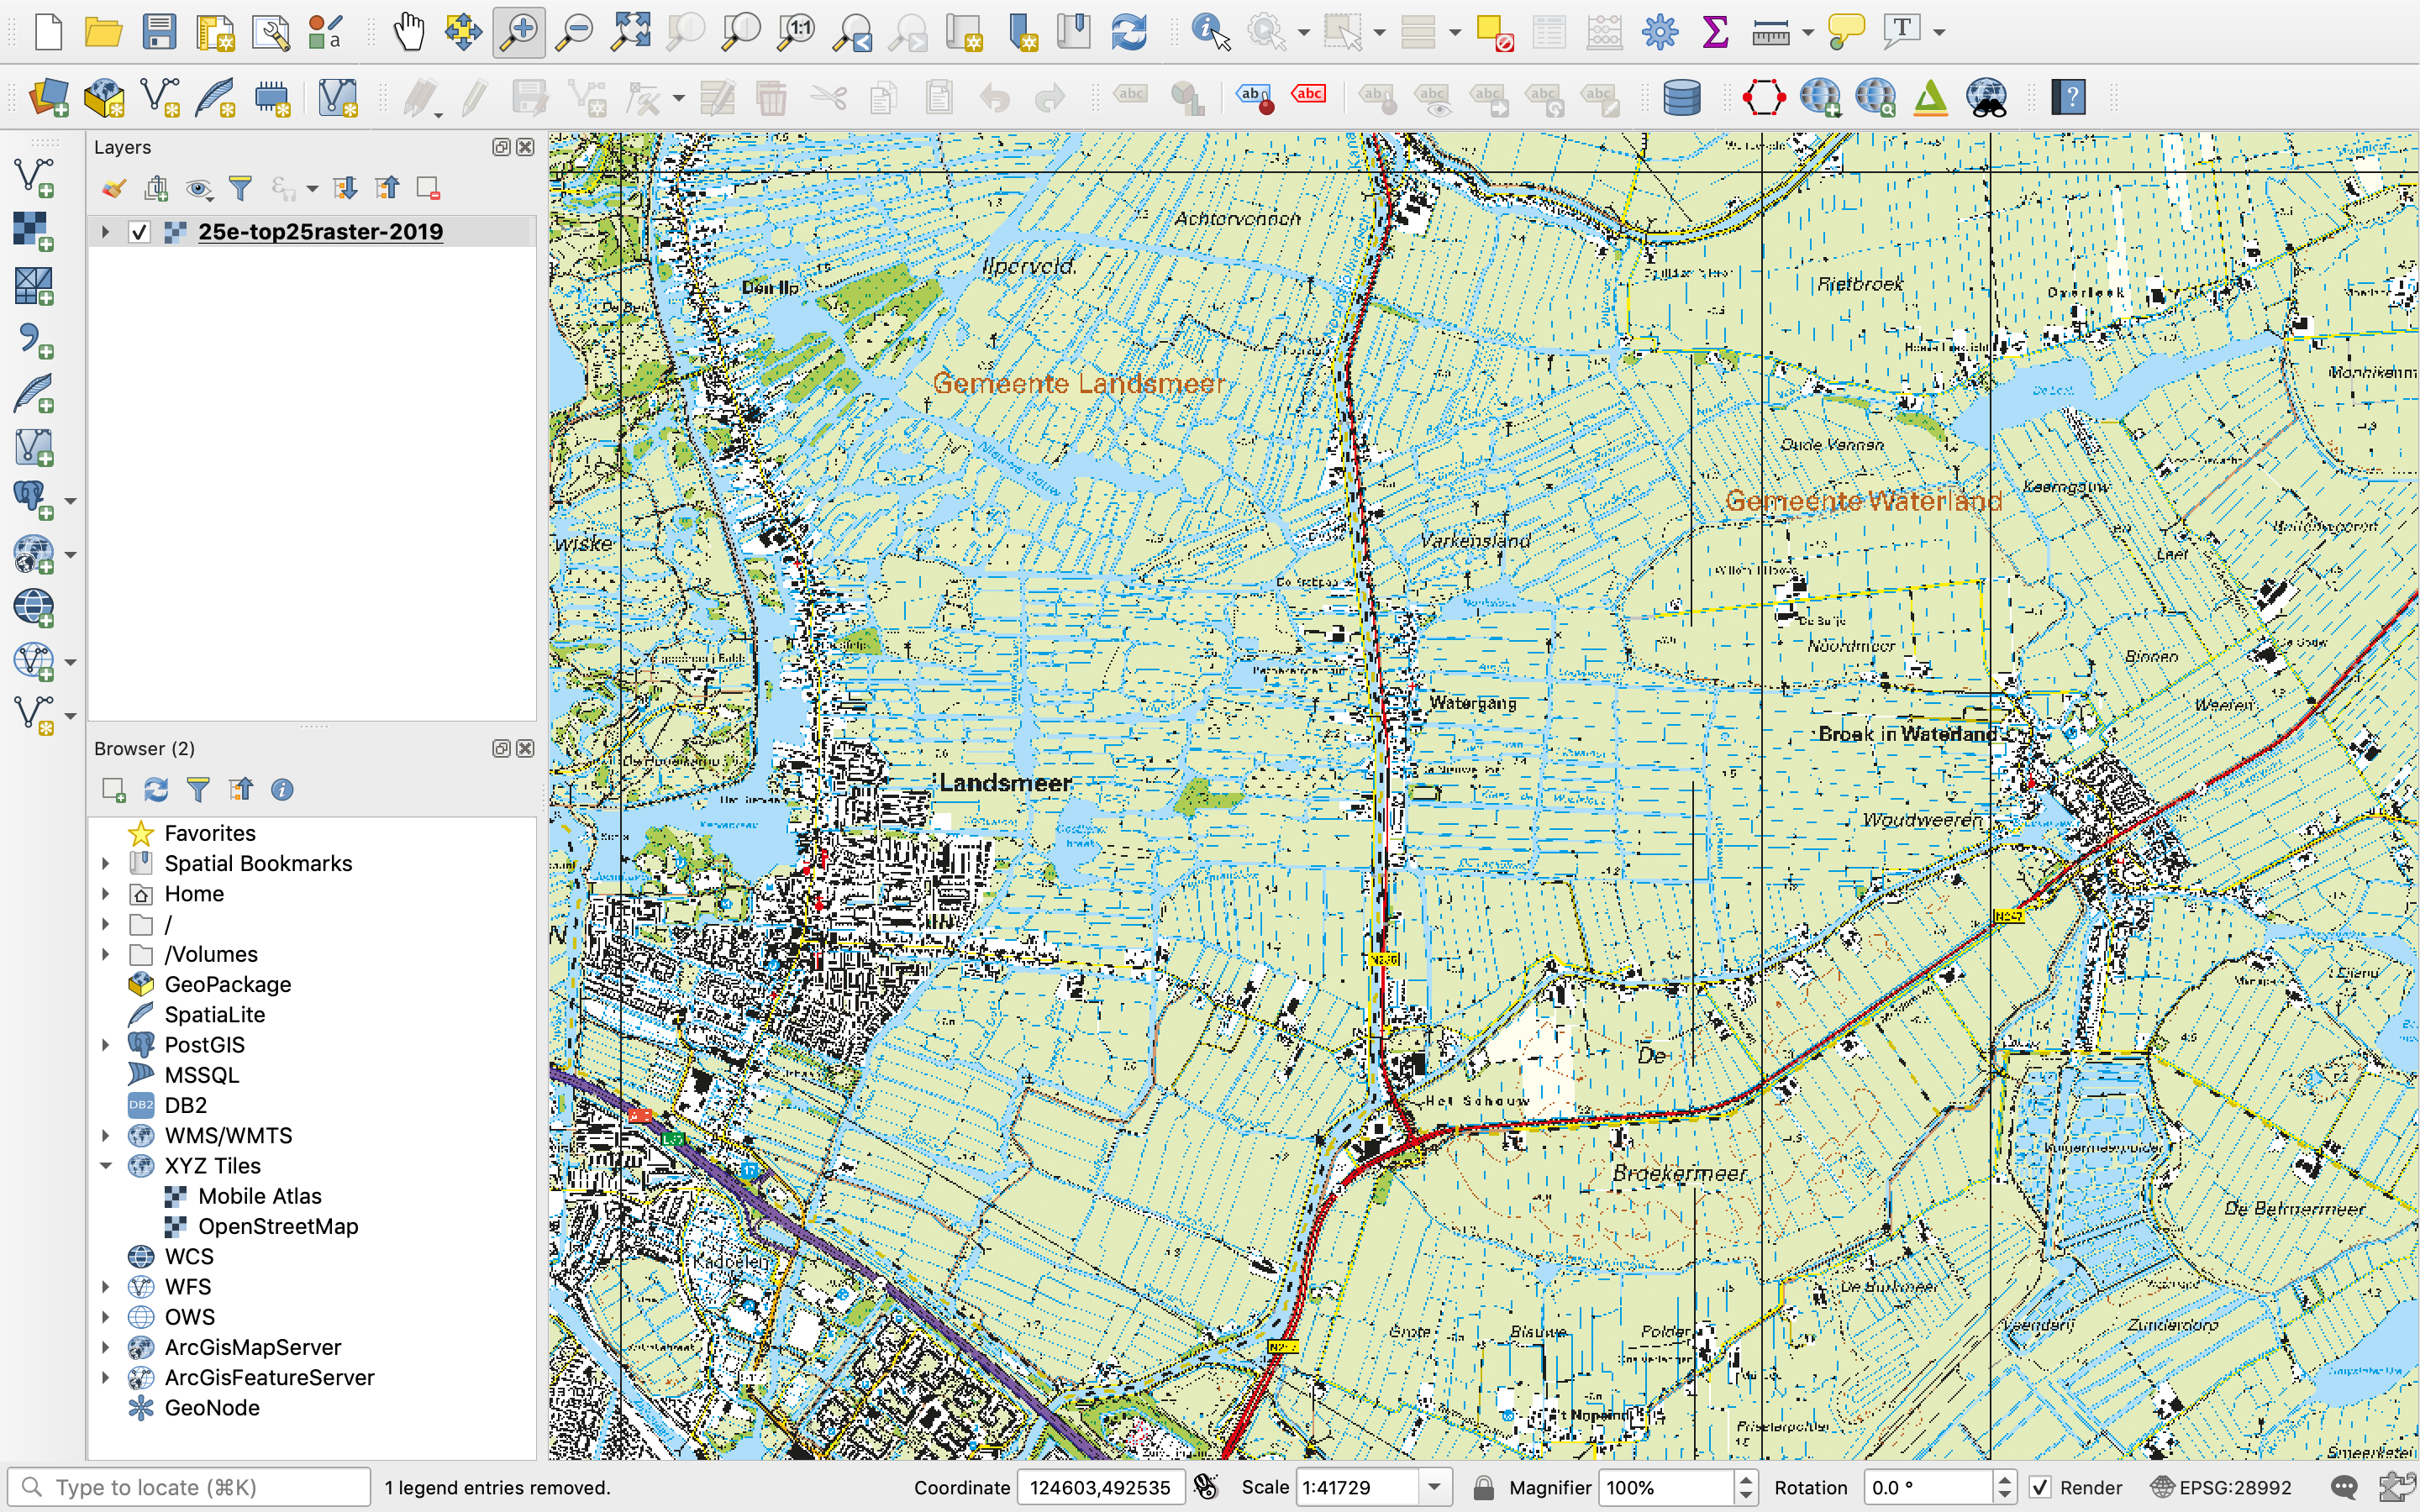
When you first open the QGIS interface, the map canvas will be empty. In order to view items on the map, you will need to add some layers to the project. This tutorial will explain the basics of adding vector and raster layers to the map.
Related tutorials:
Background
Vectors and rasters are the two main types of data supported by GIS (Geographic Information Systems). Vectors represent geospatial data as geometrical shapes. Vectors can either be polygons, lines or points. Rasters, on the other hand, are made up of pixels rather than discrete geometrical shapes and are basically any type of digital image. For example, digital aerial photographs, satellite imagery or scans of maps. The differences between the two data types mean that vectors are generally better for representing discrete features, while rasters are better for representing data that varies continuously such as elevation or chemical concentrations.
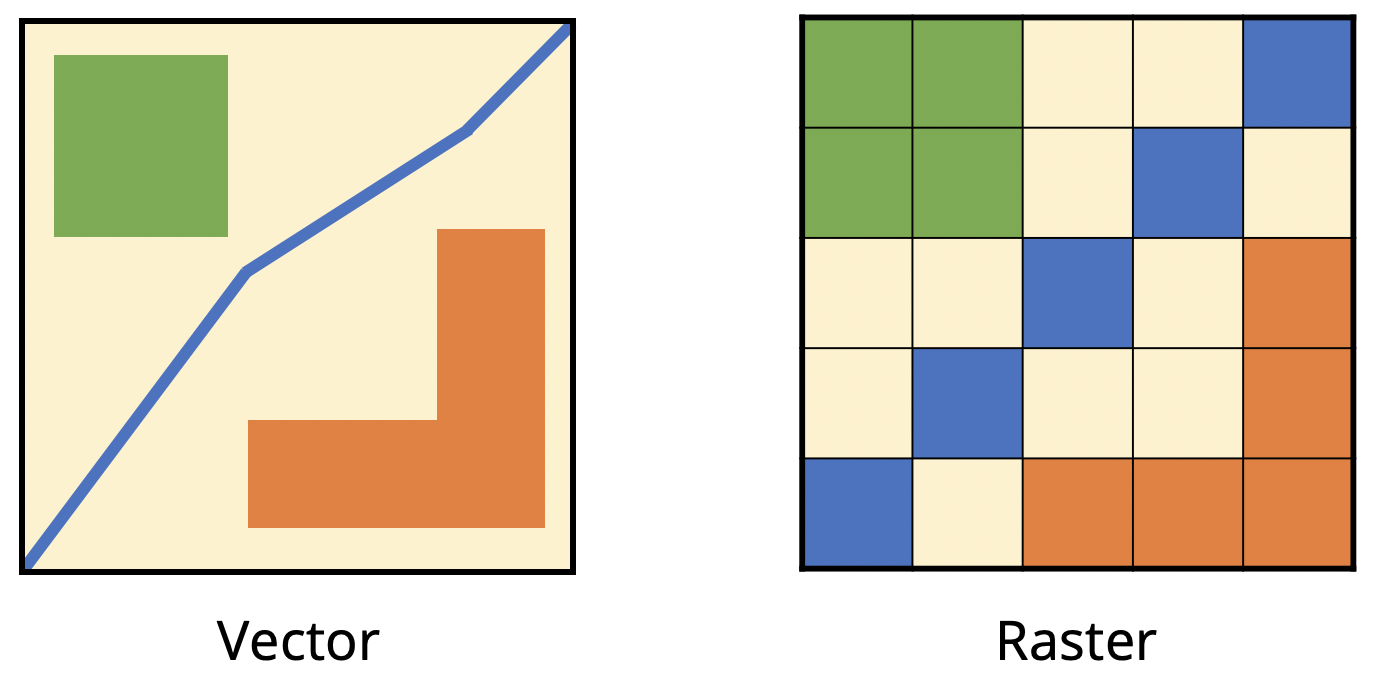
You can see whether layers in a project are vectors or rasters by looking at the symbol next to the layer’s name in the layer list on the left of the QGIS interface. Rasters are symbolised by a checkerboard pattern. Vectors are symbolised depending on their geometry type: polygon (square with solid fill), line or point.
Adding layers: drag and drop method
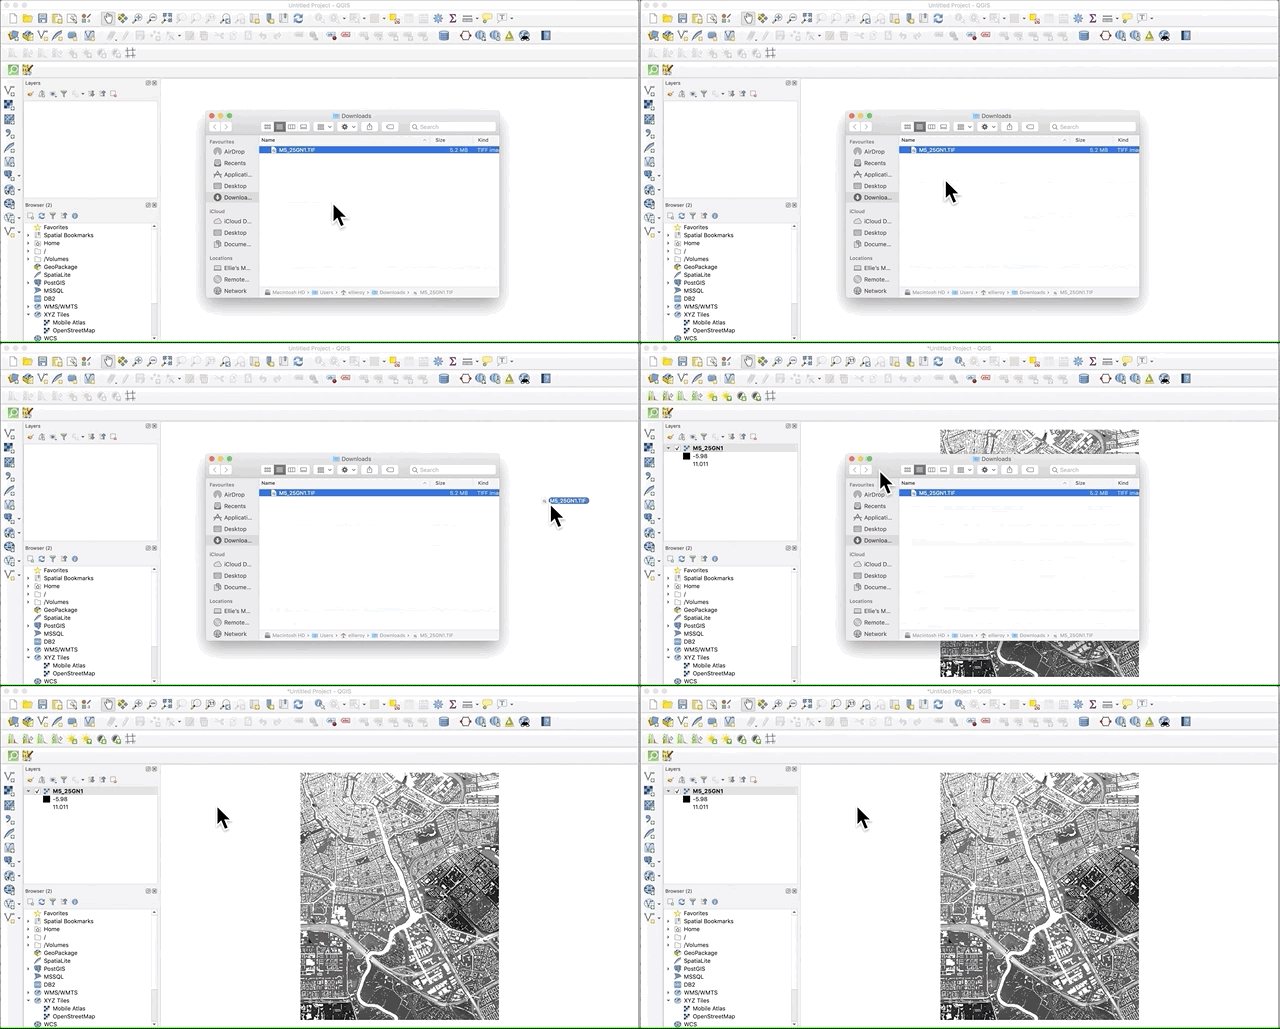
The quickest and easiest way to add any type of layer to QGIS is by simply dragging the file from its computer folder and dropping it onto the the QGIS interface.
The more “official” methods for adding vector and raster layers are explained in the following sections.
Adding raster layers
This part of the tutorial will show you how to add a raster layer to your project. The most common file formats for raster data are: GeoTIFF, JPEG, Esri ASCII. This example will show how to load a GeoTIFF file into QGIS, but the procedure is the same for any other raster file format.
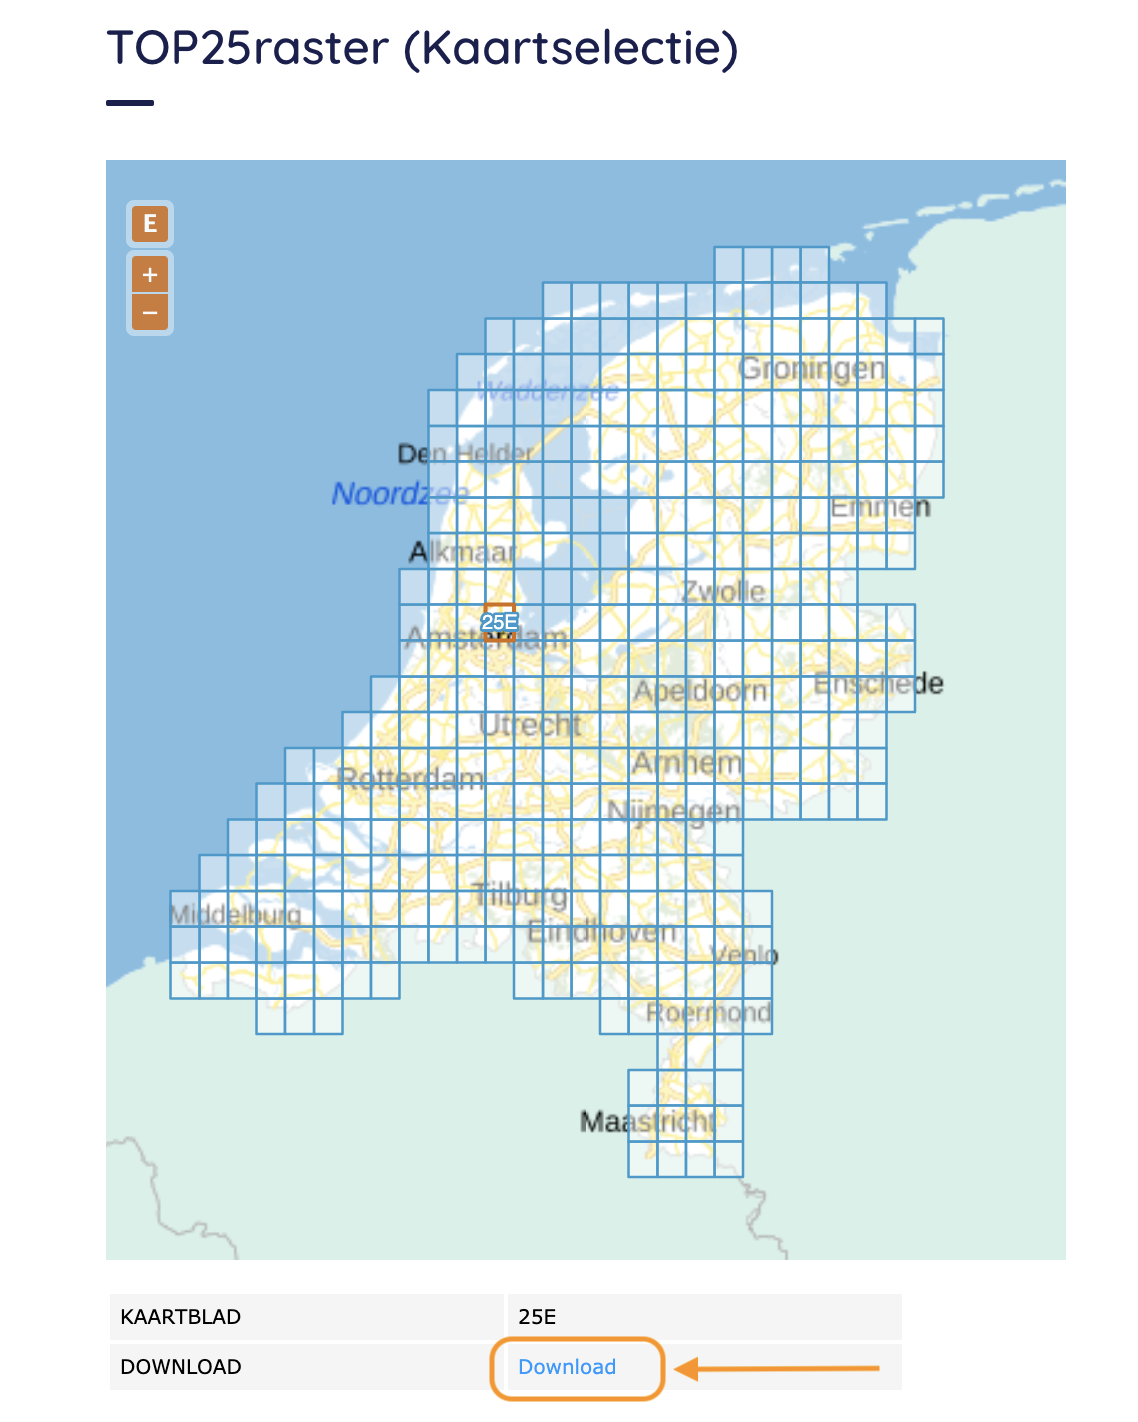
- Step 1: Obtain the data. In this example we will be loading a dataset from the PDOK website into QGIS. If you want to follow along, download the GeoTIFF file from this site by selecting a grid square on the map and clicking “download”.
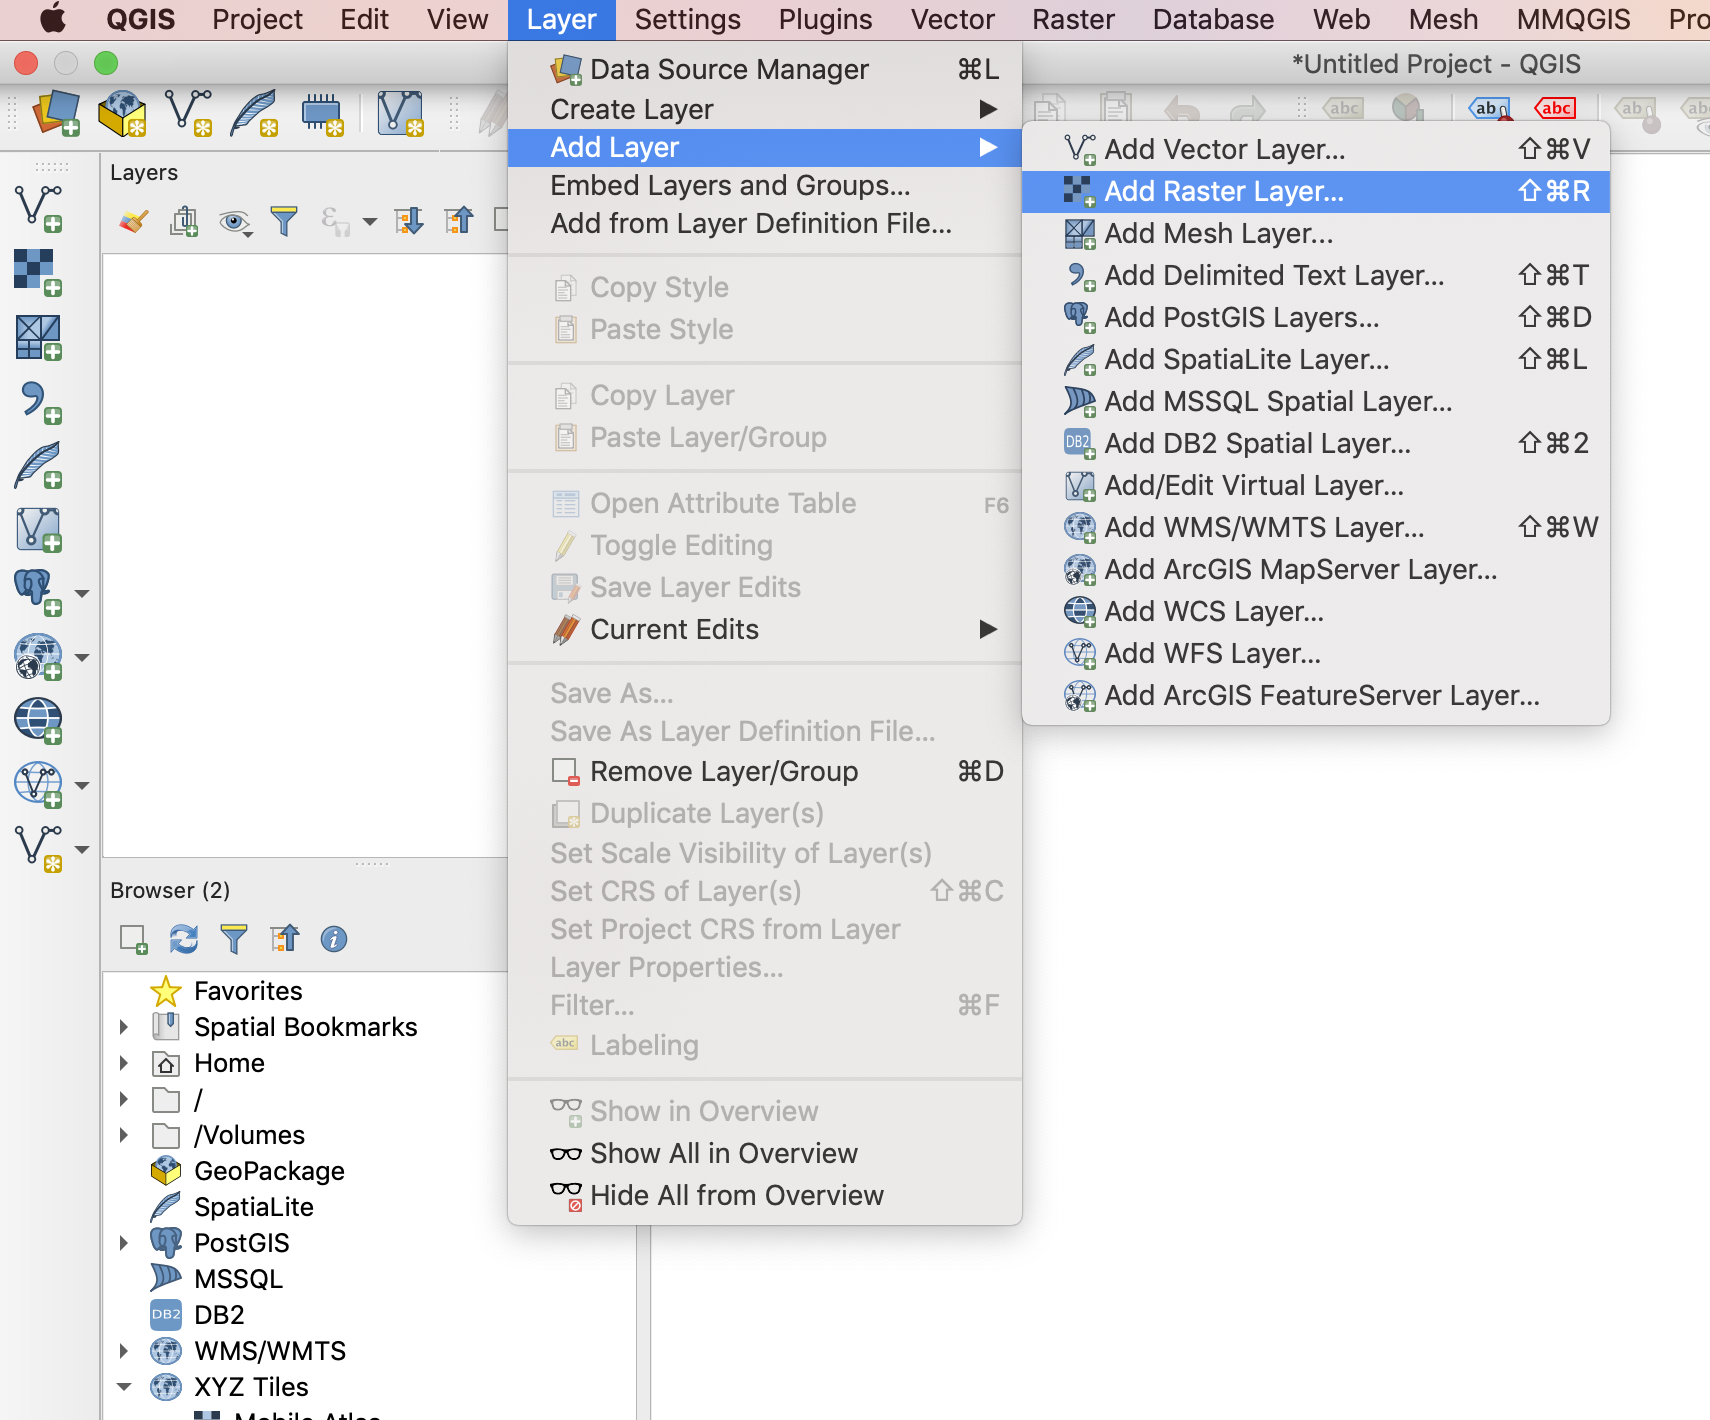
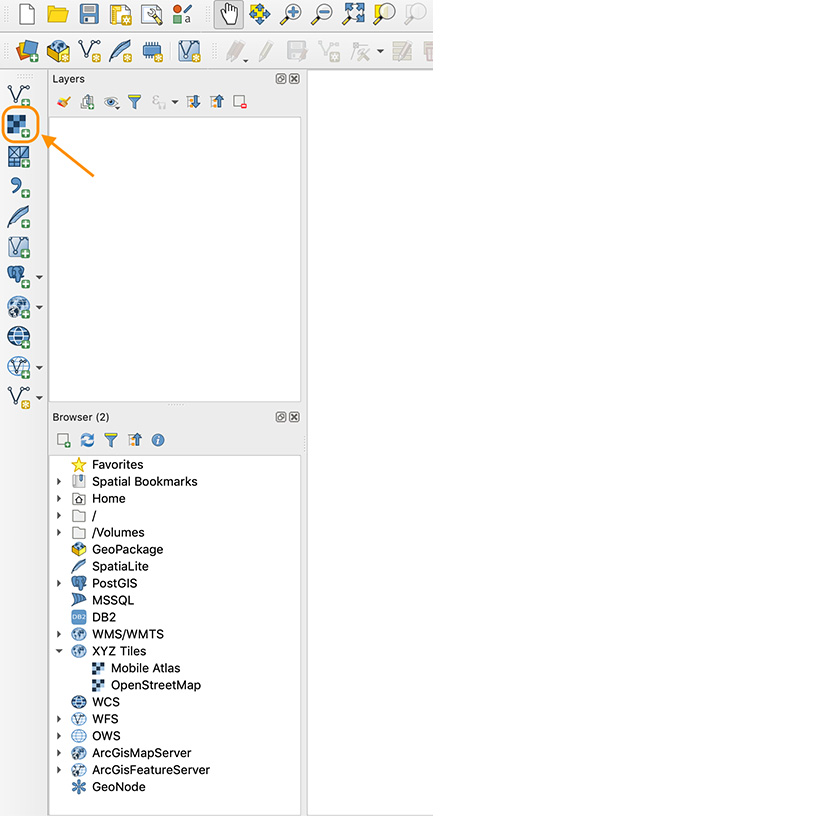
- Step 2: Open QGIS and navigate to Add raster layer…. Alternatively you can click on the “Add raster layer” button in the side toolbar.
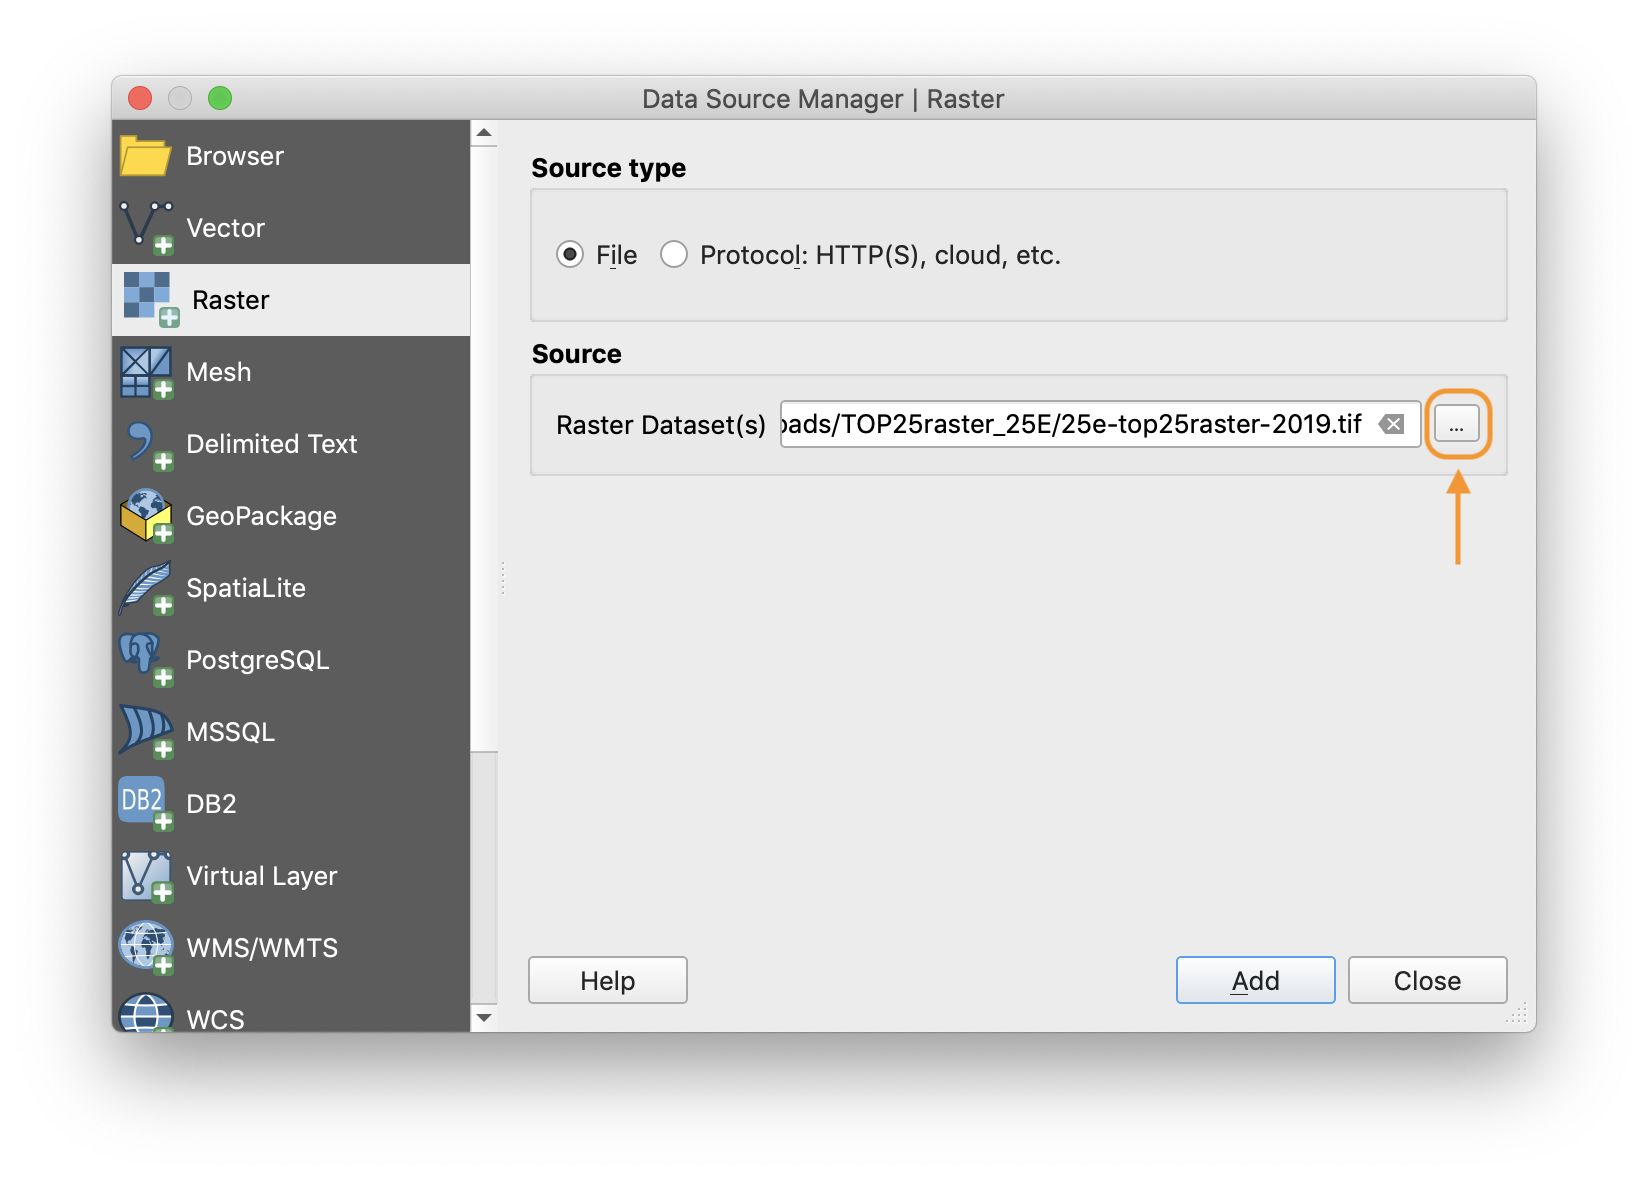
- Step 3: Choose the file path of the data you want to add to the project using the “browse” button.

- Step 4: Click “add” and you will see the layer added to the layers list and the data displayed in the map canvas.
Layer ordering
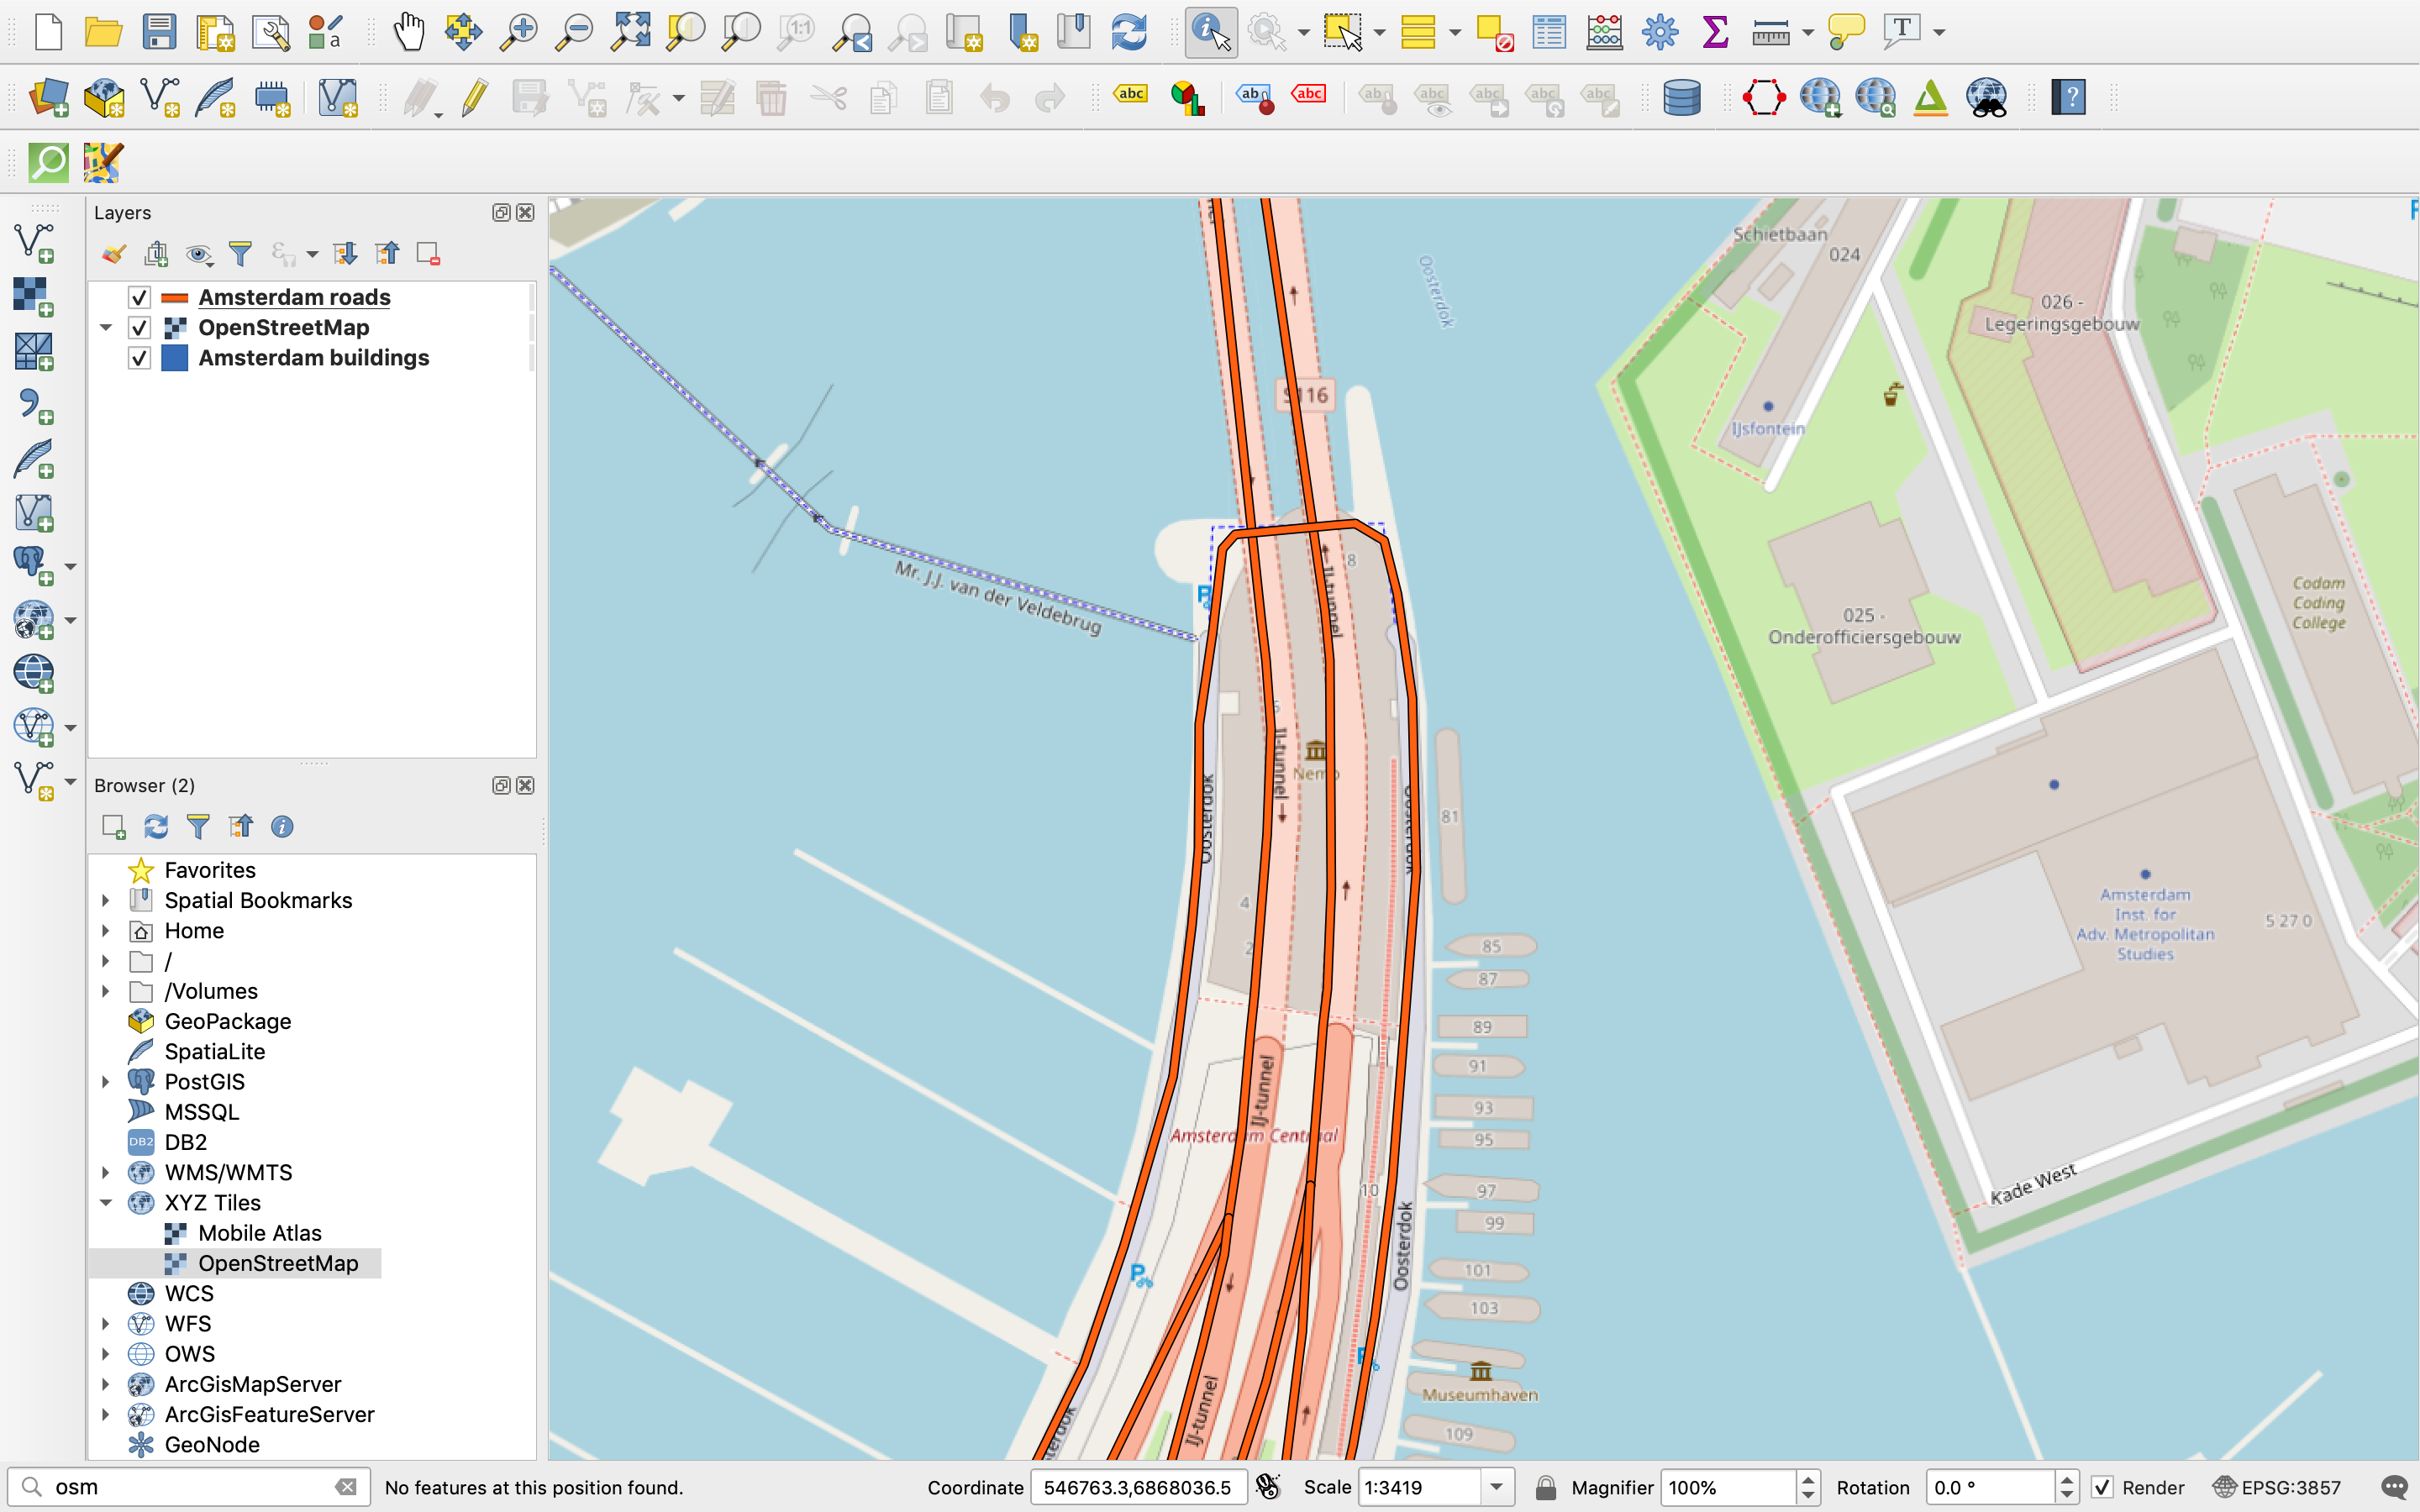
The order in which layers are shown in the layers list is the order in which they will be displayed on the map. In other words, layers higher in the list will be shown above layers lower in the list. Layers can be reordered by clicking and dragging them to the position you would like in the layers list panel.
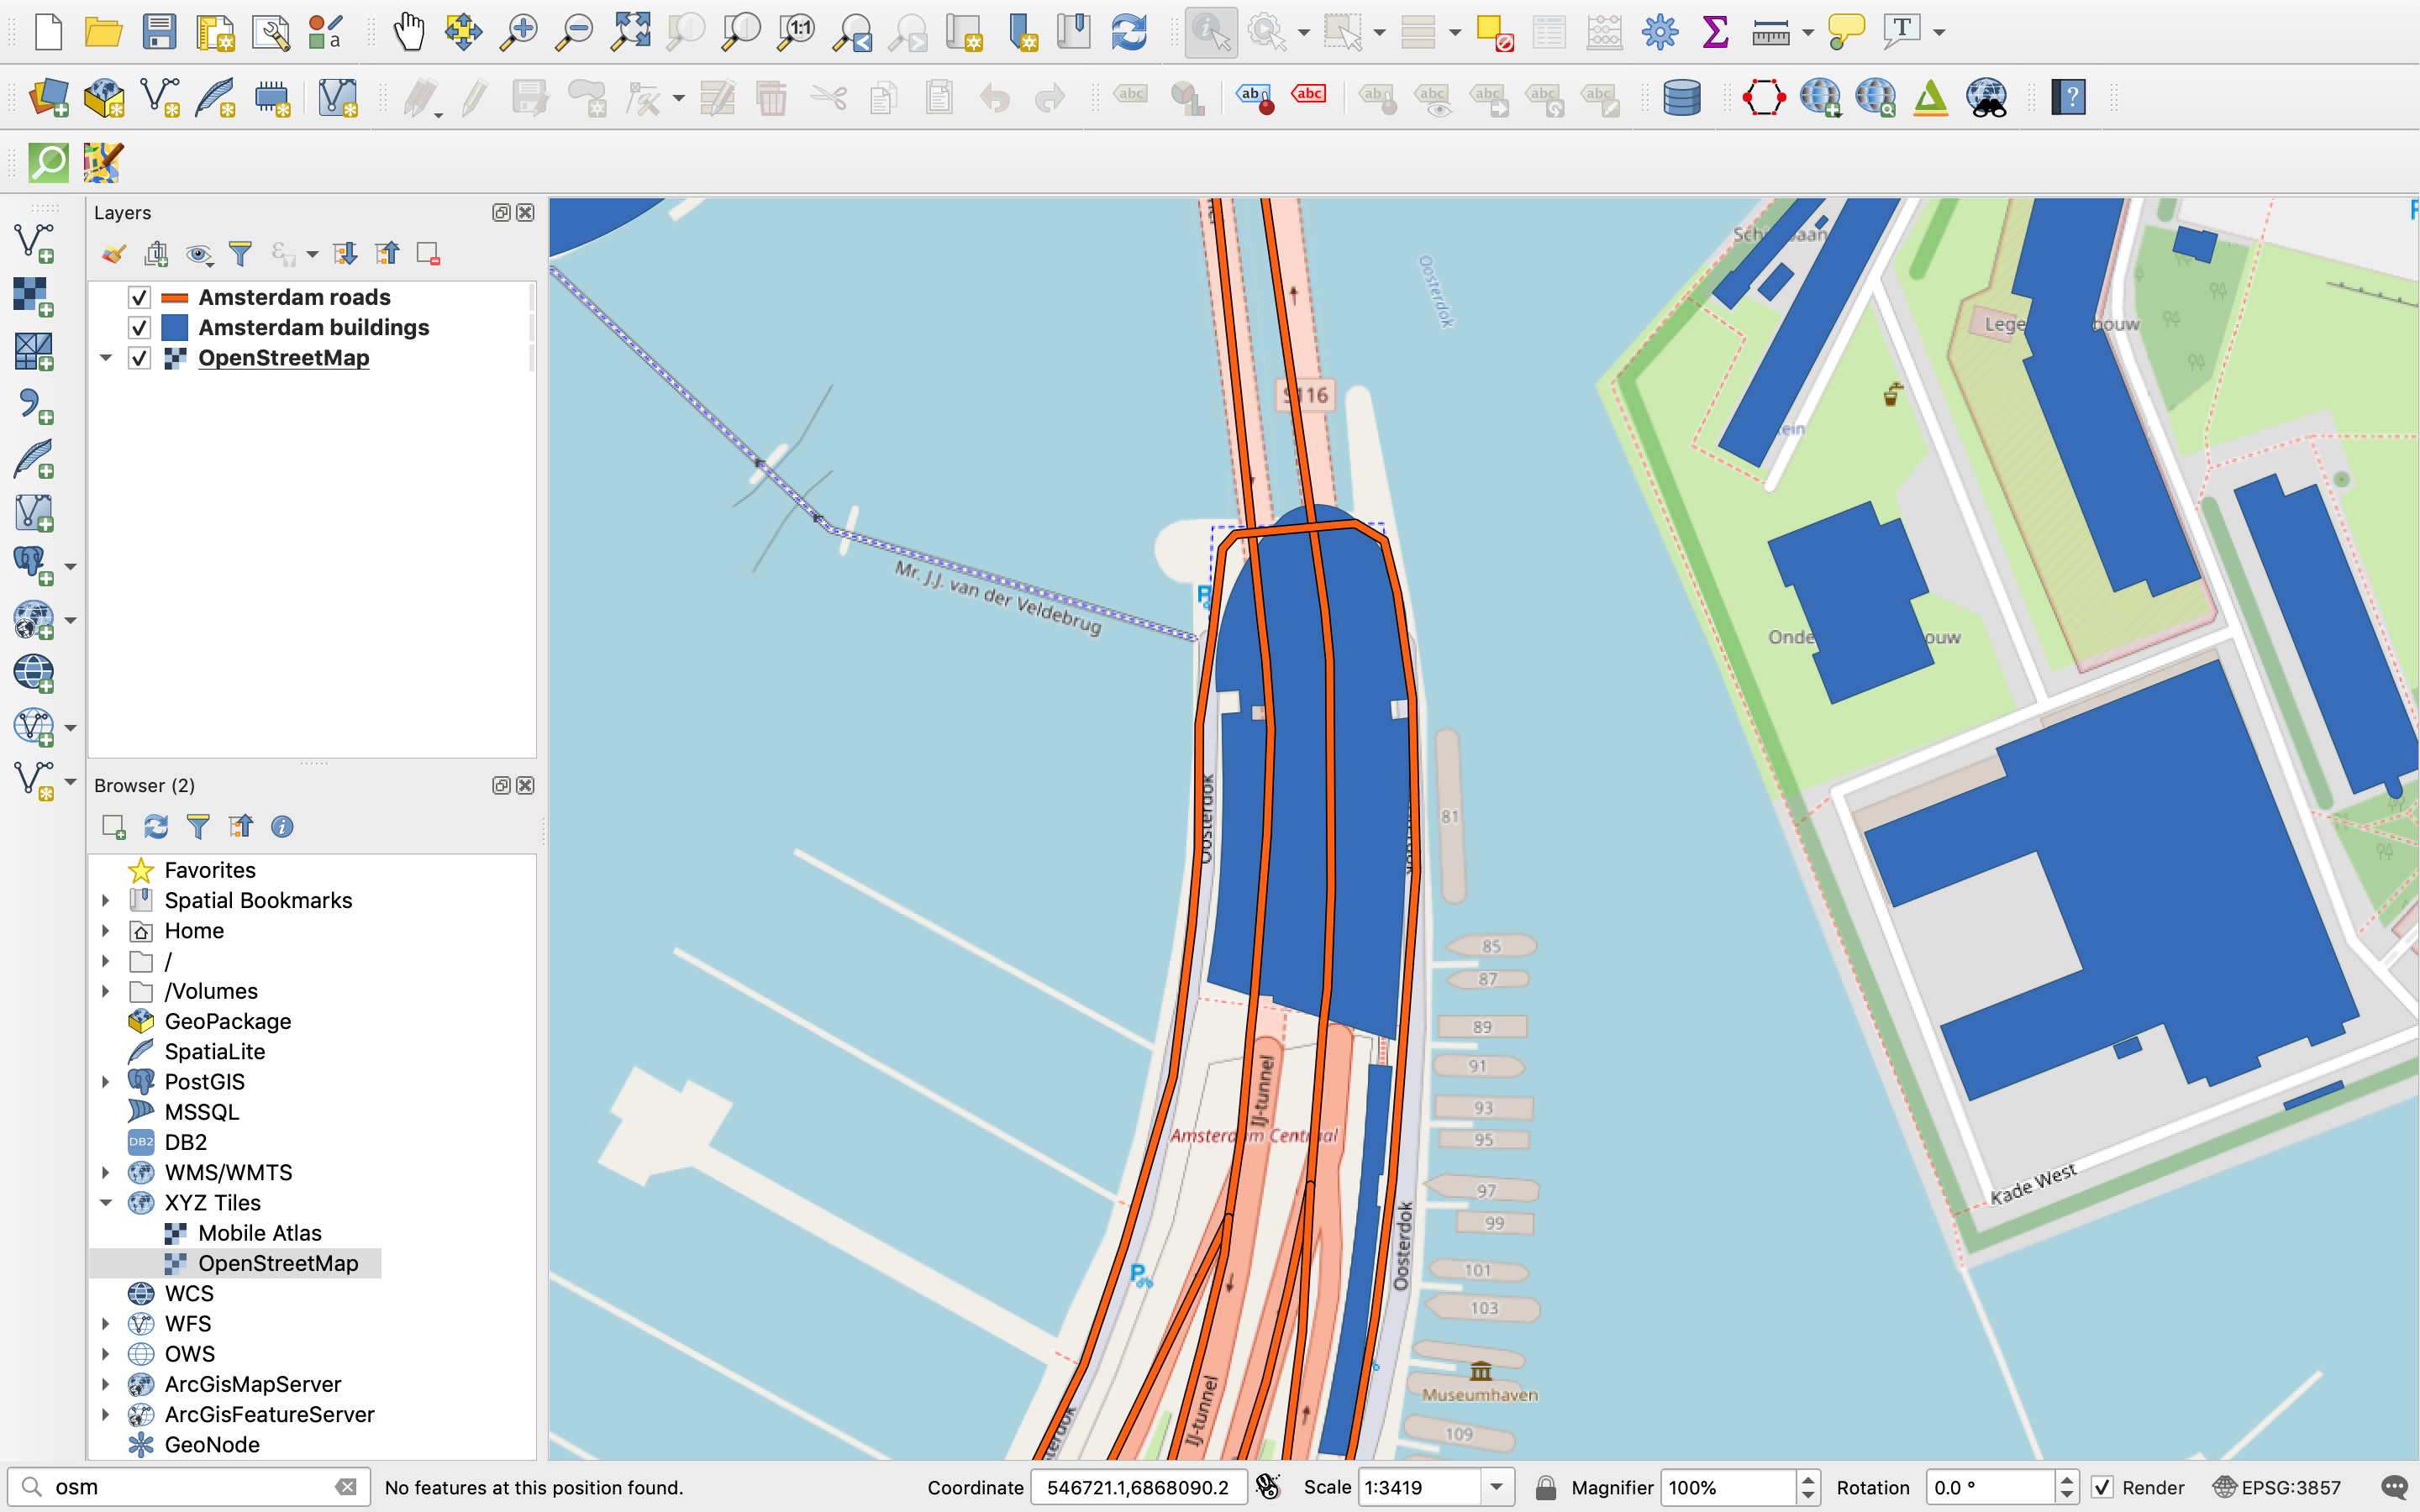
In the example below, there are three layers loaded into the project (two vector files “Amsterdam buildings” and “Amsterdam roads” and one raster file of OpenStreetMap). However, because OpenStreetMap is above the “Amsterdam buildings” layer in the layer list, the buildings layer is not visible on the map canvas. By reordering the layers so that OpenStreetMap is now at the bottom of the list, the buildings layer becomes visible on the map.
QGIS – Raster data layers and tools 2/6
Resources for adding raster datalink copied
Hillshade, slope and aspect calculations
Hillshades help to visualise the relief of a terrain by using light and shadows. The slope indicates the steepness of a terrain (in % or ° ) and the aspect specifies the orientation of the slope (in ° ).
Analyse a terrain by computing the hillshade, slope and aspect
- QGIS Training manual: “7.3. Terrain Analysis”
you can access this manual using this link
Language(s): EnglishChapters:
-
- follow along: calculating a hillshade
- follow along: using a hillshade as an overlay
- follow along: calculating the slope
- try yourself calculating the aspect
- follow along: calculating the aspect
- follow along: using the raster calculator
- try yourself more criteria
- follow along: combining raster analysis results
- follow along: simplifying the raster
- follow along: reclassifying the raster
- follow along: querying the raster
- in conclusion
- what’s next
Area calculation
The area of a surface can be calculated.
Area calculation per land cover class within the Kaziranga National Park
- Ujaval Gandhi: “Calculating Raster Area (QGIS3)”/”Rastergebied berekenen (QGIS3)”
you can access the English tutorial using this link
you can access the Dutch tutorial using this link
Language(s): English, DutchChapters:
-
- overview of the task
- get the data
- procedure
Area calculation per land cover class using the Corine land cover data of 2018
- Hans van der Kwast: “QGIS raster analysis tools for calculating class surface area”
you can access this video using this link
Language(s): English
Time: 4min 42sChapters:
-
- introduction (start-1:15)
- map canvas (1:15-2:22)
- unique values report (2:22-3:53)
- pie charts (3:53-end)
Proximity analysis
Proximity analysis uses distances between different features (in this case, raster cells) to analyse geographical data.
Find pixels within a defined maximum distance from source cells
- Hans van der Kwast: “Raster proximity analysis to determine the maximum distance to classes in QGIS”
you can access this video using this link
Language(s): English
Time: 3min 29s
Determine areas that are further than a specified distance from source cells
- Hans van der Kwast: “Raster proximity analysis to the minimum distance to classes in QGIS”
you can access this video using this link
Language(s): English
Time: 2min 15s
Multi criteria overlay analysis
Multi criteria overlay analyses help to identify the features that are the most suitable to a set of criteria (e.g. features close to water and shops, but far from highways).
Convert the vector data of Assam in India to raster data and identify the suitable areas for development
Zonal statistics
Zonal statistics refer to statistical calculations (such as mean, median, sum) for a specific group of raster cells.
Perform zonal statistics by using a polygon layer with zones
- Hans van der Kwast: “Zonal statistics in QGIS”
you can access this video using this link
Language(s): English
Time: 5min 38sChapters:
-
- introduction (start-0:30)
- zonal statistics tool (0:30-3:36)
- raster layer zonal statistics (3:36-end)
Boolean operators
Boolean operators are simple words that can be used to select a set of features. Some examples are AND, OR and NOT.
Use a Boolean operator (AND) in the QGIS Raster Calculator to perform map algebra
- Hans van der Kwast: “Map algebra with Boolean operator in the QGIS raster calculator”
you can access this video using this link
Language(s): English
Time: 1min 33s
Create a Boolean raster in the raster calculator using comparison operators
- Hans van der Kwast: “Create Boolean rasters with the raster calculator in QGIS”
you can access this video using this link
Language(s): English
Time: 2min 21s
Analysis tools from the Processing Toolbox
Raster analysis tools from the processing toolbox can also be used to perform spatial analyses.
Identify and extract informal settlements in the city of Johannesburg
- Ujaval Gandhi: “Advanced raster analysis (QGIS3)”/”Gevorderde rasteranalyses (QGIS3)”
you can access the English tutorial using this link
you can access the Dutch tutorial using this link
Language(s): English, DutchChapters:
-
- overview of the task
- get the data
- procedure
Spatial analysis by using the raster calculator from the processing toolbox and Graphical Model builder
- Hans van der Kwast: “QGIS Processing Toolbox Raster Calculator & Graphic Modeler”
you can access this video using this link
Language(s): English
Time: 12min 4sChapters:
-
- introduction (start-0:37)
- raster calculator (0:37-2:27)
- graphical modeler (2:27-9:48)
- running the model (9:48-end)
QGIS – Raster data layers and tools 3/6
Resources for data toolslink copied
The following tutorials addresses raster data. The first tutorial covers the basics of working with raster data. Then, a tutorial shows how to clip raster data. The last part covers how to add raster data to an attribute table.
Basics
Working with raster data
- QGIS Training manual: “7.1. Working with Raster Data”
you can access this manual using this link
Language(s): English
Chapters:- follow along: loading raster data
- follow along: create a virtual raster
- transforming raster data
- merging rasters
- in conclusion
- what’s next
Clip raster
A part of a raster can be extracted. The following tutorial shows how to clip rasters.
Clip a raster using a mask polygon layer
-
Hans van der Kwast: “Iteratively clip a raster with a polygon layer in QGIS”
you can access this video using this link
Language(s): English
Time: 4min 52s
Chapters:- introduction (start-0:28)
- clip raster by mask layer (0:28-1:24)
- create a new model (1:24-end)
Attribute tables
Attribute tables contain information on the features of a given layer. The following tutorial explains how to add one for a raster layer.
Add raster attribute tables
- Hans van der Kwast: “Adding Raster Attribute Tables to Rasters in QGIS”
you can access this video using this link
Language(s): English
Time: 4min 32s
Chapters:- intro (start-0:06)
- raster attribute table (0:39-4:24)
- outro (4:24-end)
Reclassify thematic rasters with a lookup table
- Hans van der Kwast: “Reclassify Rasters by Table in QGIS”
you can access this video using this link
Language(s): English
Time: 2min
QGIS – Raster data layers and tools 4/6
Resources for raster mosaicslink copied
Raster mosaicking consists of creating raster images by assembling multiple raster images. The following tutorials explain how to do this in QGIS.
Mosaic a raster with the elevation values of Sri Lanka
- Ujaval Gandhi: “Raster Mosaicing and Clipping (QGIS3)”/”Mozaïeken en clippen (QGIS3)”
you can access the English tutorial using this link
you can access the Dutch tutorial using this link
Language(s): English, Dutch
Chapters:- overview of the task
- get the data
- procedure
Mosaic DEM tiles from Shuttle Radar Topography Mission (SRTM)
- Hans van der Kwast: “Mosaic DEM Tiles in QGIS by Creating a Virtual Raster”
you can access this video using this link
Language(s): English
Time: 1min 55s
Mosaic tiles with different UTM zones into one image using GDAL
- Hans van der Kwast: “Mosaic raster images with different UTM zones using QGIS and GDAL”
you can access this video using this link
Language(s): English
Time: 4min 21s
Mask border while mosaicking tiles using Merge and Build Virtual Raster
- Hans van der Kwast: “Mosaic raster seamlessly in QGIS if they have a border”
you can access this video using this link
Language(s): English
Time: 1min 19s
QGIS – Raster data layers and tools 5/6
Resources for raster-vector conversionlink copied
Raster data can be converted to vector data. Having the data in different formats can enlarge their applicability and allows to perform more analyses (raster and vector analyses).
Convert raster data to vector data
- QGIS training manual: “8.1. Raster to Vector Conversion”
you can access this manual using this link
Language(s): EnglishChapters:
- follow along: the raster to vector tool
- try yourself, follow along: the vector to raster tool
- in conclusion
- what’s next
QGIS – Raster data layers and tools 6/6
Useful linkslink copied
Linked tutorials
Follow-up tutorial
Write your feedback.
Write your feedback on "QGIS – Raster data layers and tools"".
If you're providing a specific feedback to a part of the chapter, mention which part (text, image, or video) that you have specific feedback for."Thank your for your feedback.
Your feedback has been submitted successfully and is now awaiting review. We appreciate your input and will ensure it aligns with our guidelines before it’s published.
