Paper: Zero energy potential of a high-rise office building – Giouri et al.
-
Intro
-
Review of Pareto Front
-
Design Problem Definition
-
Using a Pareto Front to Analyze Optimization Results
-
Conclusion
-
Useful Links
Information
| Primary software used | Grasshopper |
| Course | Paper: Zero energy potential of a high-rise office building – Giouri et al. |
| Primary subject | AI & ML |
| Secondary subject | Optimization |
| Level | Expert |
| Last updated | December 15, 2024 |
| Keywords |
Responsible
| Teachers | |
| Faculty |
Paper: Zero energy potential of a high-rise office building – Giouri et al. 0/5
Paper: Zero energy potential of a high-rise office building – Giouri et al.
Zero energy potential of a high-rise office building in a Mediterranean climate: Using multi-objective optimization to understand the impact of design decisions towards zero-energy high-rise buildings
Authors: Evangelia Despoina Giouri, Martin Tenpierik, Michela Turrin
The authors explored the use of multi-objective optimization to design nearly Zero Energy Buildings (ZEBs). The design options aimed to minimize energy demand while maximizing energy production and adaptive thermal comfort. Through this process, they aimed to identify which parameters have the highest impact and potential for optimization and to offer an alternative to stepped optimization strategies.
APA: Giouri, E. D., Tenpierik, M., Turrin, M. (2020). Zero energy potential of a high-rise office building in a Mediterranean climate: Using multi-objective optimization to understand the impact of design decisions towards zero-energy high-rise buildings. Energy and Buildings, Volume 209. https://pure.tudelft.nl/ws/portalfiles/portal/84484481/1_s2.0_S0378778818326343_main.pdf
Software & Plugins Used
- Design Builder
- Energy Plus through Rhino and Grasshopper
- Honeybee and Ladybug
- modeFRONTIER
Paper Information
- Paper Title: Zero energy potential of a high-rise office building in a Mediterranean climate: Using multi-objective optimization to understand the impact of design decisions towards zero-energy high-rise buildings
- Author(s): Evangelia Despoina Giouri, Martin Tenpierik, Michela Turrin
- Year: 2020
- Links: https://pure.tudelft.nl/ws/portalfiles/portal/84484481/1_s2.0_S0378778818326343_main.pdf
- https://www.sciencedirect.com/science/article/pii/S0378778818326343?via%3Dihub
- Type: Journal Paper
- Topic Tags: Multi-Objective Optimization, Zero Energy Building, High-Rise
Paper: Zero energy potential of a high-rise office building – Giouri et al. 1/5
Review of Pareto Frontlink copied
Remember that multi-objective optimization problems do not have a single optimal solution. There will always be a trade-off between the different objectives. One method of analyzing these solutions and their trade-offs is a Pareto Front Graph.
Remember that a Pareto Front represents the set of best solutions in the objective space. To compare the solutions, you can look at the shape of the front. The solutions at the endpoints tend to represent optimal solutions for the objective represented on that axis. The solutions that are in the middle of a curve or surface, tend to represent more balanced solutions.
The shape of the Pareto Front can also give you information on the relationships between the solution. The simplest shape a Pareto Front can have is a line or flat plane. A linear front demonstrates that the trade-offs between objectives is proportional and predictable. Losses in one objective correspond closely with improvements in another objective. A convex shape suggests that the objectives have a straightforward trade-off between them. An improvement in one objective results in a predictable, proportional deterioration in the other(s). A concave shape indicates a more complex trade-off. A small improvement in one objective may require a significant sacrifice in the other(s). This shape can also suggest that there are diminishing returns to improving one of the objectives as it quickly becomes costly for the other objectives. A discontinuous or fragmented front suggests that there are groups of solutions or may suggest that certain solutions are not viable. This fragmented front can also suggest that there are constraints or conflicting objectives that lead to some parameter values not being possible for an optimal solution.
Evangelia Despoina Giouri, Martin Tenpierik, and Michela Turrin used a Pareto Front graph in their research to compare the results of their multi-objective optimization problem.
Paper: Zero energy potential of a high-rise office building – Giouri et al. 2/5
Design Problem Definitionlink copied
Evangelia Despoina Giouri, Martin Tenpierik, and Michela Turrin discuss the following design problem. A case study building, the tower of Piraeus, is used for the optimization. The building is a high-rise office building and has an open floor plate with and internal core that contains the stairs, elevators, and restrooms. The building is located in the port of Piraeus in Athens, Greece.
Some additional information about the building include that it is a 22-story building with a height of 84 meters. The building has a structure made of steel reinforced concrete and a steel and glass façade.

The authors also noted the following building details which were entered in Design Builder. (See Table 1.)
|
Building parameter |
Unit |
Value |
|
Occupancy density |
persons/m² |
0,1 [18] |
|
Computers load |
W/m² |
15 [18] |
|
Heating set-point |
°C |
20 [18] |
|
Cooling set-point |
°C |
26 [18] |
|
Natural ventilation set-point |
°C |
24 |
|
Minimum fresh air |
m³/h/person |
30 [18] |
|
Air-tightness |
ac/h |
0,2 [18] |
|
External wall U-value |
W/m²K |
0,35 [18] |
|
External wall construction |
_ |
(out to in) 100 mm brick/79.5 mm extruded polystyrene/100 mm concrete/13 mm gypsum |
|
Roof U-value |
W/m²K |
0,25 [18] |
|
Roof construction |
_ |
10 mm asphalt/144.5 mm glass wool/200 mm air gap/13 mm plaster |
|
Floor construction |
_ |
100 mm cast concrete (dense) |
|
Ground floor U-value |
W/m²K |
0,25 [18] |
|
Internal partition U-value |
W/m²K |
1,923 |
|
Window-to-wall ratio |
% |
30 |
|
glazing type |
_ |
double glazing 6 mm/13 mm/6mm |
|
Glazing U-Value |
W/m²K |
1,499 [18] |
|
SHGC |
_ |
0,564 |
|
Normalized power density for artificial lighting |
W/m²−100lux |
3,2 [18] |
|
Heat recovery |
_ |
on |
|
HVAC system |
_ |
VAV/Water cooled chiller/full humidity control |
The design problem had three objectives, and two rounds of optimization were completed using two different sets of parameters.
Objectives:
- minimize energy demand
- maximize comfort
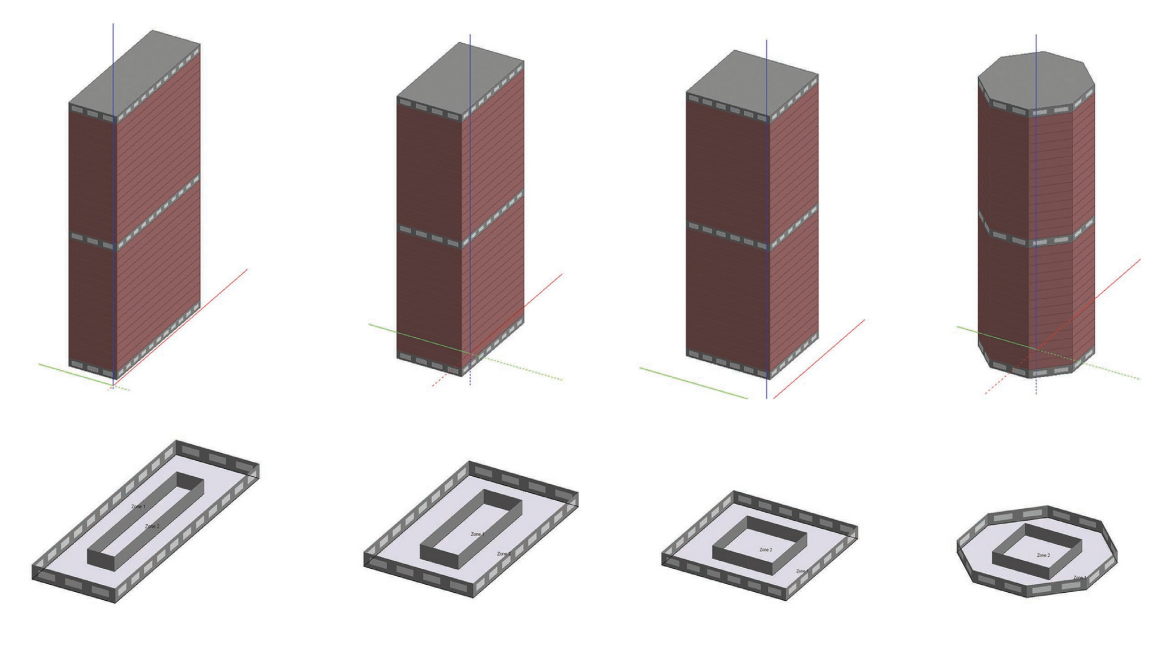
The goal of the first optimization was to understand which floor plan shape (long rectangle, short rectangle, square, and octogon) is best for performance and comfort.
The authors selected the following parameters for the 1st optimization:
- window-to-wall ratio
- wall U-value
- glazing construction U-value
- glazing g-value
- air-tightness of the facade
- cooling set-point of the mechanical cooling system
- PV facade surface area
The goal of the second optimization was to select a design from the first optimization and further explore the window to wall ratio and shaded area of the building. The authors selected the following parameters for the 2nd optimization:
- window-to-wall ratio
- shading area
- PV surface area
Each adapted for four facade orientations.
Paper: Zero energy potential of a high-rise office building – Giouri et al. 3/5
Using a Pareto Front to Analyze Optimization Resultslink copied
In the paper, the authors use scatter plots and on these plots identigy the pareto front. This allows them to analyze the impact of each parameter on the two objectives. In this example, we will further look at two of the graphs and discuss these in more detail.
Please note that since the authors were using modeFRONTIER, they were able to maximize some objectives while minimizing others. This is not possible in all optimization platforms. In Wallacei, for example, you must minimize all objectives. This means that the scatter plot you create with the results from Wallacei will always have a pareto front towards 0,0 or -∞, -∞ depending on your calculation. The scatter plots in this paper will have a Pareto front located toward +∞, 0. This will look different than plots you make using Wallacei. Remember that if you have objectives you are maximizing, you can simply minimize the inverse of your objective. The inverse of your objective is 1 divided by your objective.
Window to Wall Ratio (WWR) effect on Energy Demand and Comfort
The goal of the first optimization was to understand which floor plan shape (long rectangle, short rectangle, square, and octogon) is best for performance and comfort. The authors varied 7 parameters for the first optimization.
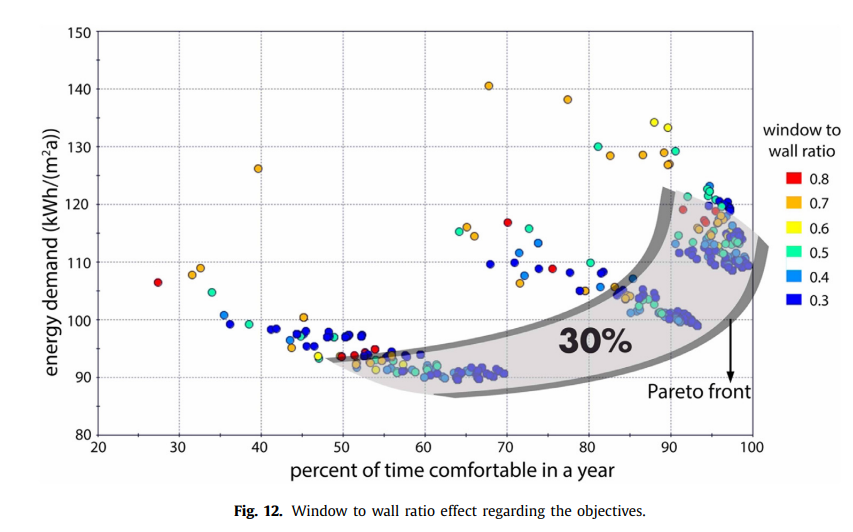
The authors tested 6 different window to wall ratios, from 30% to 80% at 10% incriments, and each are represented by a different color on the graph. The authors expected that a higher WWR would result in higher cooling loads but also reduced lighting loads.
Through the graph [Figure 12 in the paper], it is possible to see that smaller windows, a lower window to wall ratio, most succesfully optimizes both objectives. This can be seen by the fact that most of the dots in the region nearest the pareto front are of the teal to dark blue colors representing 50% for 30% WWR. The authors note that the reason this is the case is because smaller windows reducee solar heat gain and therefore reduce the cooling loads. Rememeber that the building is located in Athens, Greece, a cooling dominated climate.
When looking at the graph, it is also possible to see that despite lower WWR ratios being better for both objectives, the floor plan has a large impact on the performance. We can see that the results ended up in 3 distinct clusters representing different floor plan shapes.
By viewing the clusters as 3 distrinct building shapes, we can analyze which building form performs the best. The cluster in the lower left portion of the chart has a maximum comfort of 70% of the year and has an energy demand ranging from just under 90 kWH/m2a to almost 110 kWH/m2a. The middle cluster ranges in being comfortable between 65% and almost 95% of the year and has an energy demand ranging from just under 100 kWH/m2a to over 115 kWH/m2a. The third cluster in the upper right of the chart ranges in being comfortable between 80% and almost 100% of the year and has an energy demand ranging from just under 110 kWH/m2a to almost 135 kWH/m2a.
More improtantly, we can see that the WWR needs to be analyzed in more detail with a specific floor plan selected. The graph shows that choosing a 30% WWR gives varied results based on the building form. Additionally, for each cluster there are designs of most or all of the WWR values in the zone nearest to the pareto front. In the designs the authors analyzed, the energy demand when having a 30% WWR ranged from 90 up to120 kWH/m2a. The comfort when using a 30% WWR ranged from 35% to almost 100% of the time over the course of a year. This is why the authors did further analysis on this parameter in the second optimization.

Through this example, you were able to see how a scatter plot with a pareto front can be used to evaluate not only the whole building design, but also each façade of the building.
In the second optimization, the authors used input from the optimal design chosen in the previous optimization round. The authors identify a building in the middle cluster of buidlings to further optimize. This selection meant a trade off between the two parameters of energy demand and comfort. The parameters of the selected design were: wwr = 30%/ wall U- value = 0.1 W/m 2 K / glazing U-value = 1.8 W/m 2 K / glazing g- value = 0.3/ infiltration = 0.1 ach/ cooling setpoint = 26 °C.
Through their analysis, the authors had identified that the window to wall ratio and the solar control were the most important façade-related variables to consider. Therefore, they only adjusted 3 parameters in this iteration. These are the window-to-wall ratio, shading area, and the PV surface area. They reviewed the window to wall ratio of 4 different orientations, North, South, East, and West.
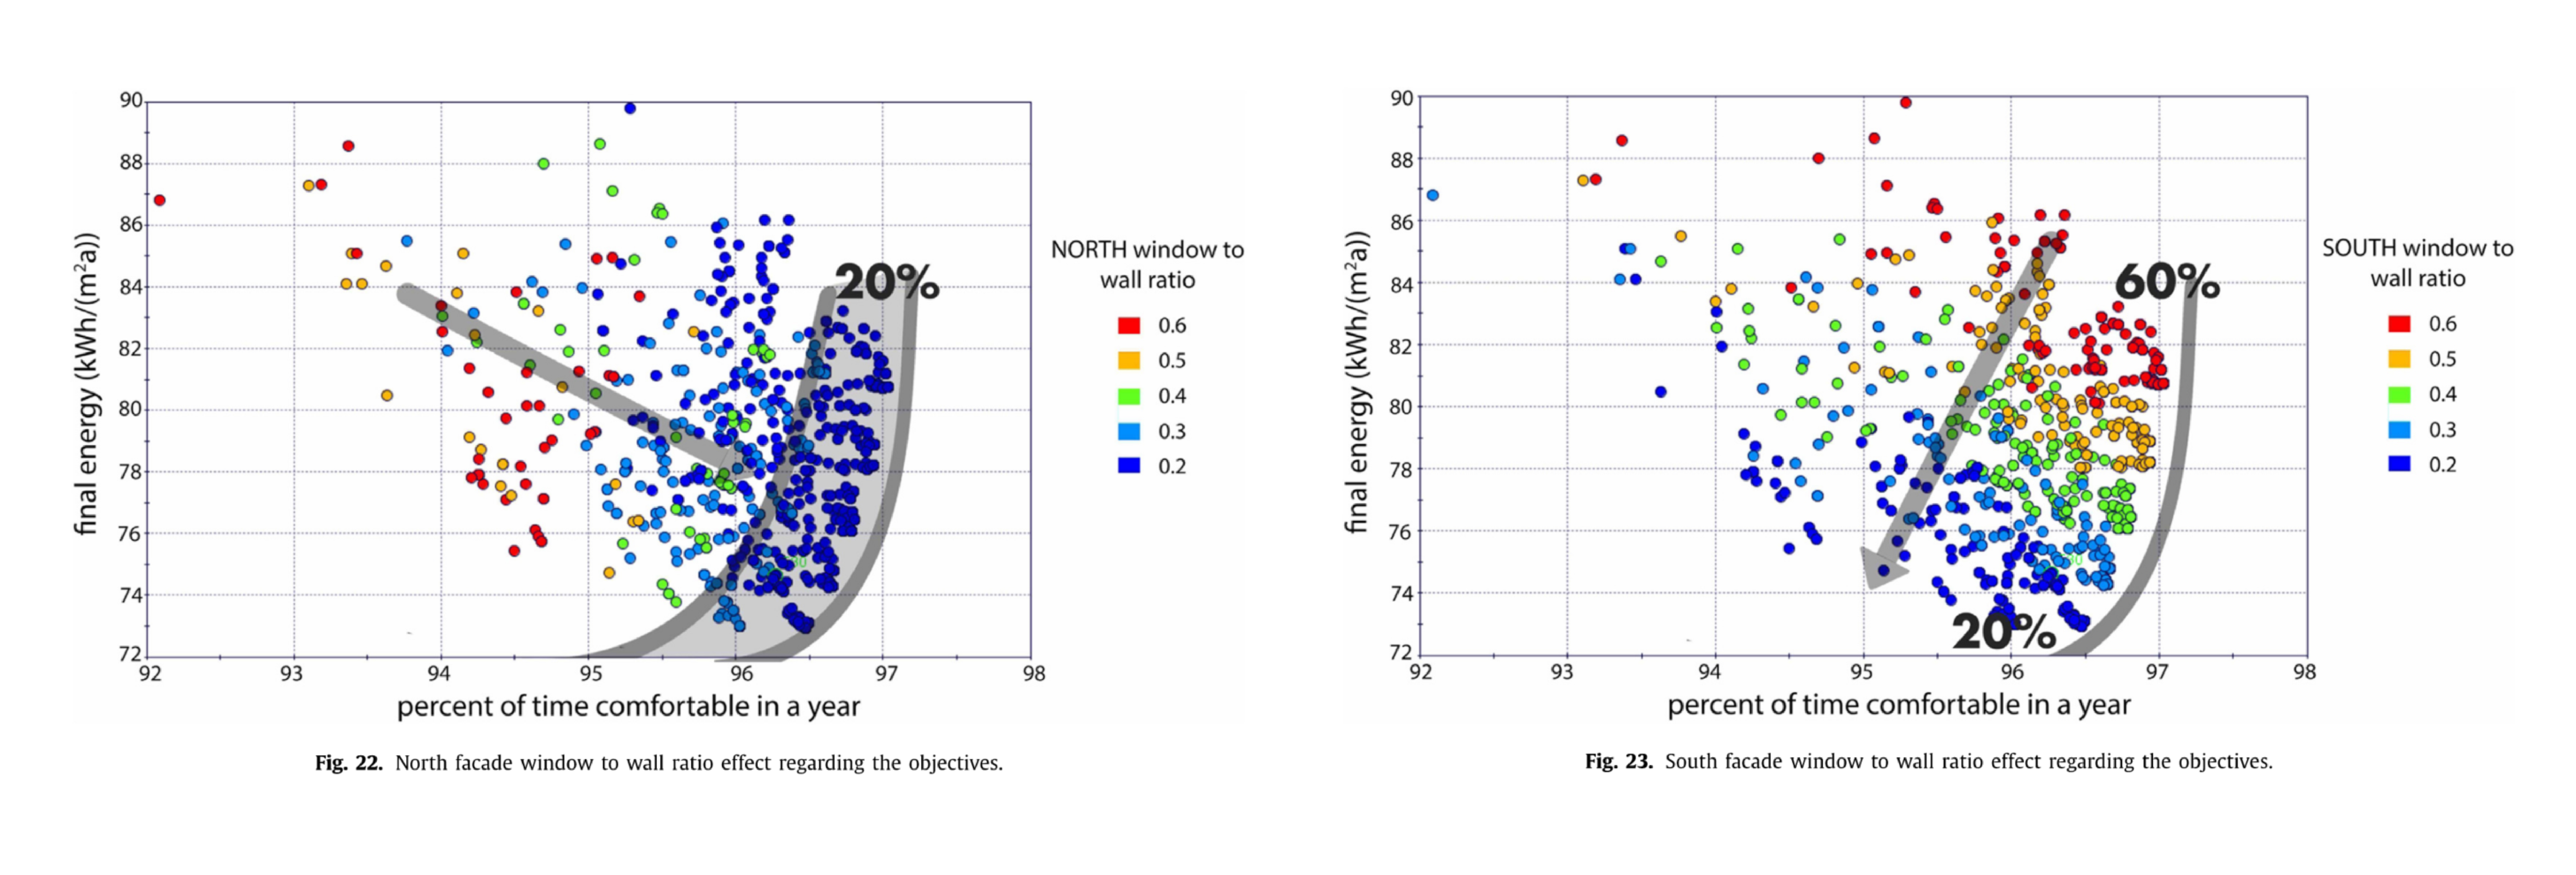
We will take a look at two graphs. The first shows the north facade with various window to wall ratios [Figure 22 in the paper]. The second shows the south façade with various window to wall ratios [Figure 23 in the paper].

When reviewing the two graphs, we can see that for the North Façade, there is a clear solution. All designs located near the pareto front have a WWR of 20%. The specific design that incorporates a 20% WWR does, however, have an impact on the energy use and the comfort.
On the south façade, there is a clear correlation between the WWR and its impact on energy use and comfort. Here, there is an inverse relationship. The higher WWR increases comfort and increases energy use. However, from the curve we can see that this tradeoff is not equal. A 1% increase in the comfort (from 96% to 97% of the year), which is equal to just over a 3 ½ days, comes at a cost of 8 kWh/m2a (from 73 kWh/m2a to 81 kWh/m2a). This is an approximately 11% increase in energy use. This is a trade-off that needs to be evaluated. There is no calculation for how much energy usage is equal to how much comfort. What we can consider is the cost for each step. Increasing the comfort from 20% by increasing the energy use 5% may be worth it. However, increasing the comfort 1% by increasing the energy use 10% may not be worth it. If there is a point where the increase in comfort costs significantly more energy, a point of diminishing returns is reached. At that point, the energy cost for each improvement in comfort may be too high.
Glazing g-value effect on Energy Demand and Comfort
Remember that the goal of the first optimization was to understand which floor plan shape (long rectangle, short rectangle, square, and octogon) is best for performance and comfort. The authors varied 7 parameters for the first optimization. The g-value of the glazing was only reviewed in the first optimization.
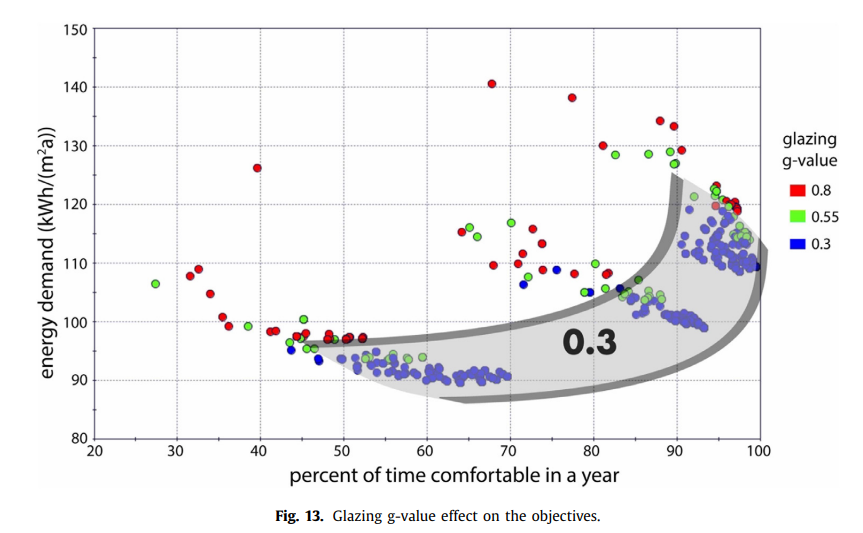
The authors tested 3 different values for the g-value of the glazing which include 0.3, 0.55, and 0.8. The lower the g-value, the lower the solar heat gain is through the glass. The authors expected that in a cooling dominated climate like Athens, where solar radiation creates noticable solar heat gains, a lower g-value would be more beneficial reducing the cooling loads and thus energy demands of the building. The authors also expected g-values to improve comfort inside the buildings.
Through the graph [Figure 13 in the paper], it is possible to see that the predictions the authors used were correct. It is also possible to, again, see the impact of the building footprint on the energy use and comfort. As discussed in the previous section, the designs are clustered into 3 groups based on the building form and we can see that the g-values of the most successful designs are similar across floor plan shapes. When looking within a specific cluster, we can see that 0.3 and 0.55 are the primary options located in the range near the pareto front with 0.3 consistantly being adjacent to the pareto front. Based on this information, it appear that 0.3 is always the best solution regardless of the shape of the floor plan. This is why the author selected a g-value of 0.3 and did not do further optimizations on the g-values for the second optimization.
This is an example of an analysis that has a clear solution. Regardless of floor shape or other builidng factors, a 0.3 g-value always performs best.

Paper: Zero energy potential of a high-rise office building – Giouri et al. 4/5
Conclusionlink copied
This paper and its summary introduced you to an application of multi-objective optimization. In the additional chapter, you explored the concept of the Pareto front and its role in visualizing results from multi-objective optimization. Through examples, supported by graphs from the paper, you learned how to interpret scatter plots and draw meaningful conclusions. By reviewing this material, you now understand how to analyze scatter plots that depict the Pareto front and draw conclusions from a multi-objective optimization.
Paper: Zero energy potential of a high-rise office building – Giouri et al. 5/5
Useful Linkslink copied
Write your feedback.
Write your feedback on "Paper: Zero energy potential of a high-rise office building – Giouri et al."".
If you're providing a specific feedback to a part of the chapter, mention which part (text, image, or video) that you have specific feedback for."Thank your for your feedback.
Your feedback has been submitted successfully and is now awaiting review. We appreciate your input and will ensure it aligns with our guidelines before it’s published.
