Ladybug Import Weather Files
-
Intro
-
Importing the EPW data
-
Quality of EPW file
-
Specify time period of WEA file
-
Conclusion
-
Useful Links
Information
| Primary software used | Ladybug |
| Course | Ladybug Import Weather Files |
| Primary subject | Analysis & simulation |
| Secondary subject | Climate analysis |
| Level | Intermediate |
| Last updated | November 11, 2024 |
| Keywords |
Responsible
| Teachers | |
| Faculty |
Ladybug Import Weather Files 0/5
Ladybug Import Weather Files
Explanation of how to import weather files with Ladybug in Grasshopper, which is used for several simulations.
This tutorial explains the use of EPW data in Grasshopper to facilitate the daylight analysis of a building or space. EPW data are weather data that correspond to a specific location the user wants to investigate. The tutorial consists of three steps: importing the EPW weather data, checking the quality of the file and specifying the time period in the WEA file.
Ladybug Import Weather Files 1/5
Importing the EPW datalink copied
In this first step, we will find the weather data we need to analyse our model. To do so we will use an LB EPWmap component with a Boolean Toggle.
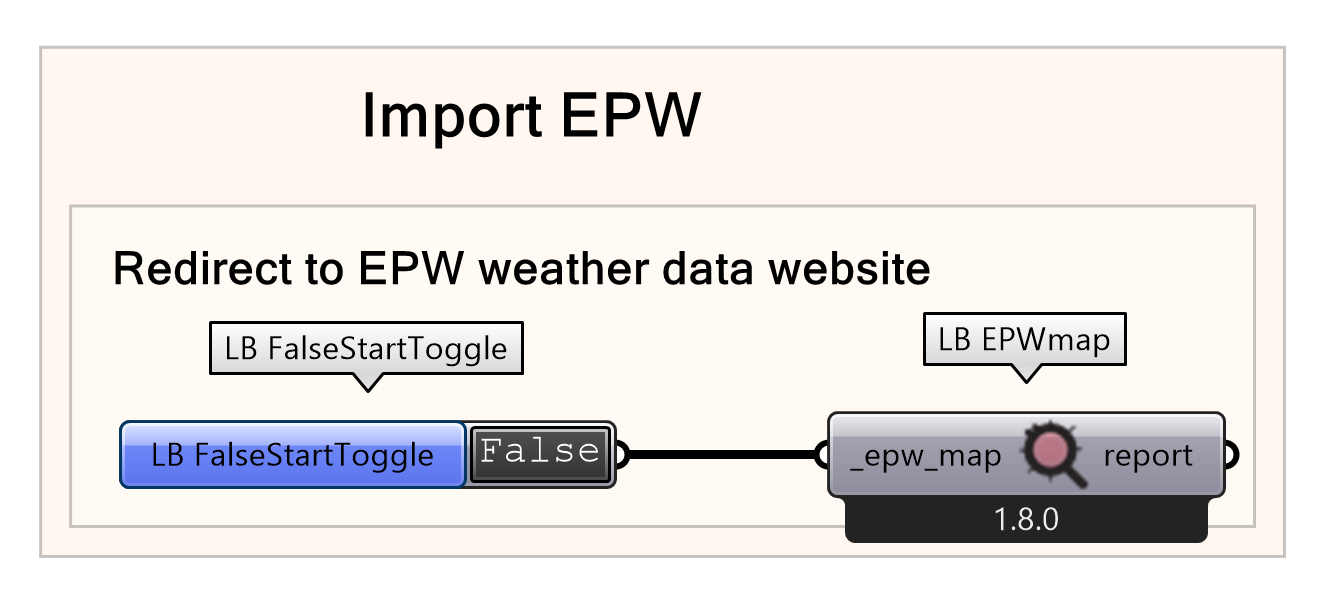
- Add an LB EPWmap component to the canvas
- Connect a boolean toggle to the input
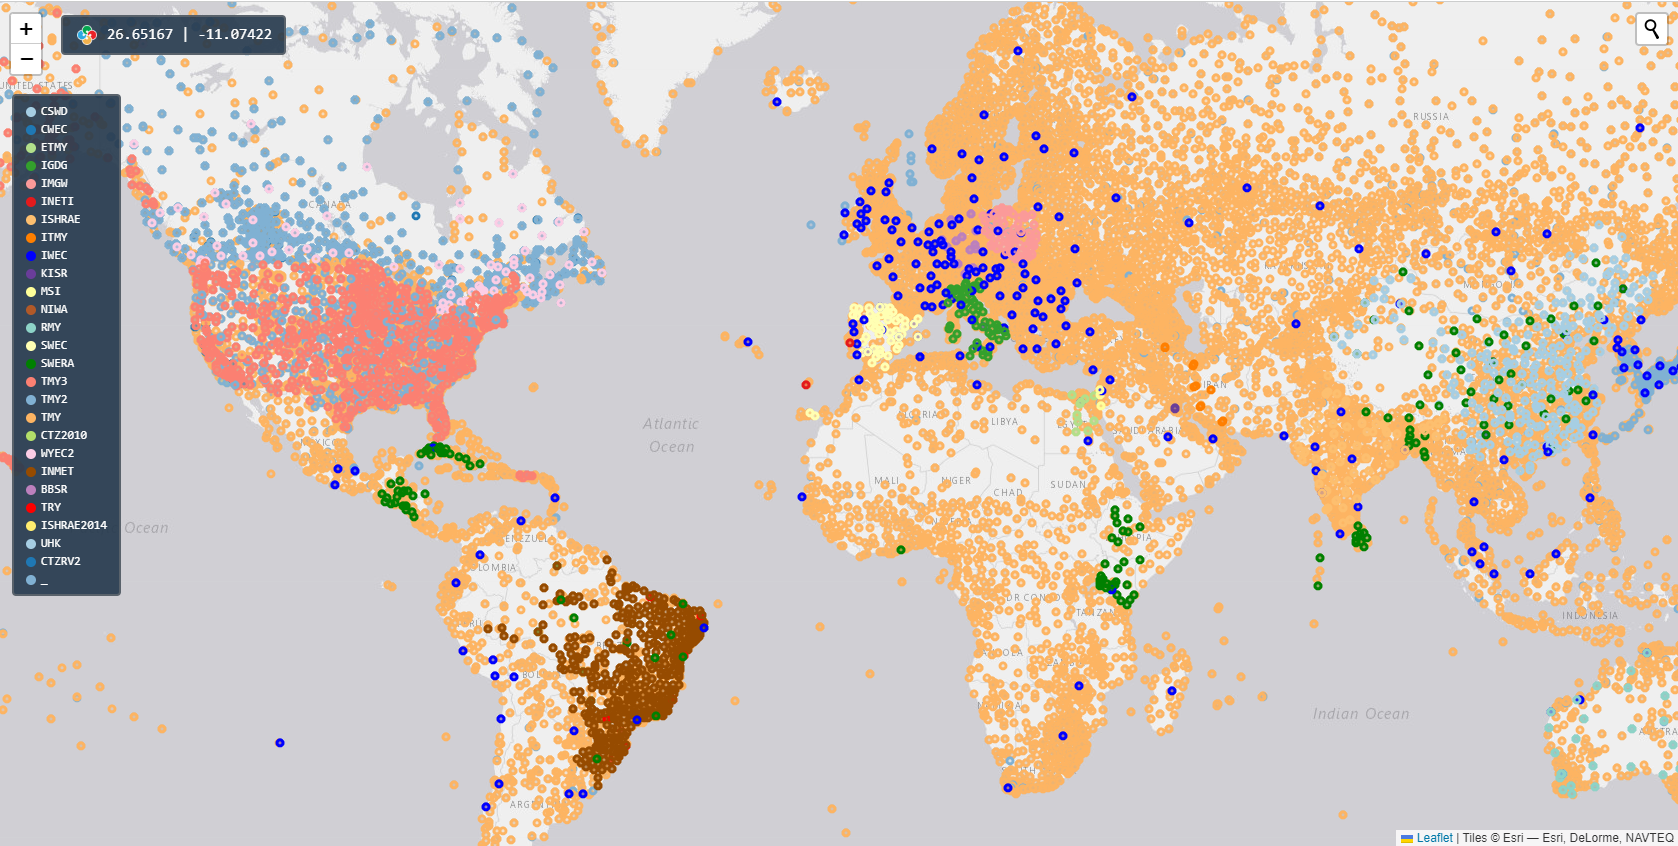
By changing this toggle to True, the component will open a website automatically for you with the data we need, and the EWP files you need can be downloaded and imported directly in Grasshopper via Ladybug and the EPW weather data website. On the directed website you can zoom in to the location you need weather data from. If the exact location is not available, try to find the closest one.

- Double click on the boolean toggle to change the value to True
- Find the location you need on the weather data website
To use the weather file, the URL of the location needs to be copied. When you find the city that you need, click on the city and “copy link to clipboard”. Your browser will now copy a link to the right address to retrieve the weather data from.
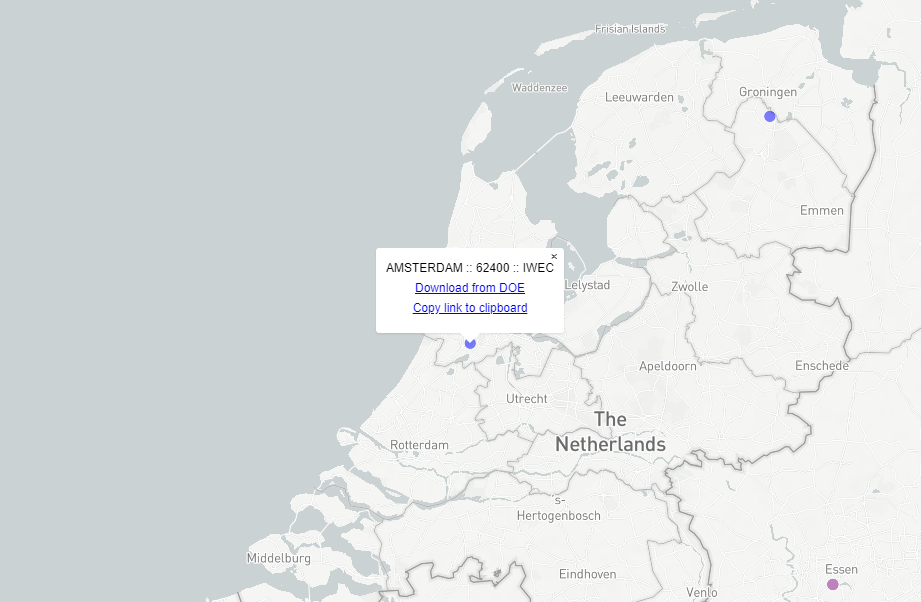
- Copy the weather data to clipboard
After you copied the URL for the weather file, open your Grasshopper file again. Now we need to import the data. Add an LB Download Weather component to the canvas. To retrieve the data, paste the copied link in a panel and connect it to the weather URL input of the LB component.
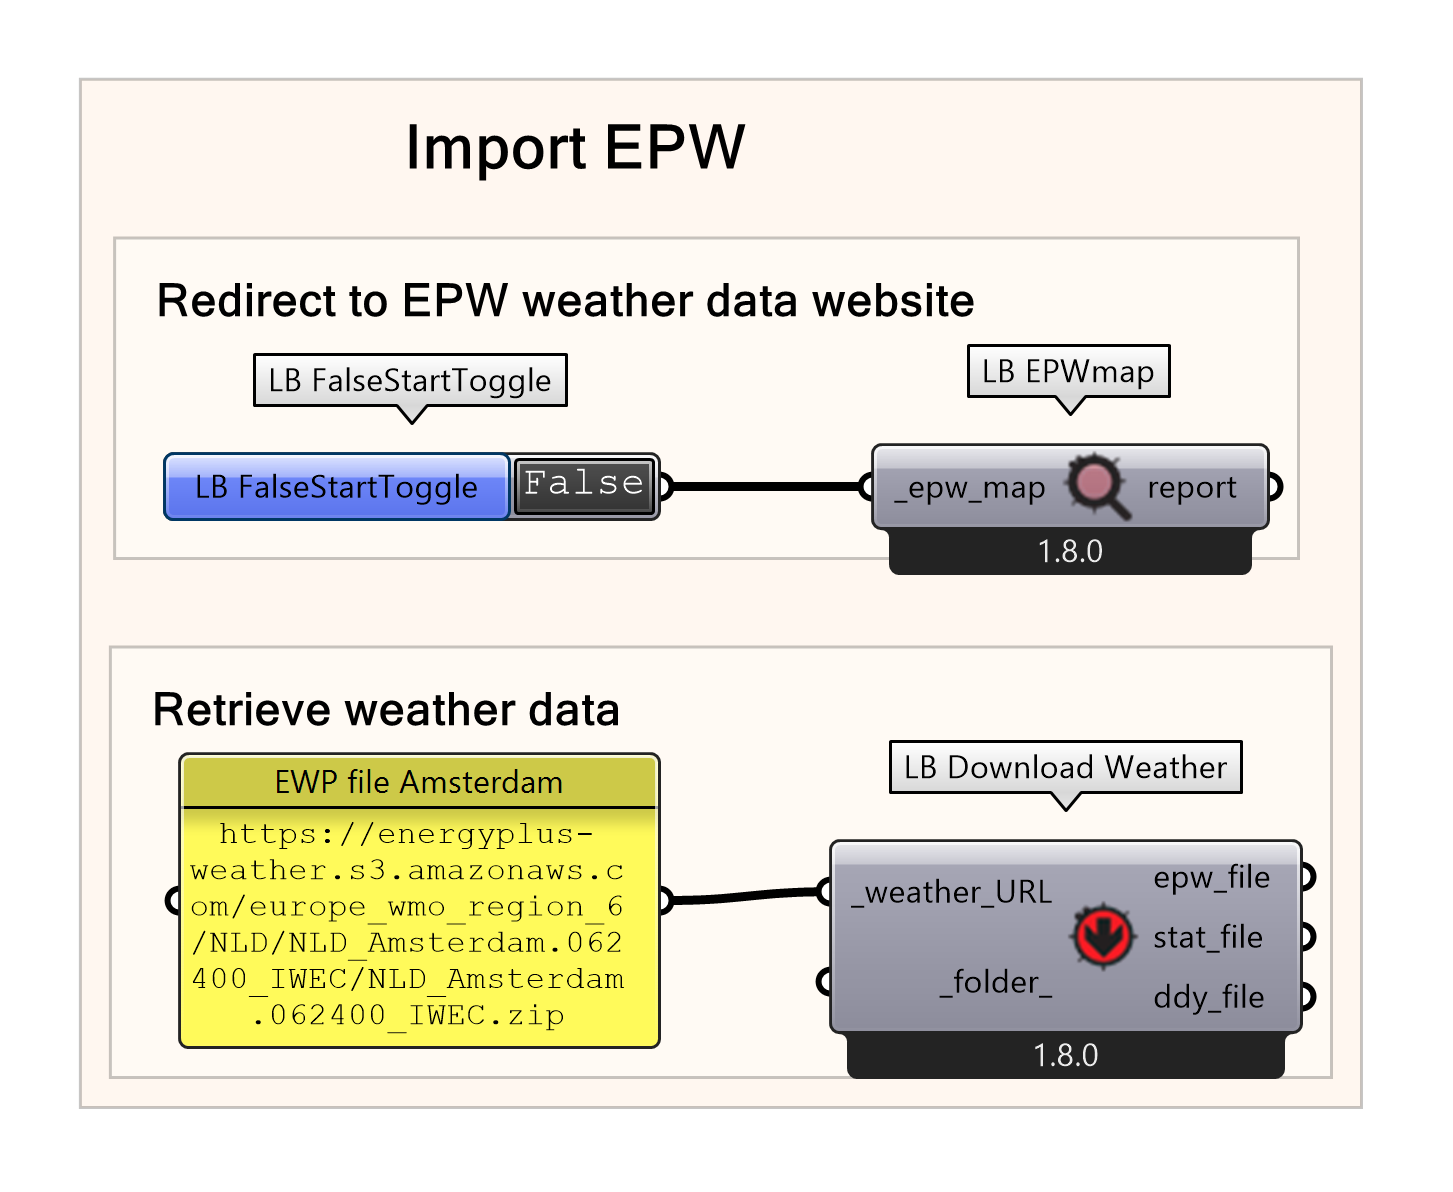
- Open Grasshopper again
- Add an LB Download Weather component to the canvas
- Connect a panel to the weather_url input
- Paste the link in the panel
Note: When opening a GH script from someone else it’s possible the copied URL in the panel won’t work or is outdated. Therefore, its advisable to always copy your own link from the website as described above.
Extracting EWP data
Although we have imported the weather, it is not visible or separated in parts yet. To extract data from the EWP file use an LB Import EPW component and connect the ewp_file output of the LB Download Weather component. The LB import EPW component transforms the downloaded weather data file into usable data for various simulations, such as the daylight simulation.
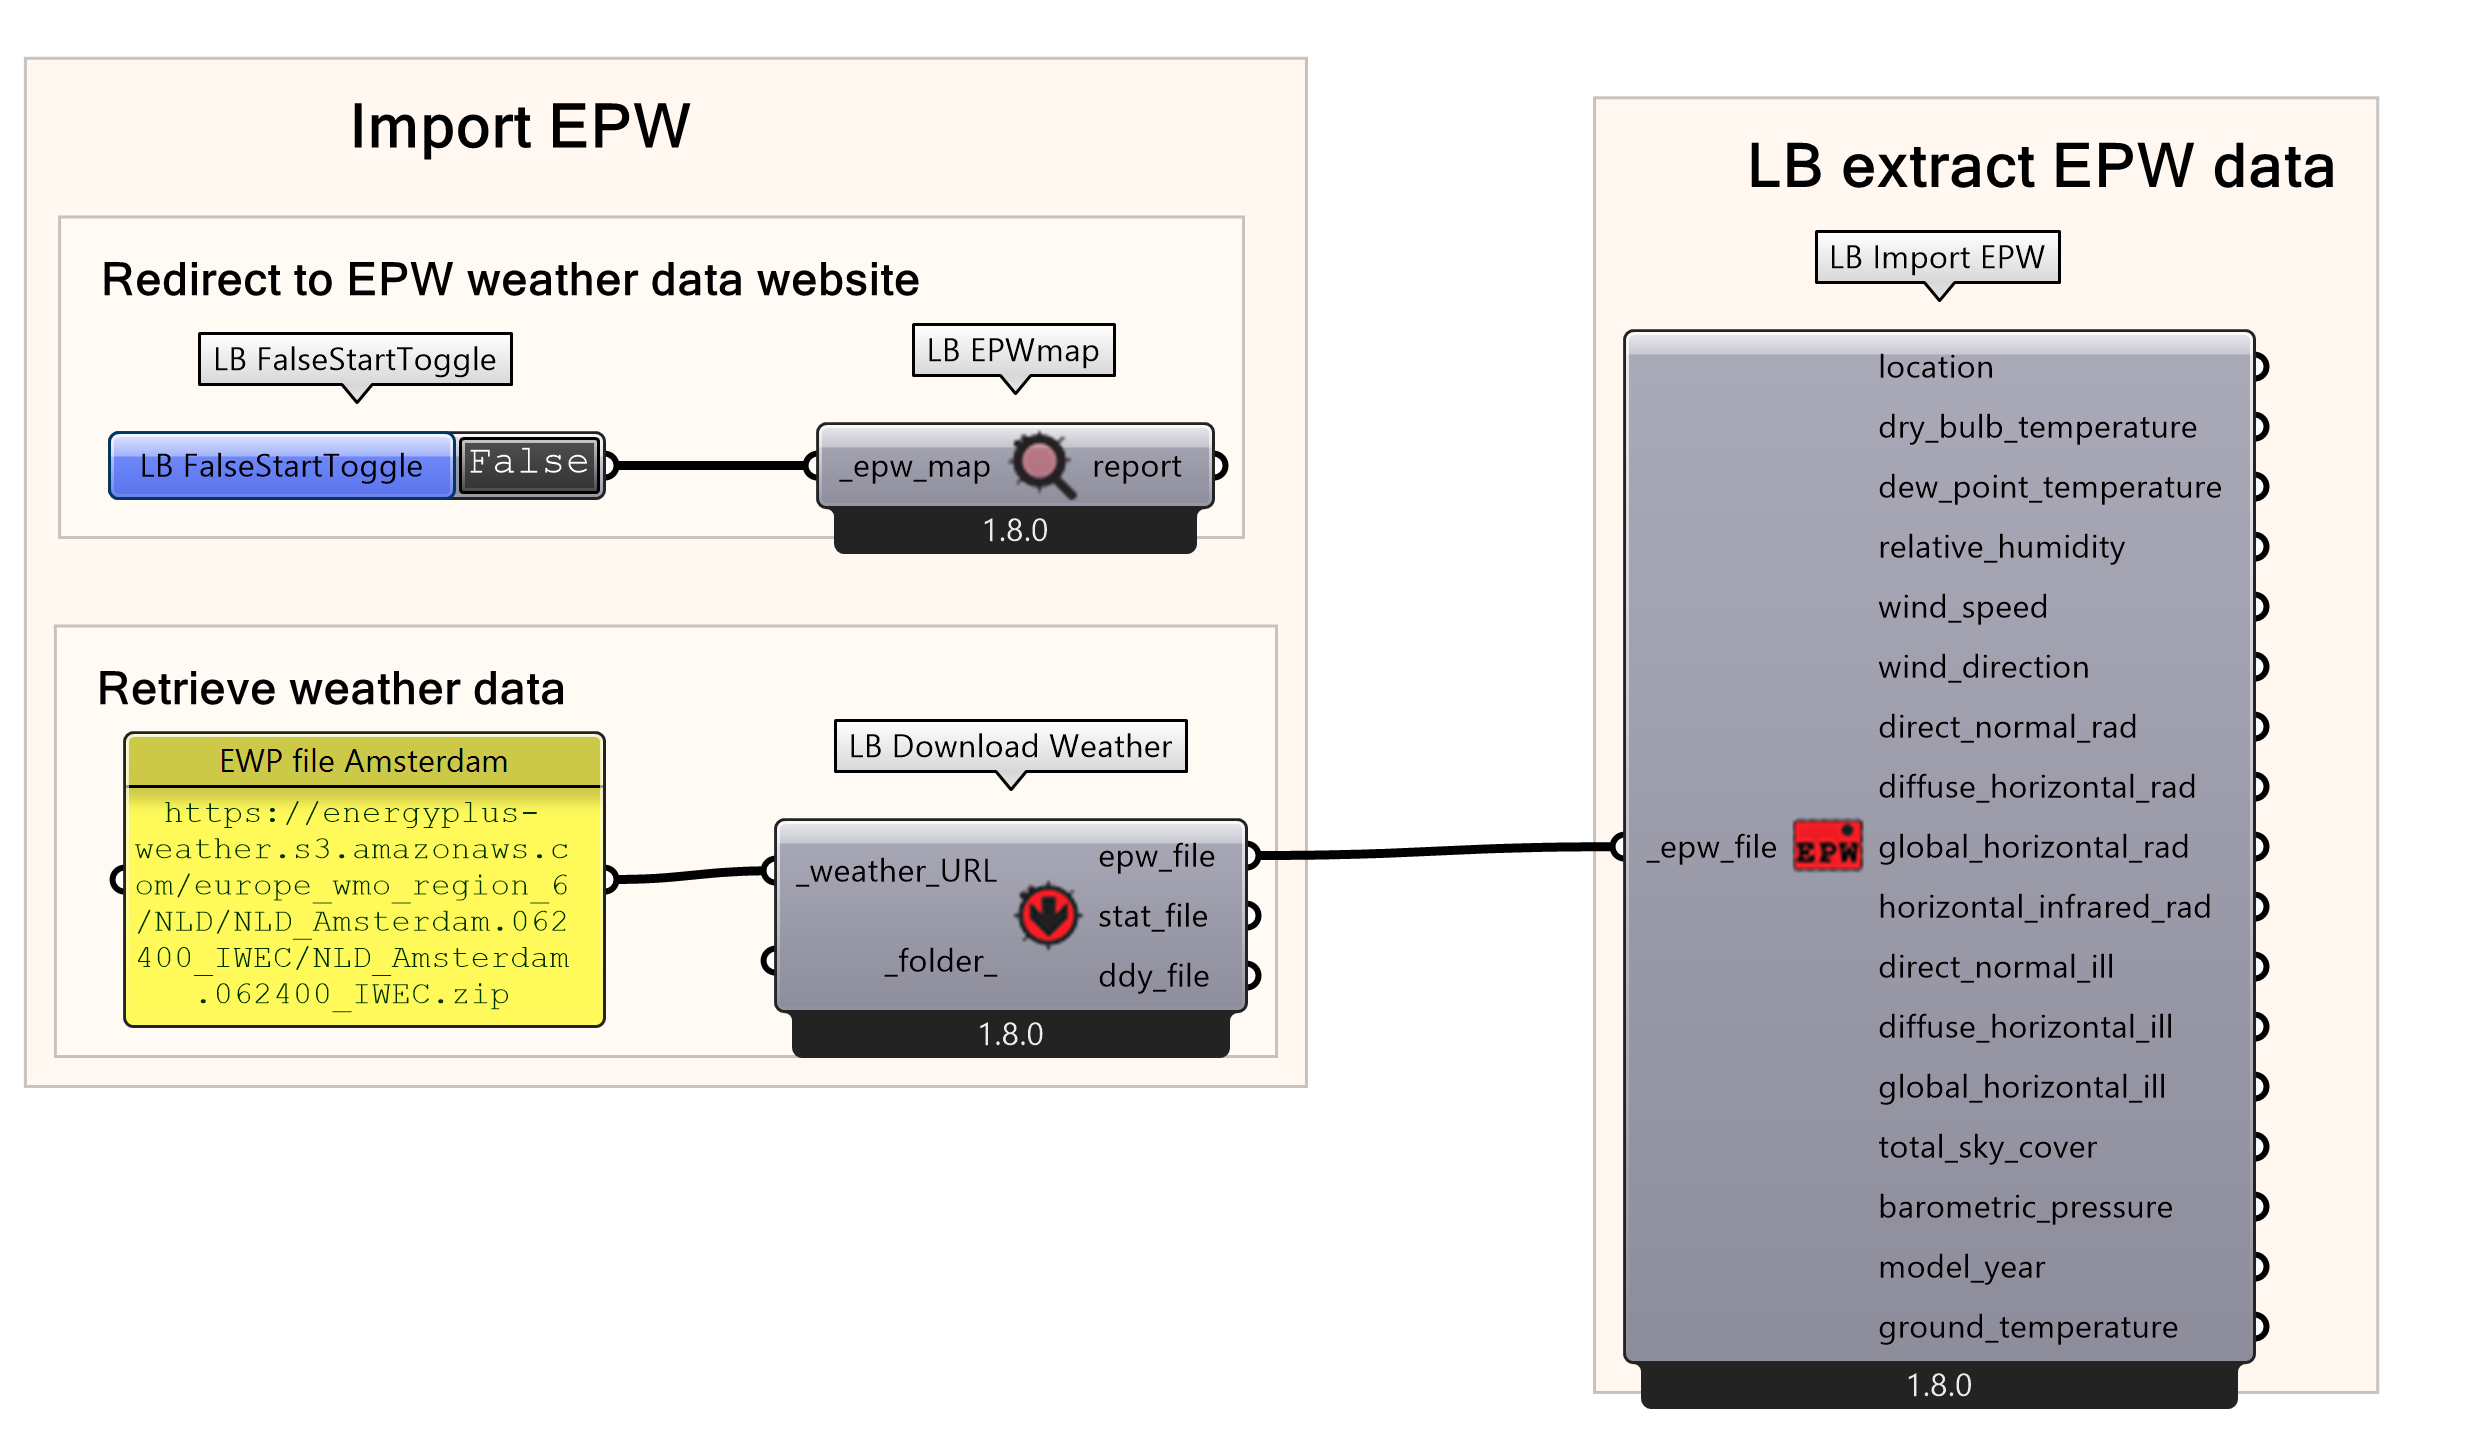
- Extract EWP data by
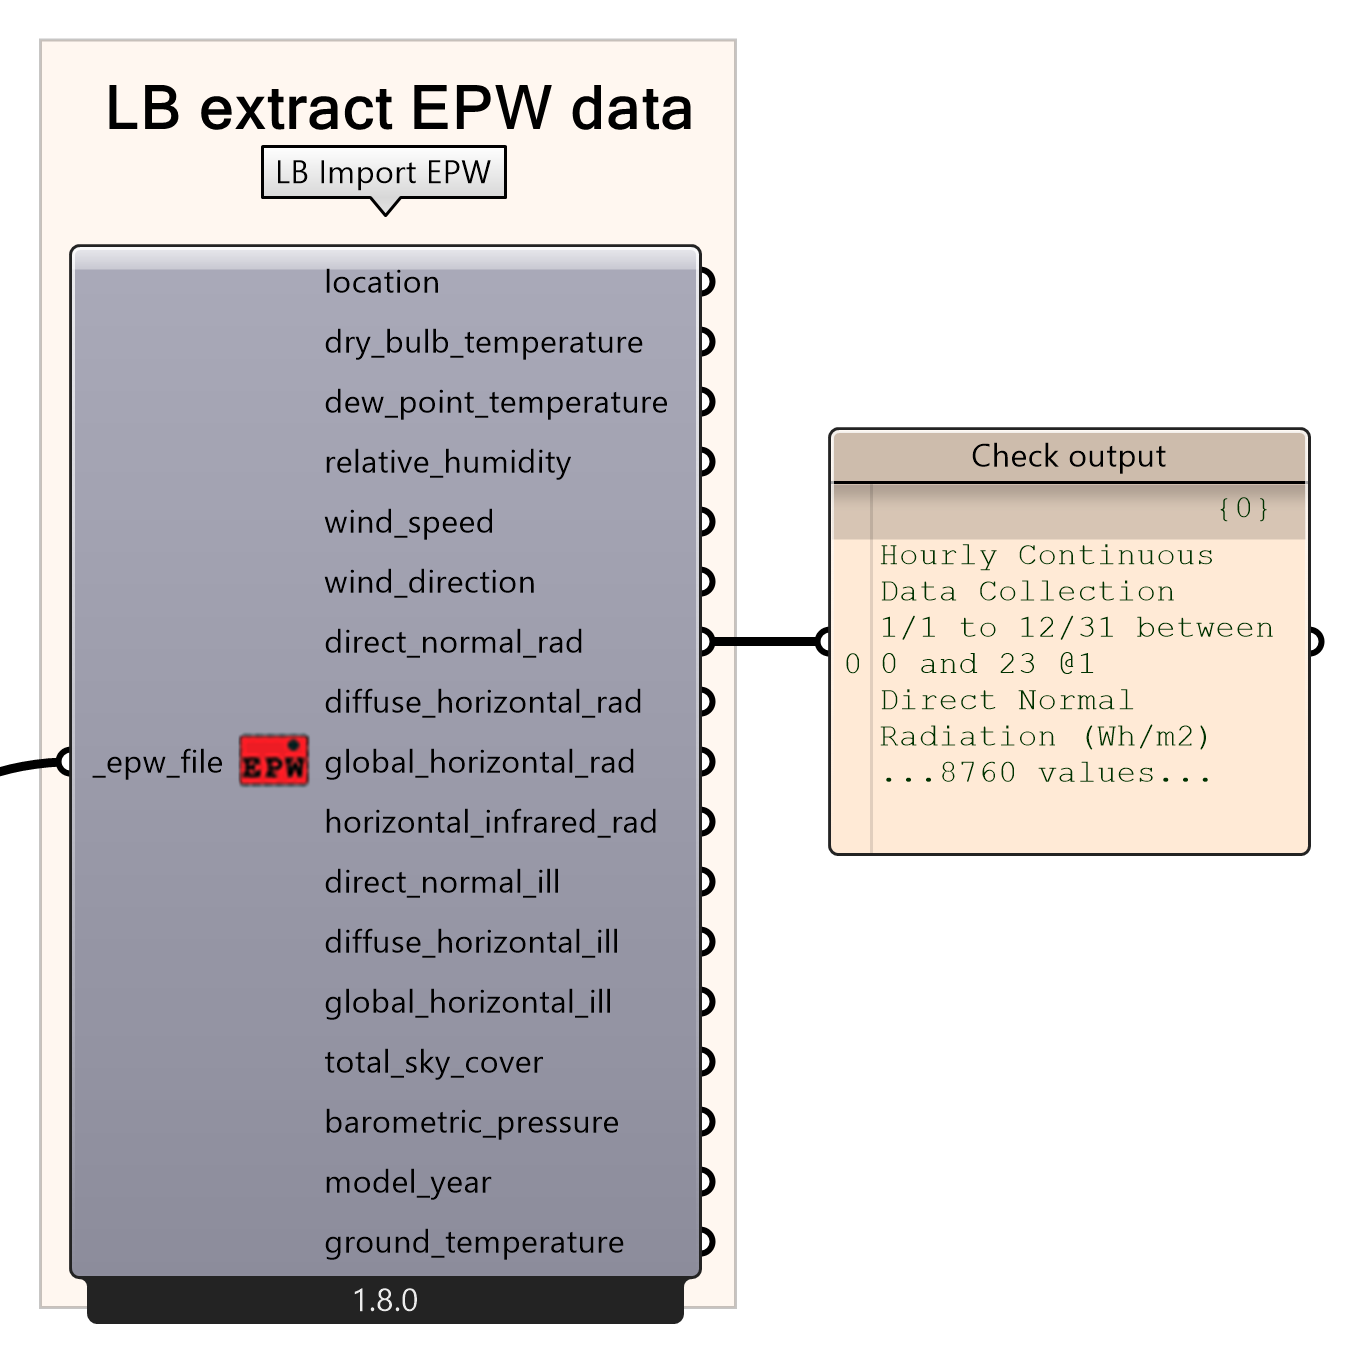
If you connect a panel to one of the outputs of the Import EPW component, you will see that Ladybug has extracted several types of information. Internally, the data contains 8.760 values, which is exactly equal to the number of hours in one measured year.
Ladybug Import Weather Files 2/5
Quality of EPW filelink copied
Next, we need to make sure that the EPW file is of good quality and does not miss any data. Providing wrong or inaccurate input data to a simulation leads to wrong or inaccurate – hence useless – results. This is done by creating plots and comparing & evaluating the result.
Create the plots
To check the quality, you should first make plots of the data regarding the direct, diffuse, and global radiation that exist inside the EPW file. Use a LB hourly plot component to create a graph for each of the data types.
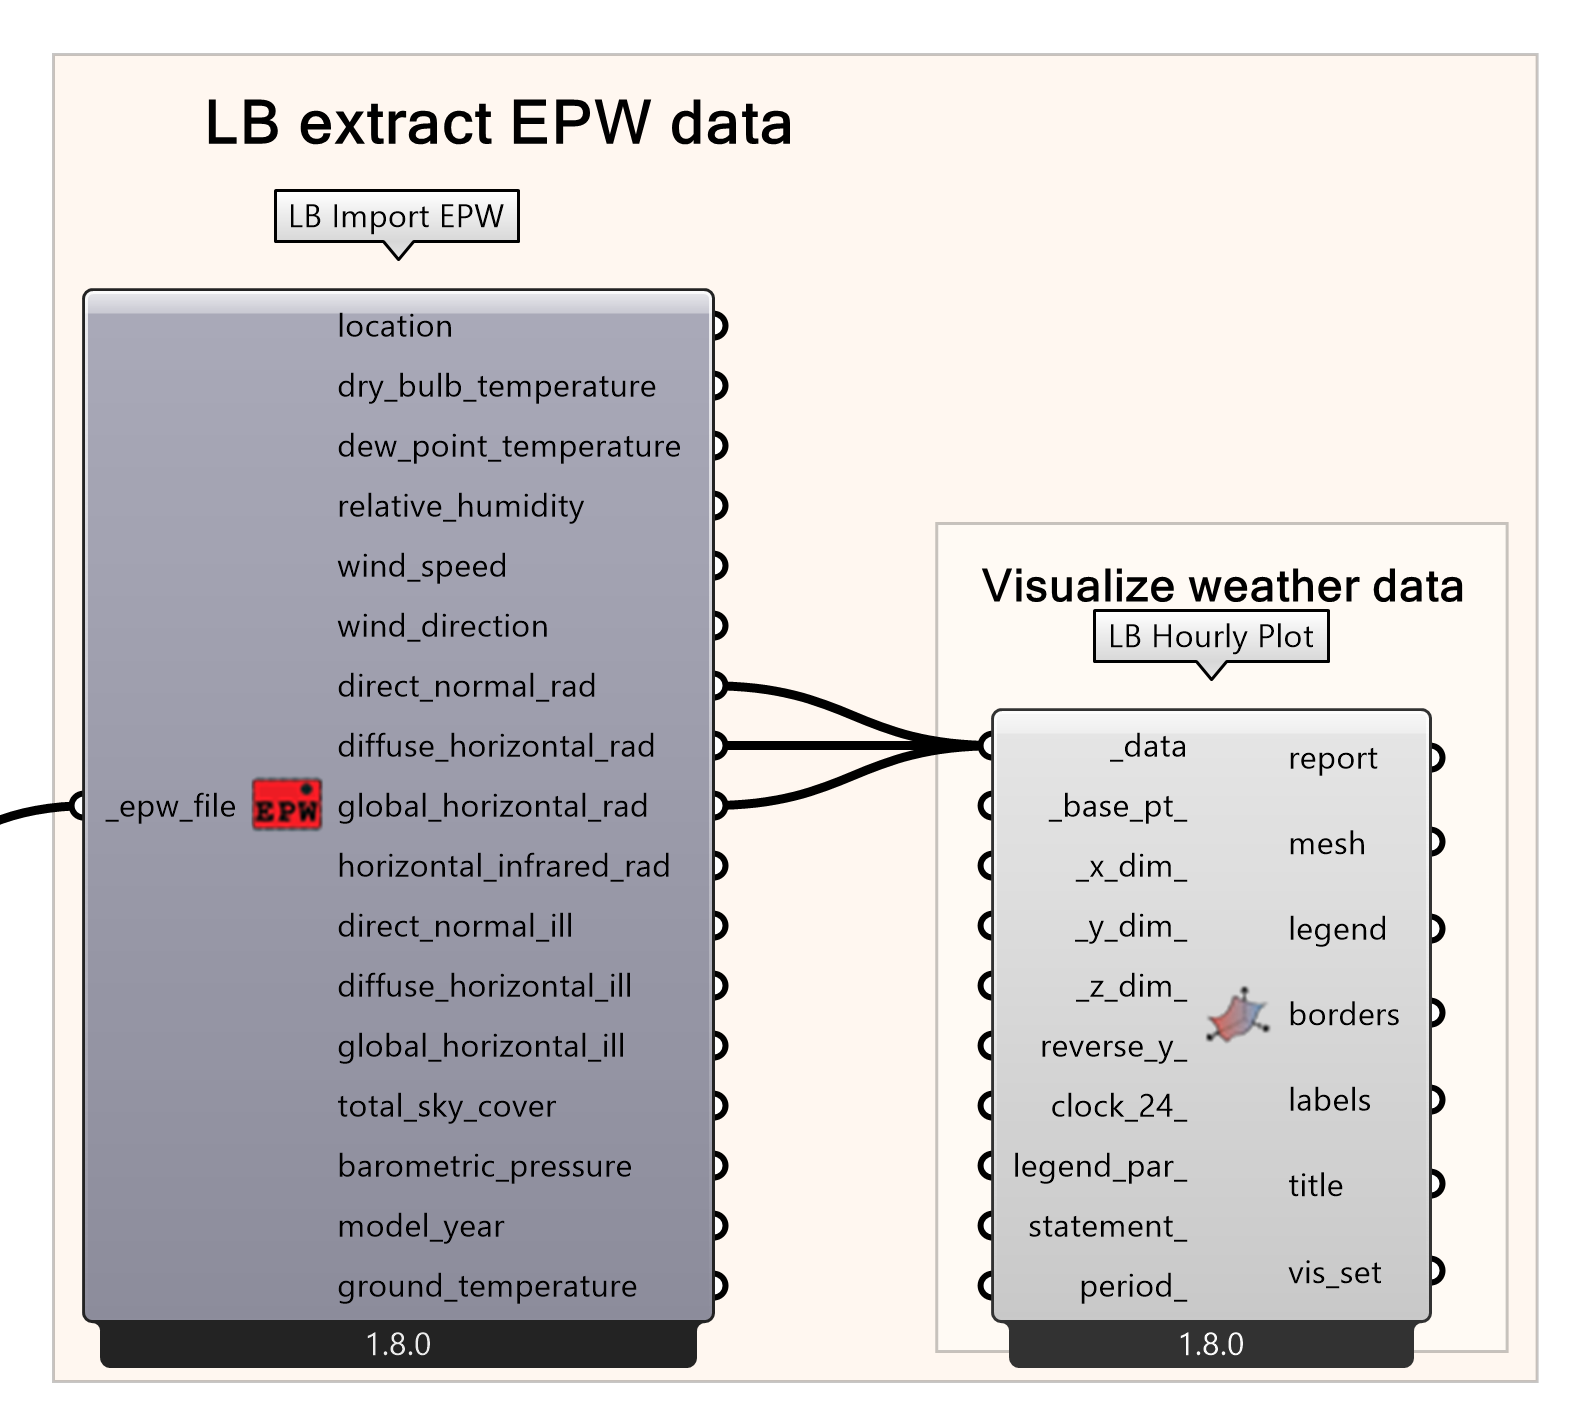
- Create a LB plot by
- Connect the ‘direct_normal_rad’, ‘diffuse_horizontal_rad’, ‘global_horizontal_rad’ results from the LB Import EPW file component to the ‘data’ input of the LB Hourly plot.
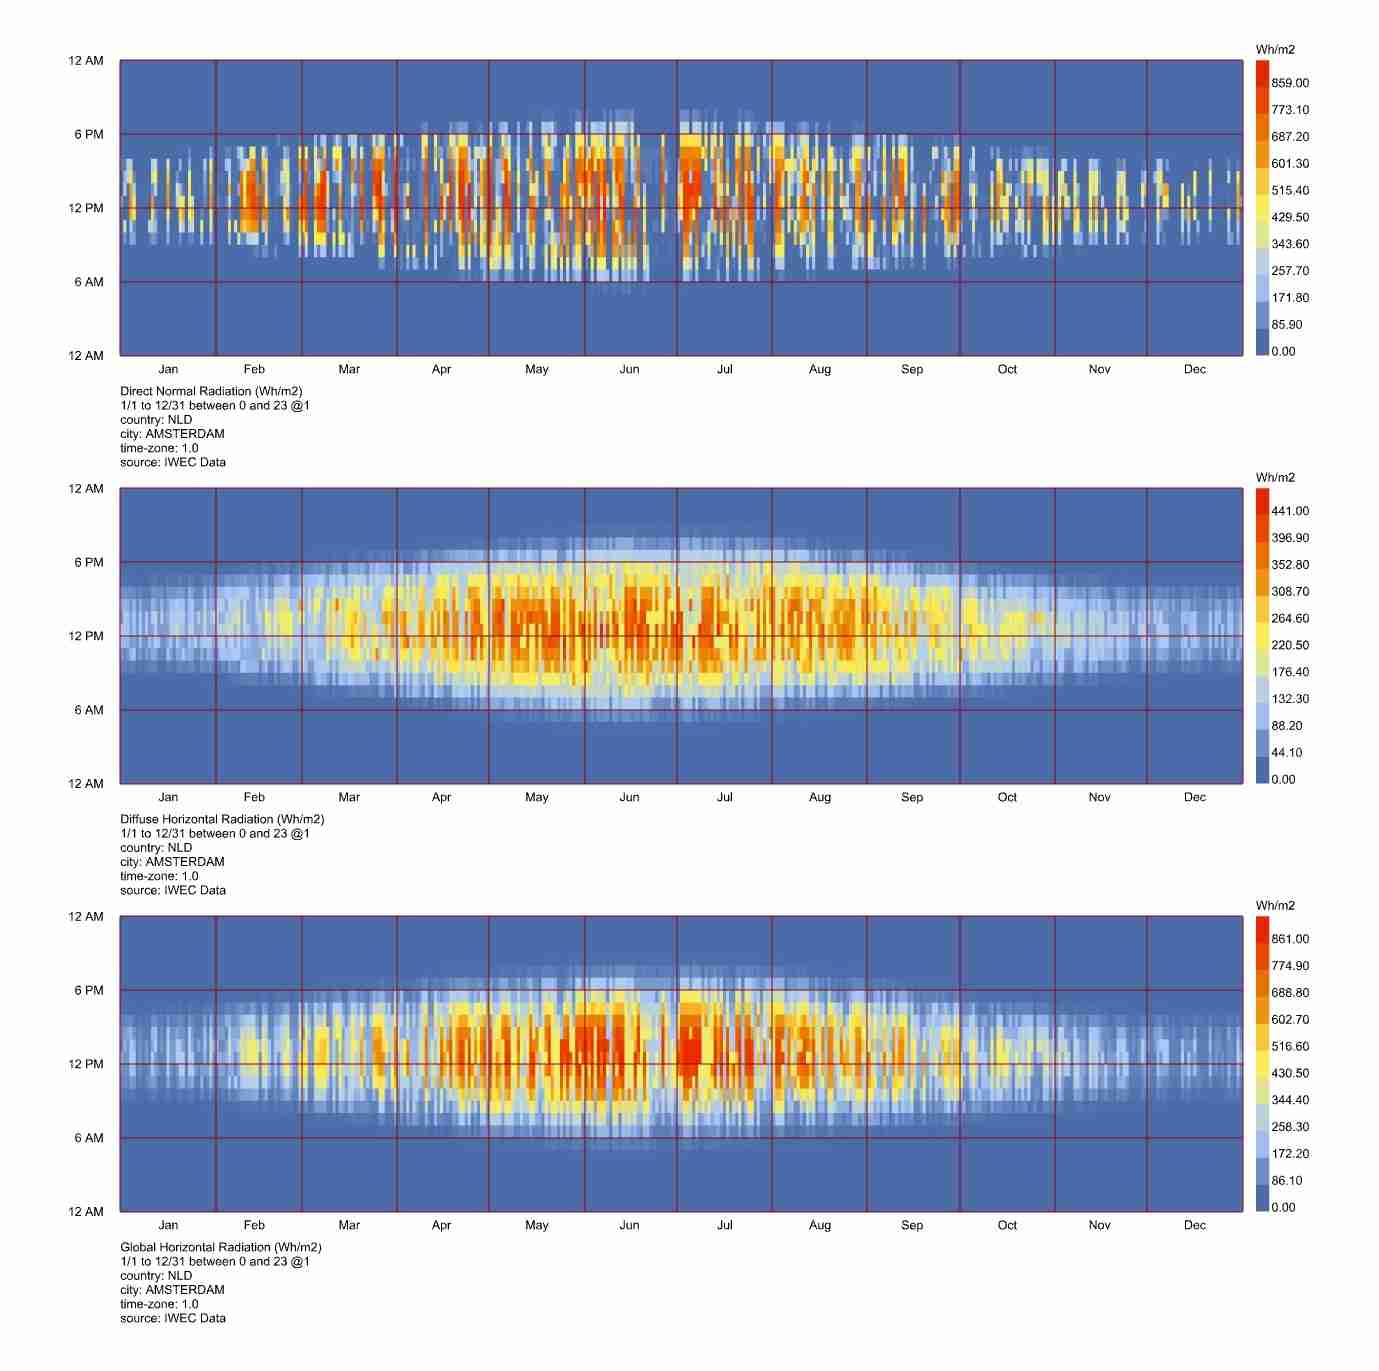
In the Rhino window you should be able to see the corresponding graphs created. The LB hourly plot component automatically creates the three plots under each other.
Compare & make an evaluation
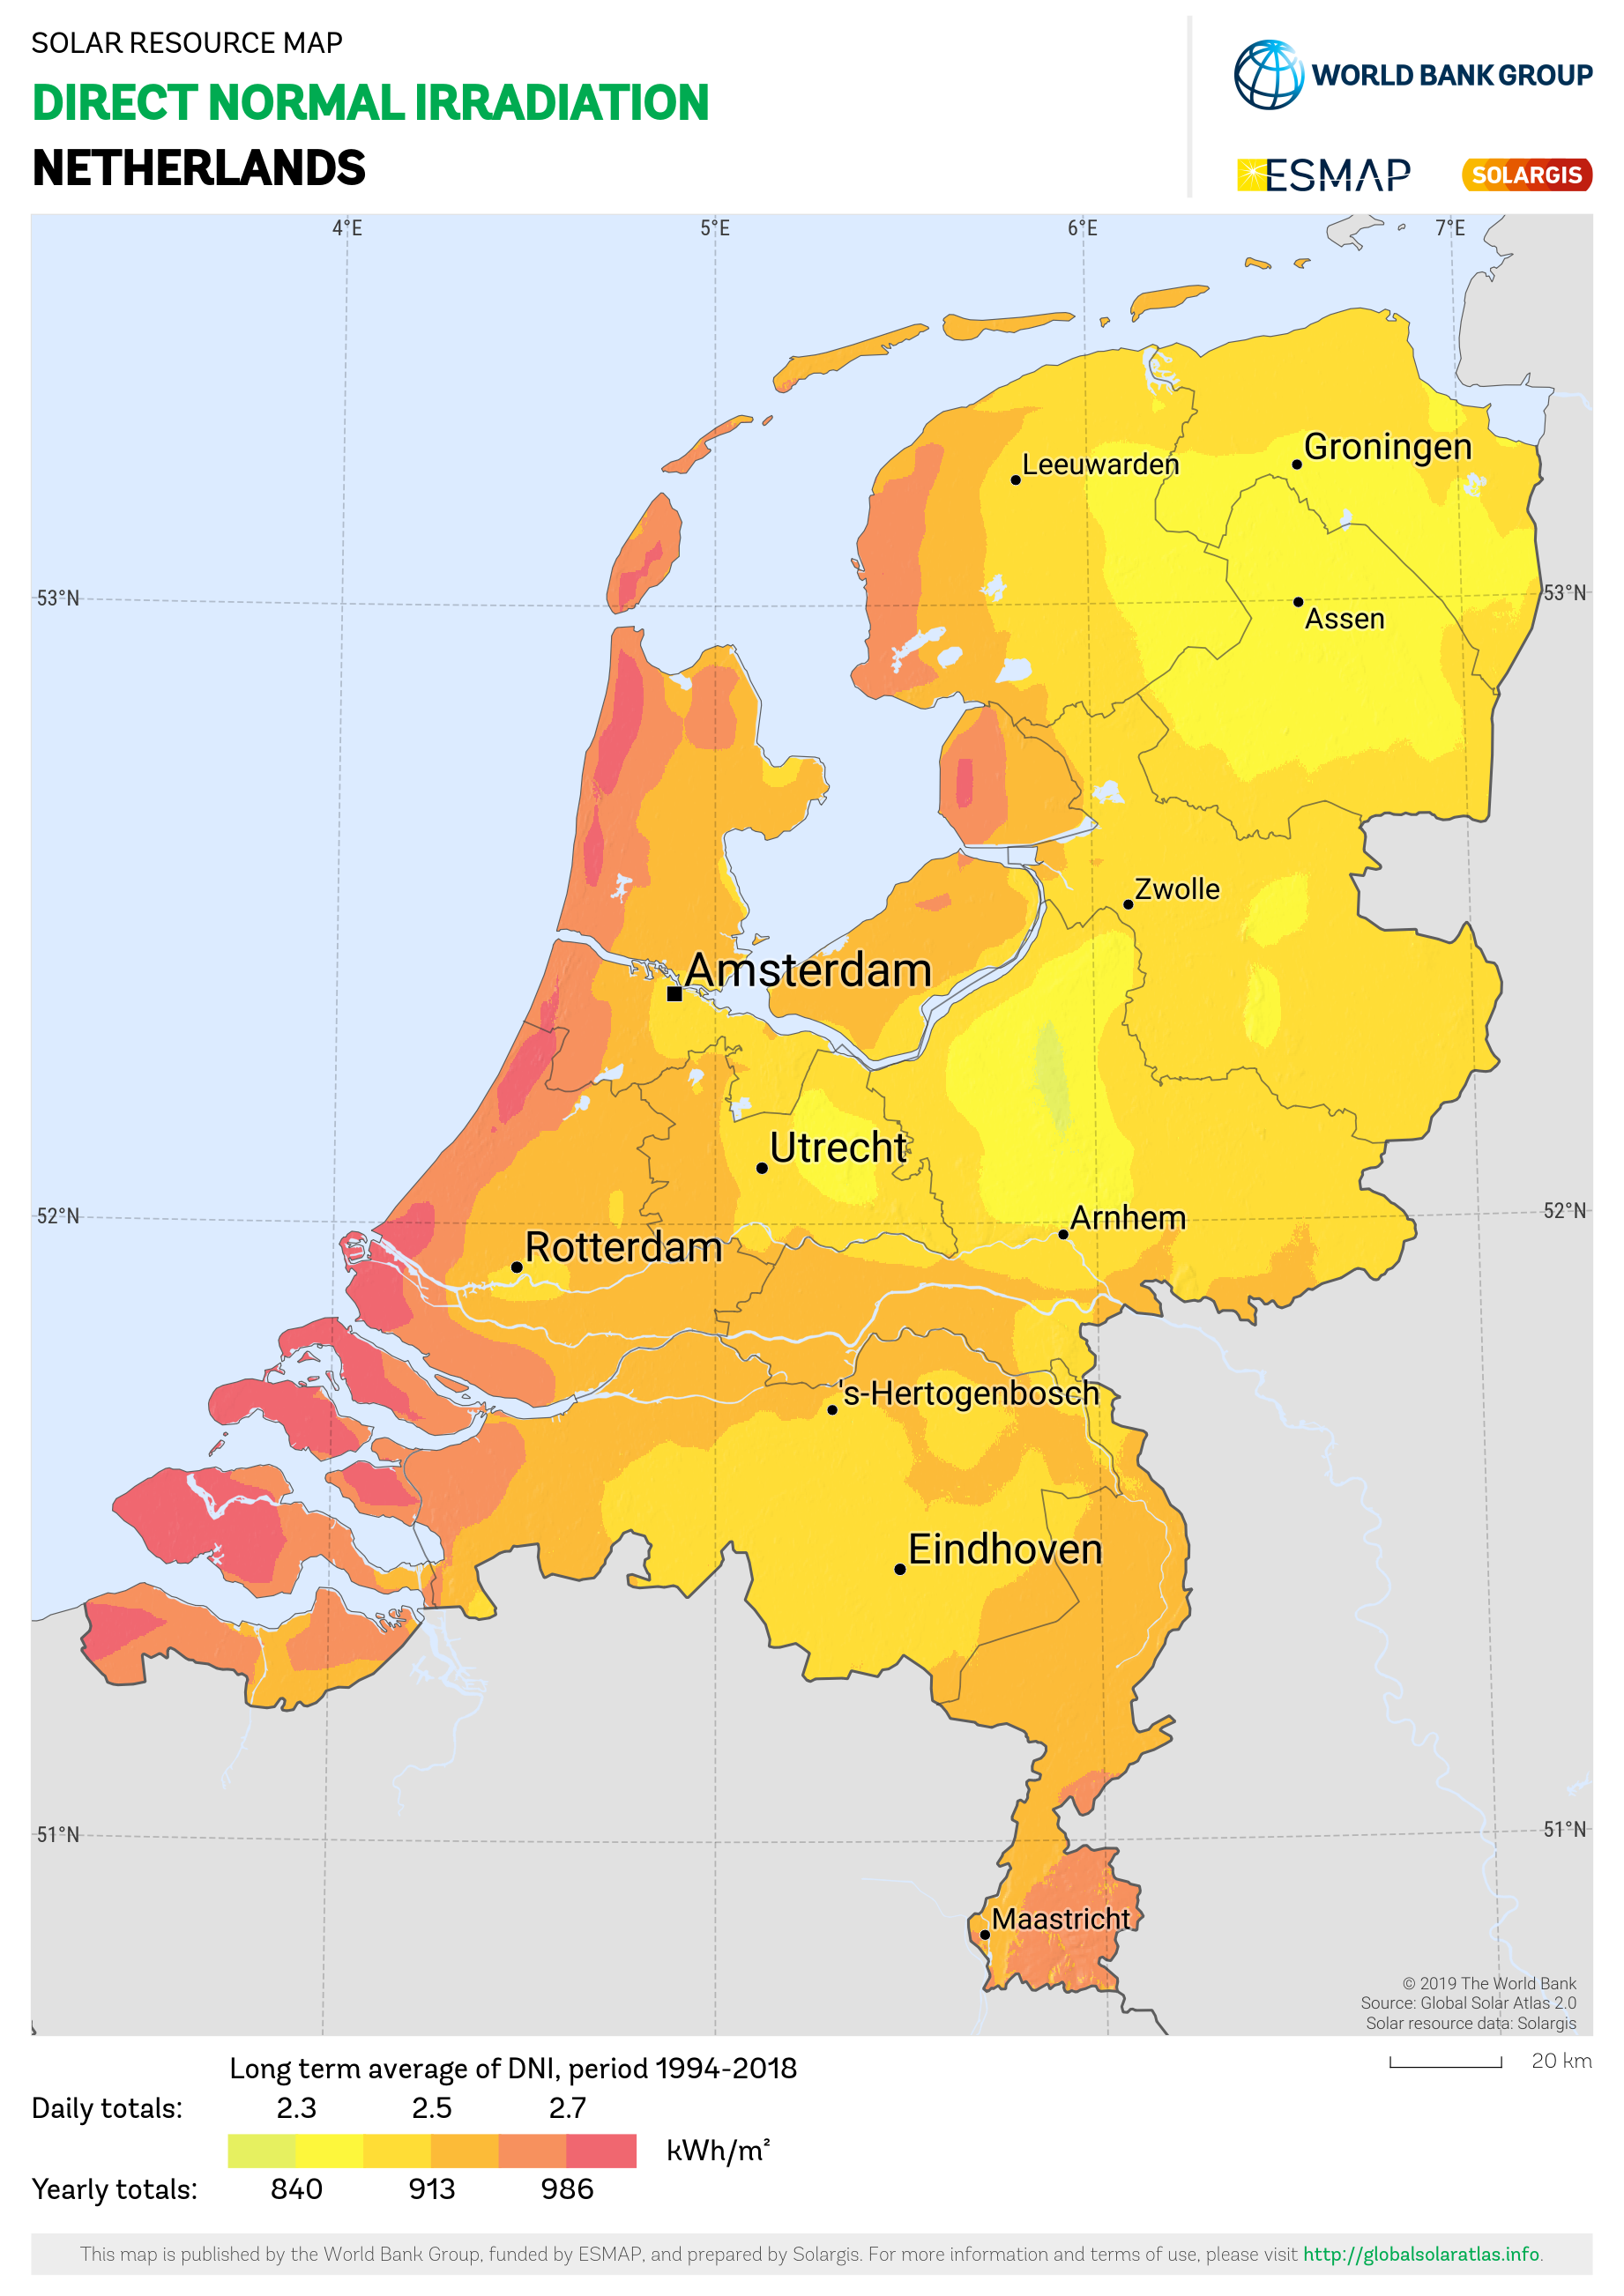
Following the creation of the plots, you should check if there are significant data missing on the plot throughout the year time. Afterwards, you can assess the values that you get through cross-checking of the same type of data retrieved from different sources. For example, you can find maps of Direct Normal Irradiation compare the expected irradiation value for the location of interest with the result that you get from the LB Hourly Plot. You can find the Direct Normal Irradiation on the SolarGIS website.
Note: Keep in mind that extra-terrestrial irradiance is equal to 1367 W/m2 and it is extremely rare that the Direct Normal Irradiance measured at ground level exceeds this value. Even more so for Global and Diffuse Horizontal Irradiances.
Ladybug Import Weather Files 3/5
Specify time period of WEA filelink copied
Depending on the type of daylight simulation you are conducting a different component is used for exporting the EWP data to the right format. To run a daylight simulation the location from the EWP file or a WEA object is needed, depending on the simulation type. This part explains how to transform an EWP into a WAE and how to select a specific analysis period.
WEA from EPW
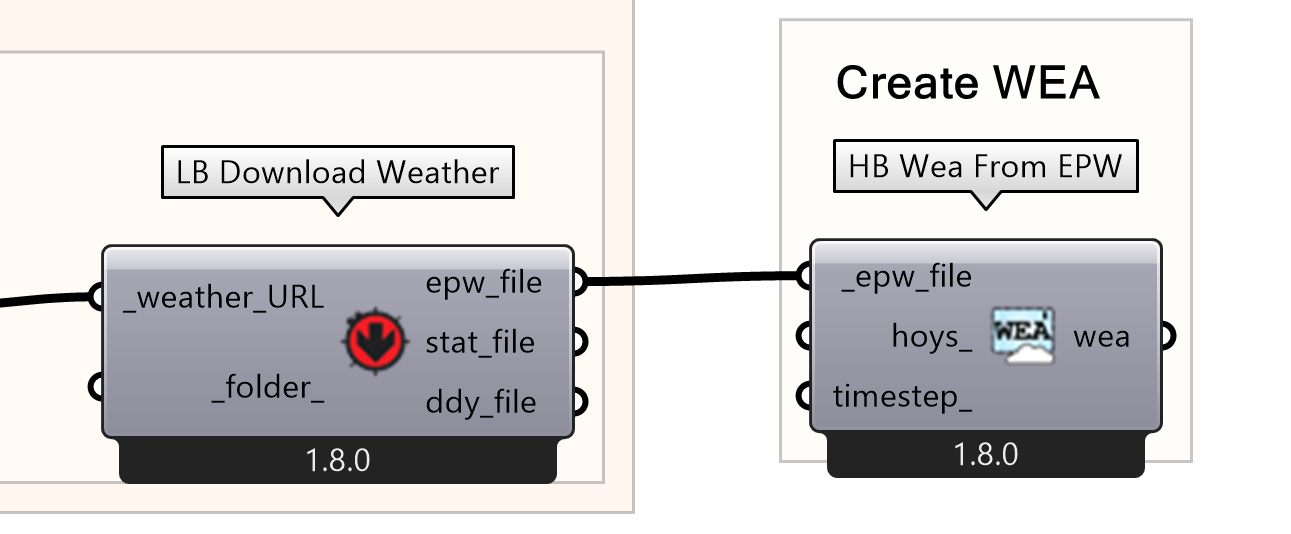
To transform the EPW file to a WEA object a HB Wea. From EPW component is needed that takes the input from the downloaded weather file and creates the WEA object.
- Create HB WeaFrom EPW
- Connect the output epw_file from the LB Download Weather to the input _epw_file.
Analysis period
The final part of this tutorial specifies a time period in the WEA file that is worth analyzing for the specific building or space of the project. By default, the component the EPW to WEA component will extract the data for the whole year period. However, there is the option to filter this time period by specifying the ‘hoys’ input. You do not always have to specify all the values in the LB Analysis Period component. For example, if you do not have specific days or hours which you want your simulation to be related to, you can only set the Start and End in terms of the corresponding months. A LB analysis period component is used to select specific start and end time/day/month. Create separate sliders to specify the analysis period and set the numbers according to the months (1-12), days (1-31) or hours (0-23), that correspond to the start and end of your time period.
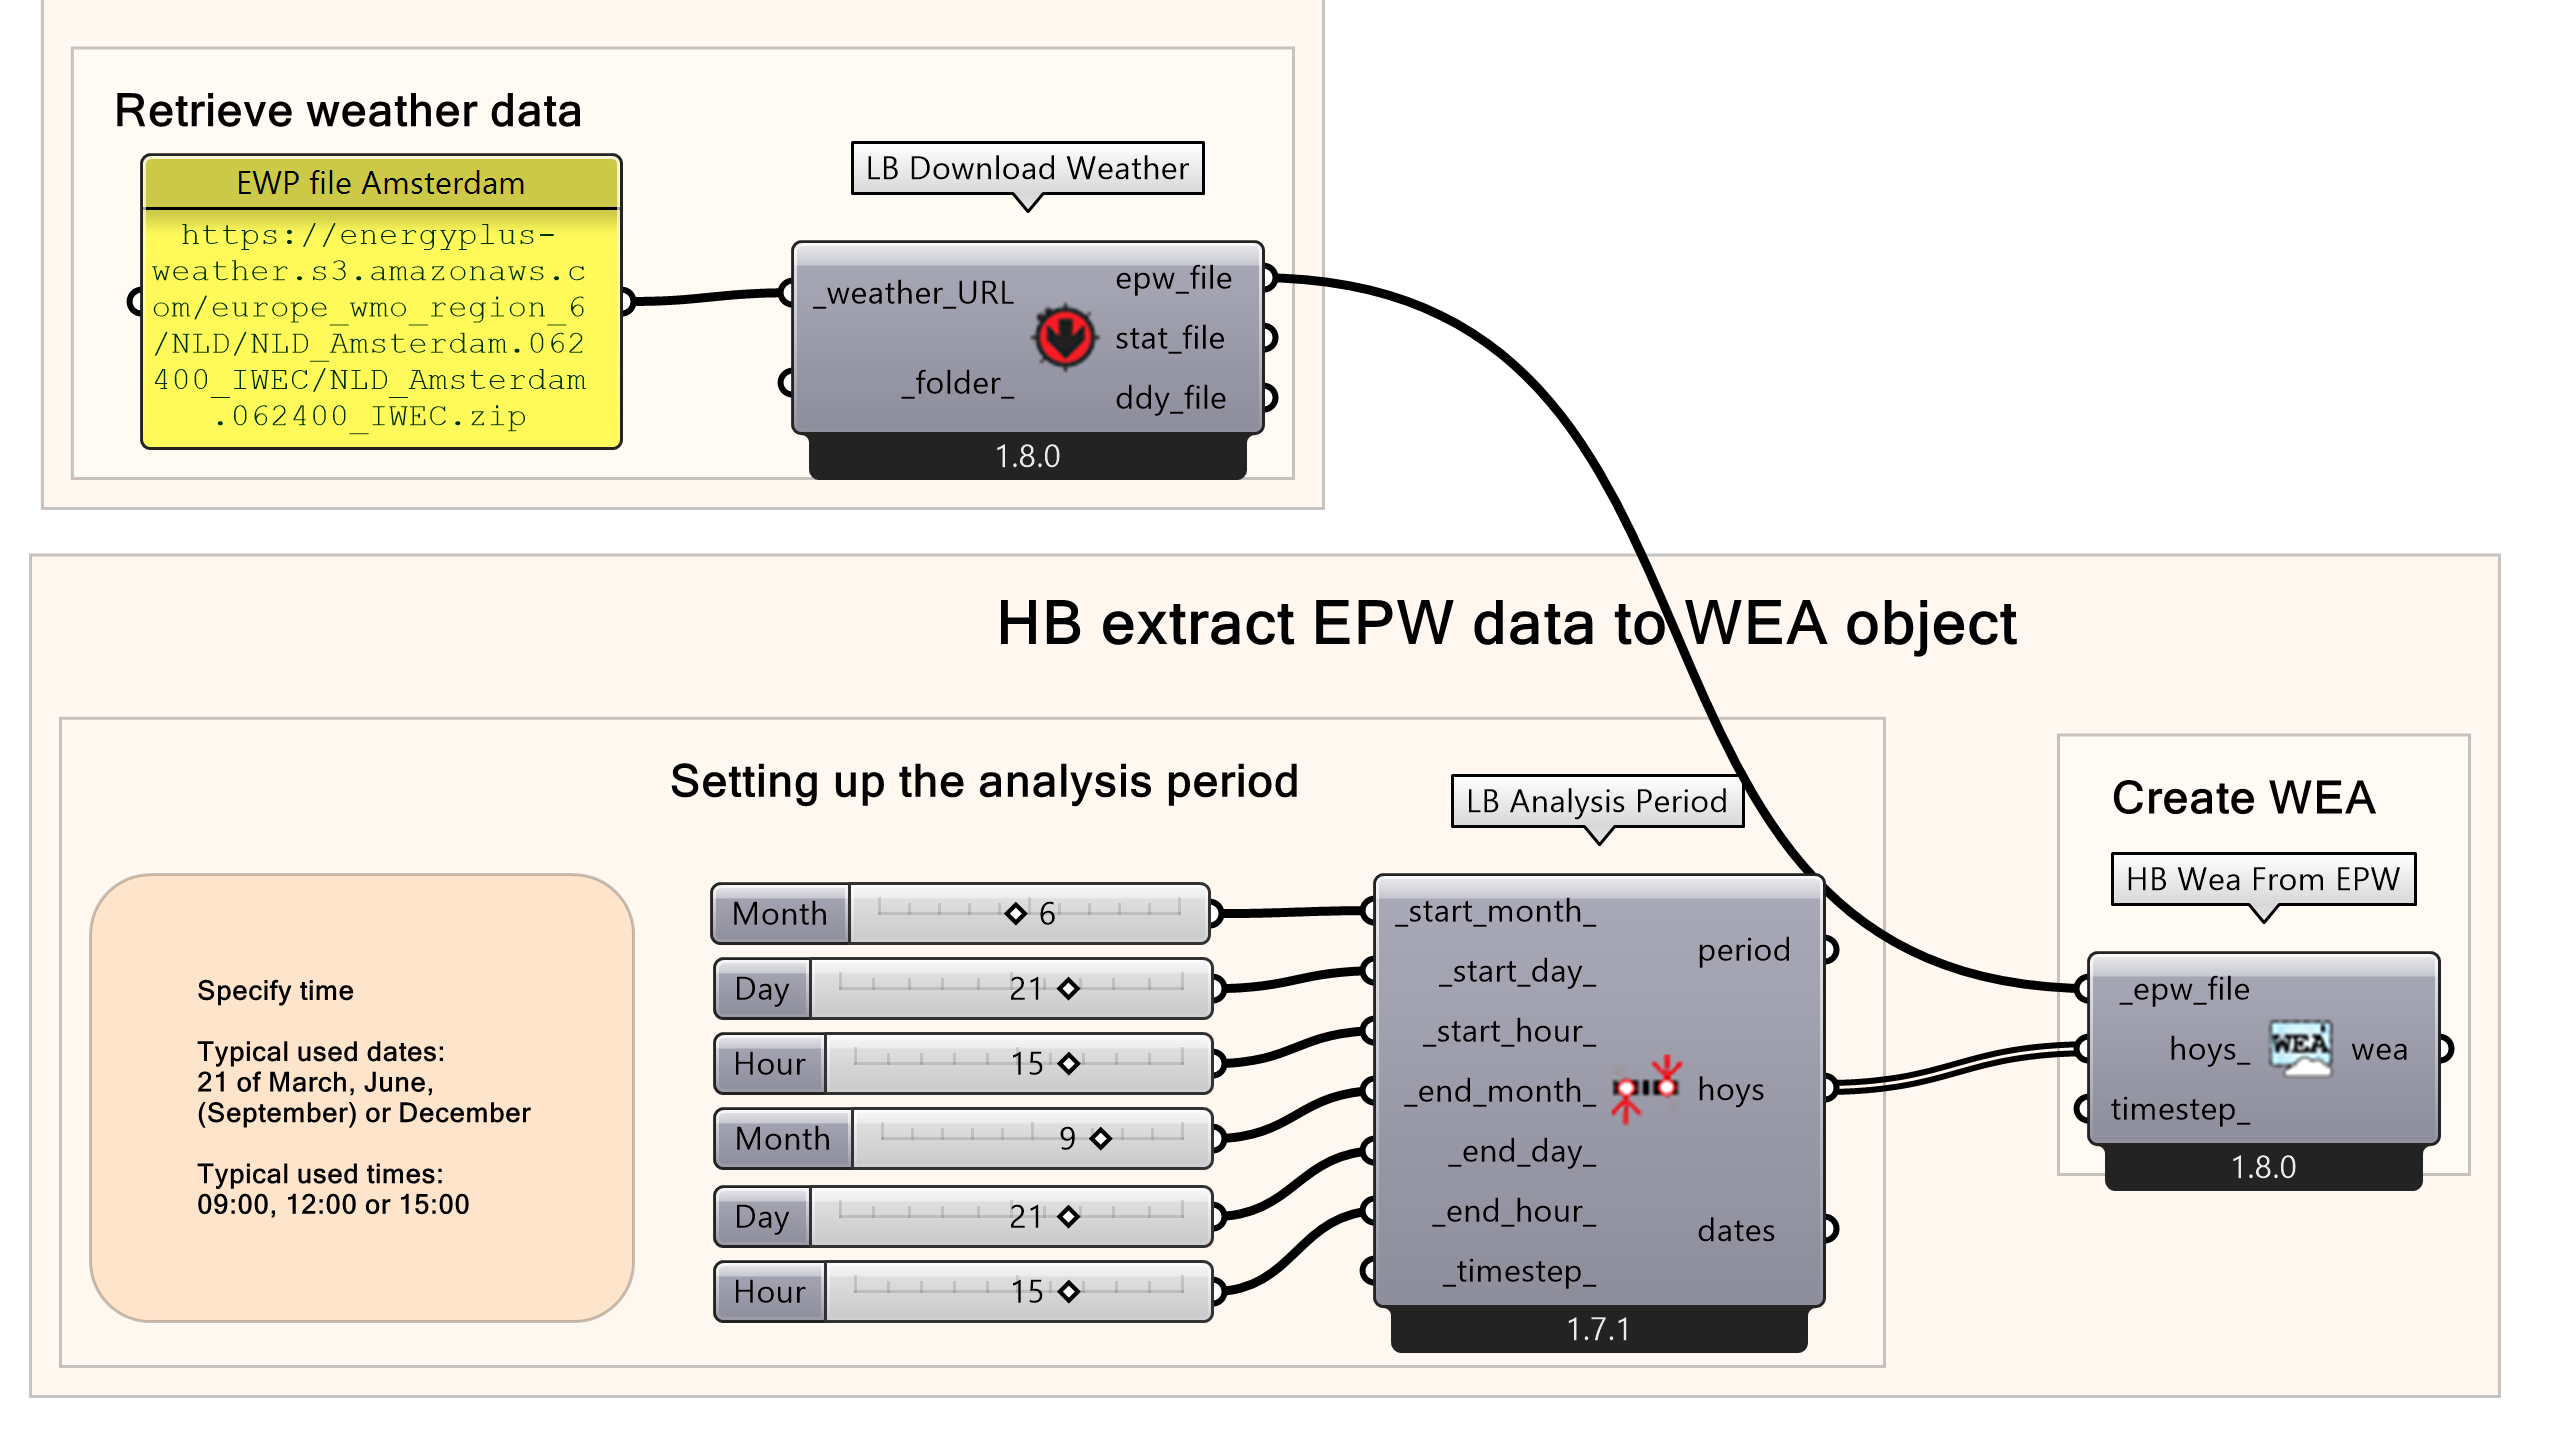
- Add a analysis period
- Specify period with sliders for every input you wish to define
- Connect the output hoys from LB Analysis period to the input hoys_ of
Note: Regarding the ‘_start_month_’ and ‘_end_month_’, you should put the indexes that correspond to the time period you want to calculate, without necessarily the index of the end having to be larger than the index of the start! For example, if you want to calculate only for the period from October to February, you can assign 10 to the ‘_start_month_’ and 2 to the ‘_end_month_’ input.
Ladybug Import Weather Files 4/5
Conclusionlink copied
After fishing this tutorial, you are able to import weather files for a specific location from the web, and visualize the weather data in graphs. Additionally, you are able to check if all the needed weather data is available and in good quality and select a specific time period of the weather file to use for your simulation.
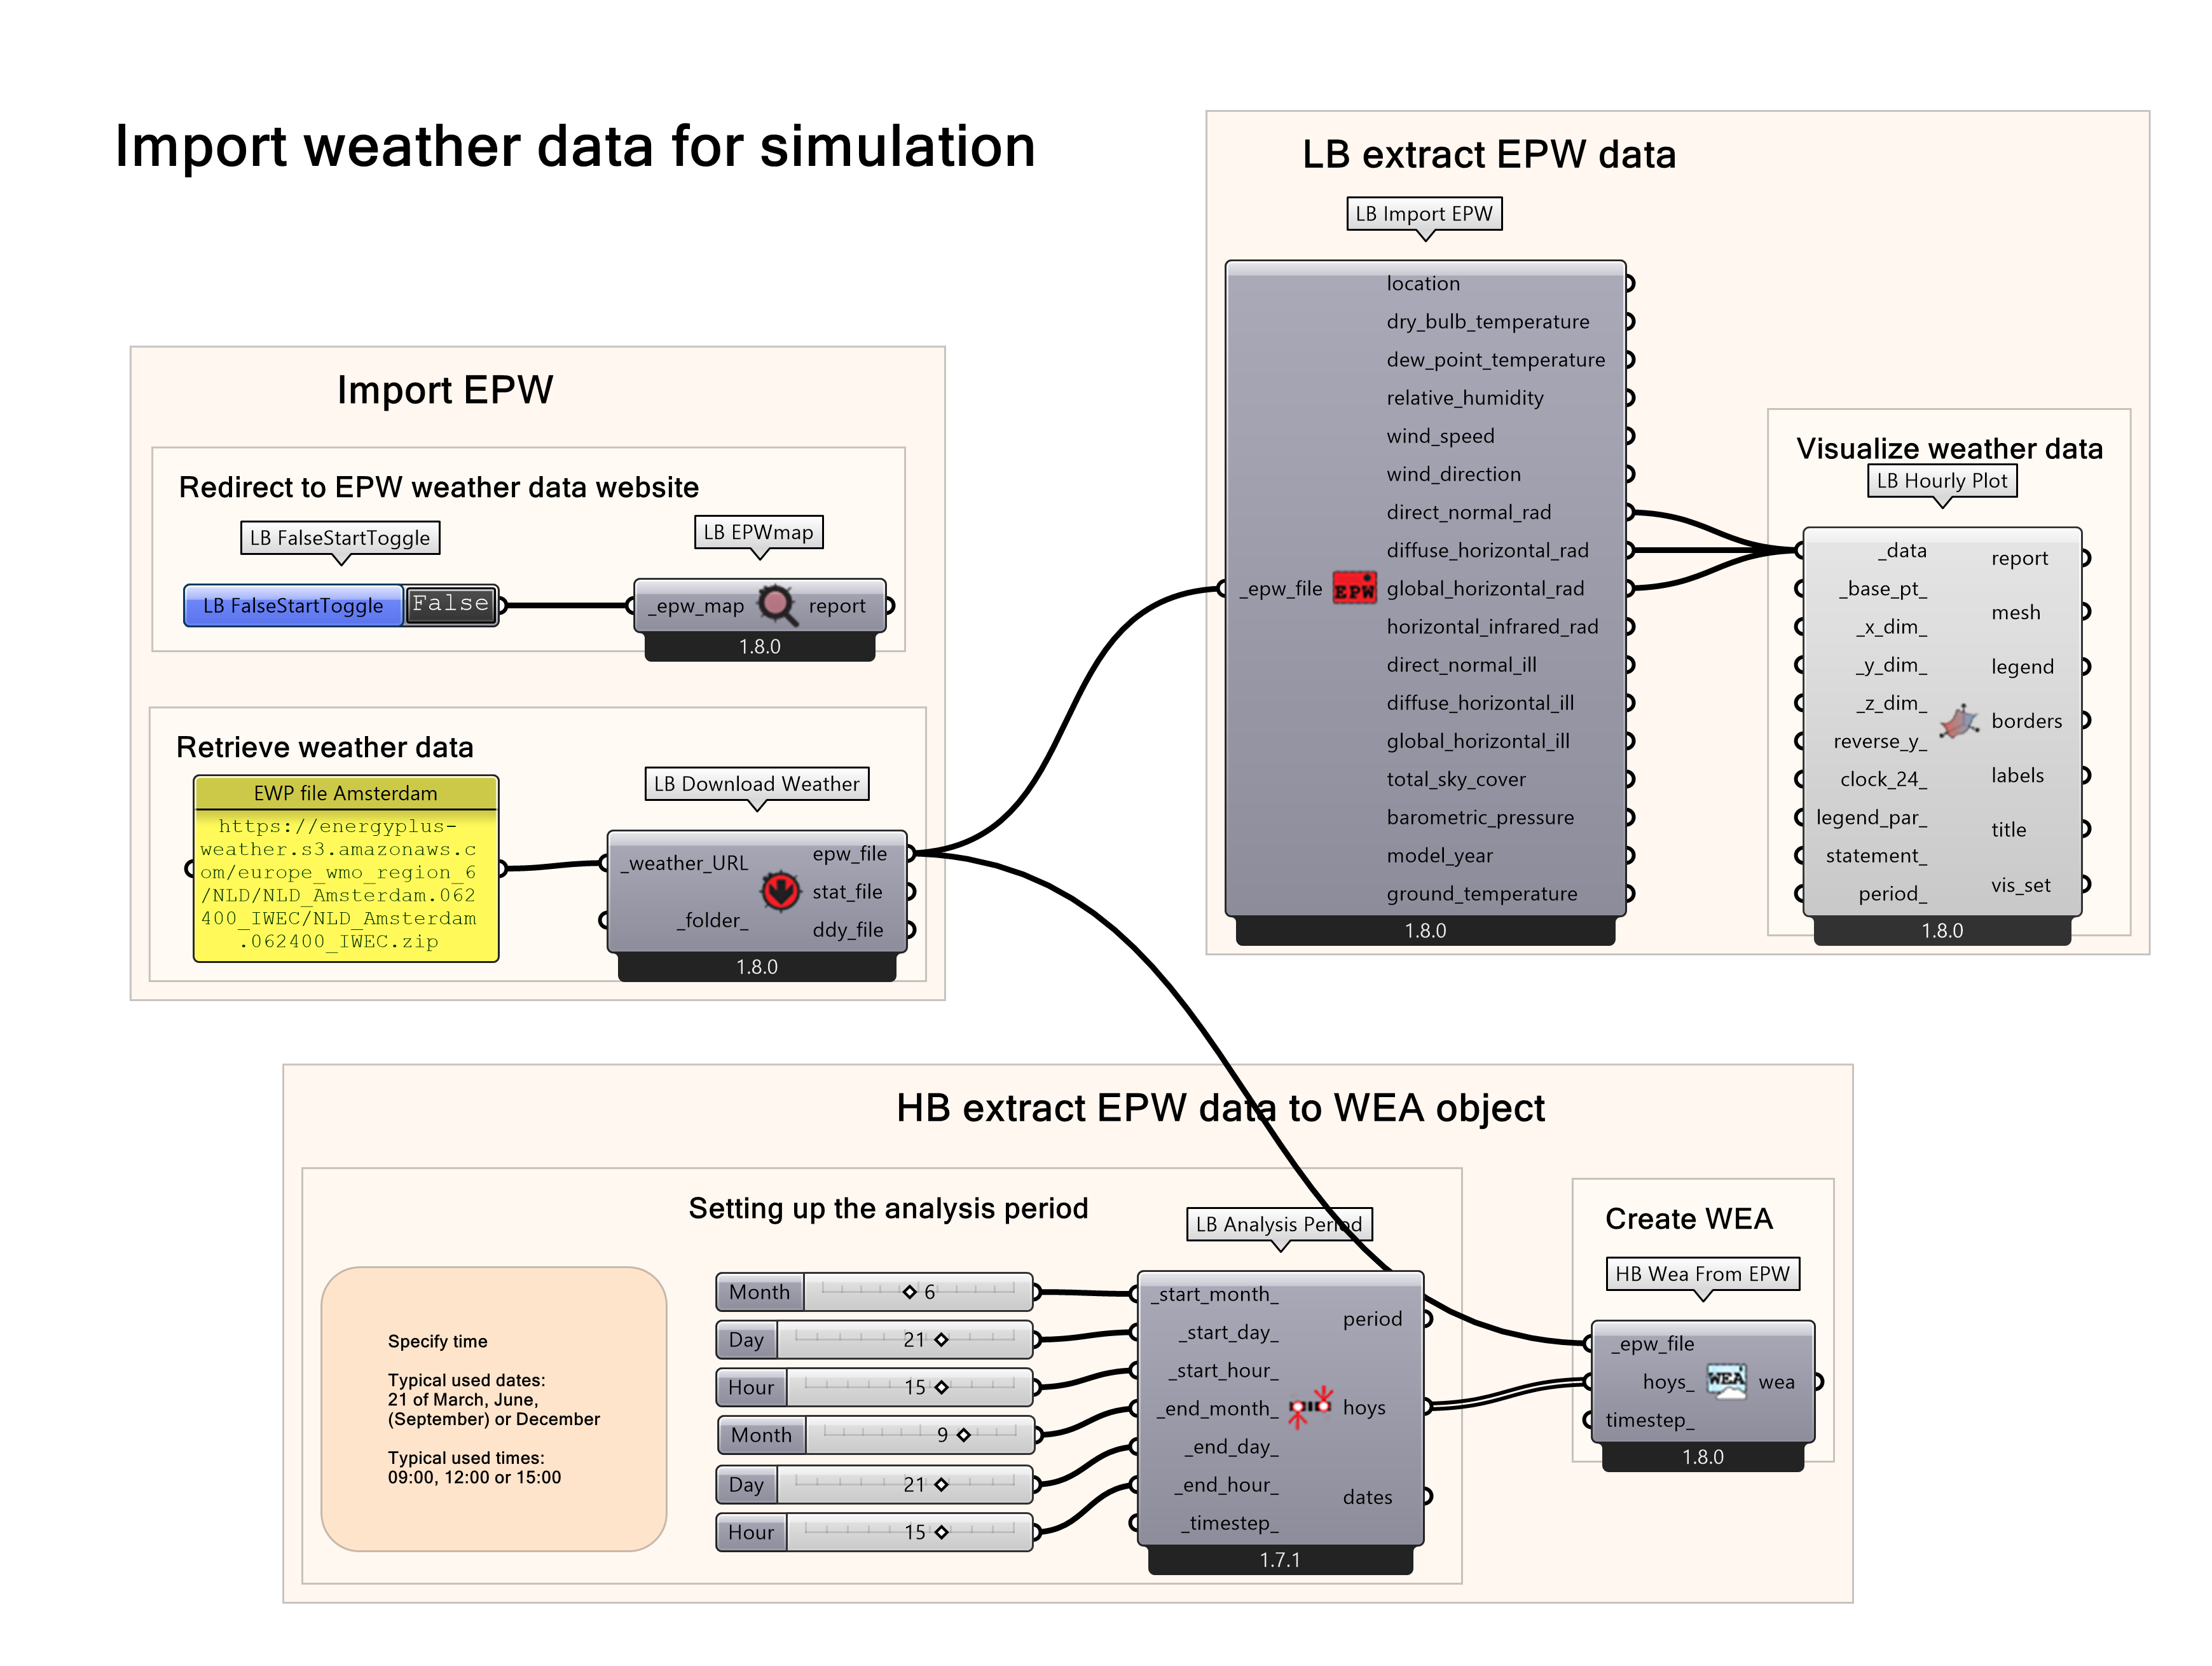
Final script
The final Grasshopper script of the LB importing weather files can be found here.
Ladybug Import Weather Files 5/5
Useful Linkslink copied
Follow up tutorials
The import of weather data is used for both daylight and energy simulations. In the following tutorials you can learn how to make a daylight and energy simulation with Honeybee.
External links
Ladybug weather website containing all EPW maps to download for your specific location:
Direct Normal Irradiation map from the solargis website to compare with the downloaded EPW data:
Write your feedback.
Write your feedback on "Ladybug Import Weather Files"".
If you're providing a specific feedback to a part of the chapter, mention which part (text, image, or video) that you have specific feedback for."Thank your for your feedback.
Your feedback has been submitted successfully and is now awaiting review. We appreciate your input and will ensure it aligns with our guidelines before it’s published.
