K-Means Clustering GH Façade Panels
-
Intro
-
Design
-
Creating Façade Panels
-
Feature Engineering
-
Clustering the Façade Panels
-
Conclusion
Information
| Primary software used | Grasshopper |
| Course | K-Means Clustering GH Façade Panels |
| Primary subject | AI & ML |
| Secondary subject | Machine Learning |
| Level | Intermediate |
| Last updated | February 25, 2025 |
Responsible
| Teachers | |
| Faculty |
K-Means Clustering GH Façade Panels 0/5
K-Means Clustering GH Façade Panels
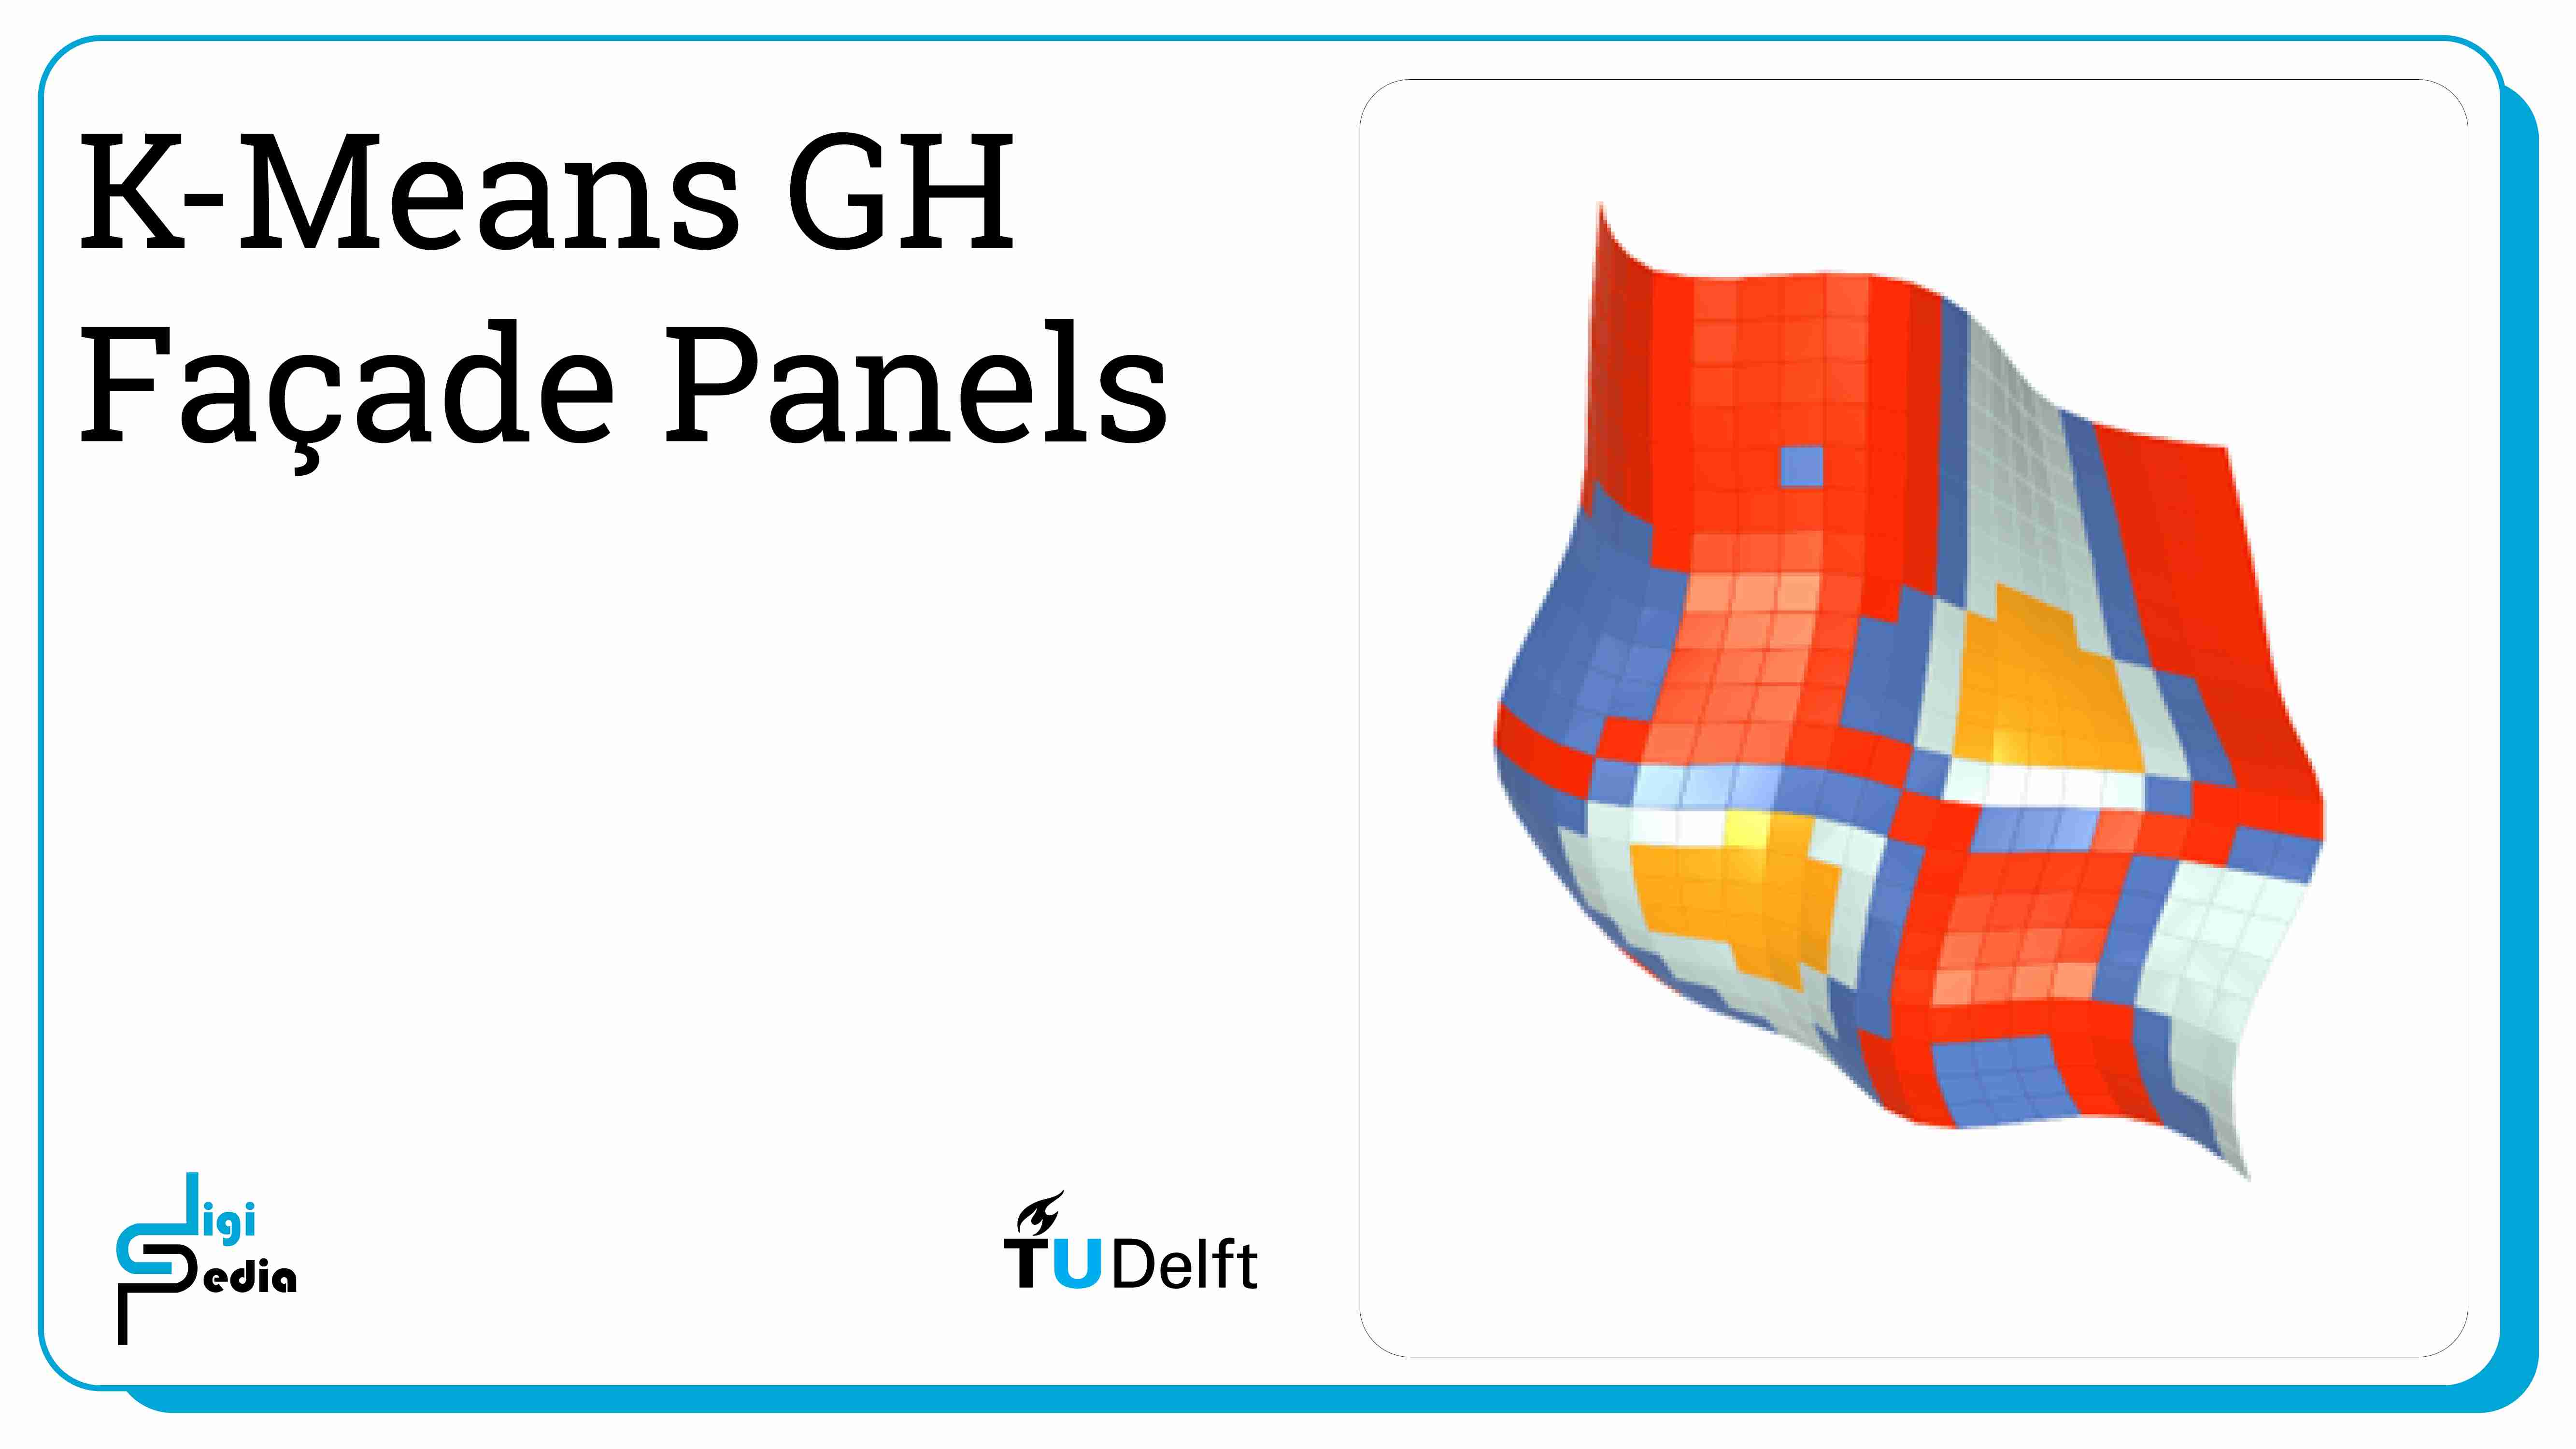
Cluster façade panel data in Grasshopper using the Lunchbox plugin, creating panels based on geometry features with K-Means clustering.
Welcome to the tutorial for façade panel clustering using the K-Means clustering method. For this tutorial, you will cluster data in Grasshopper using a popular Grasshopper plugin called Lunchbox. In this tutorial we show how to create façade panels in Grasshopper and cluster them based on sets of features that describe the geometry.
K-Means Clustering GH Façade Panels 1/5
Designlink copied
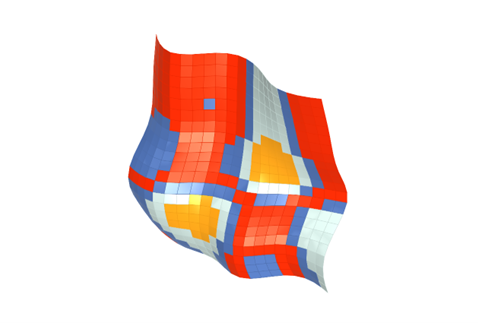
The design exercise starts with creating a complex 2D surface that has double-curvature. Then, we panelise the surface to create roughly equal sizes but because the surface has double-curvature, not all panels are exactly equal. Then, we describe the geometry using different feature sets to feed the features set to the clustering algorithm to help us determine the panels that are similar to one another. The potential application for this exercise is to rationalize complex geometry to create a surface with only a selection of panels.
K-Means Clustering GH Façade Panels 2/5
Creating Façade Panelslink copied
For this exercise, we want to explore a complex façade geometry such as a double-curved surface.
First, use four Gene Pool components in pink as multiple variable inputs that we use here to determine the characteristics of the curves for which we later construct the surface with using Network Surface component on Grasshopper.
- Setup four Gene Pool panels. Double click the gene pool to enter the GeneList Editor. Set the gene count to 6, decimals to 2, minimum 0.00, maximum 2.00.
- Connect the Gene Pool output to List Length and connect the output to a series component.
- Construct points based on the sliders. For the first set of coordinates connect the Gene Pool to Z and the series to X. For the second set of coordinates connect the Gene Pool to X and Z and the series to X. For the third set of coordinates connect the Gene Pool to Z and the series to Y. For the fourth set of coordinates connect the Gene Pool to X and Z and the series to Y.
- Connect the coordinates to the Interpolate component to create a line from the points.
- Then, using Network Surface component connect two of the curves to Network Surface “Curve U” input, and the other two curves to “Curves V” input. Now you have a surface to work with!
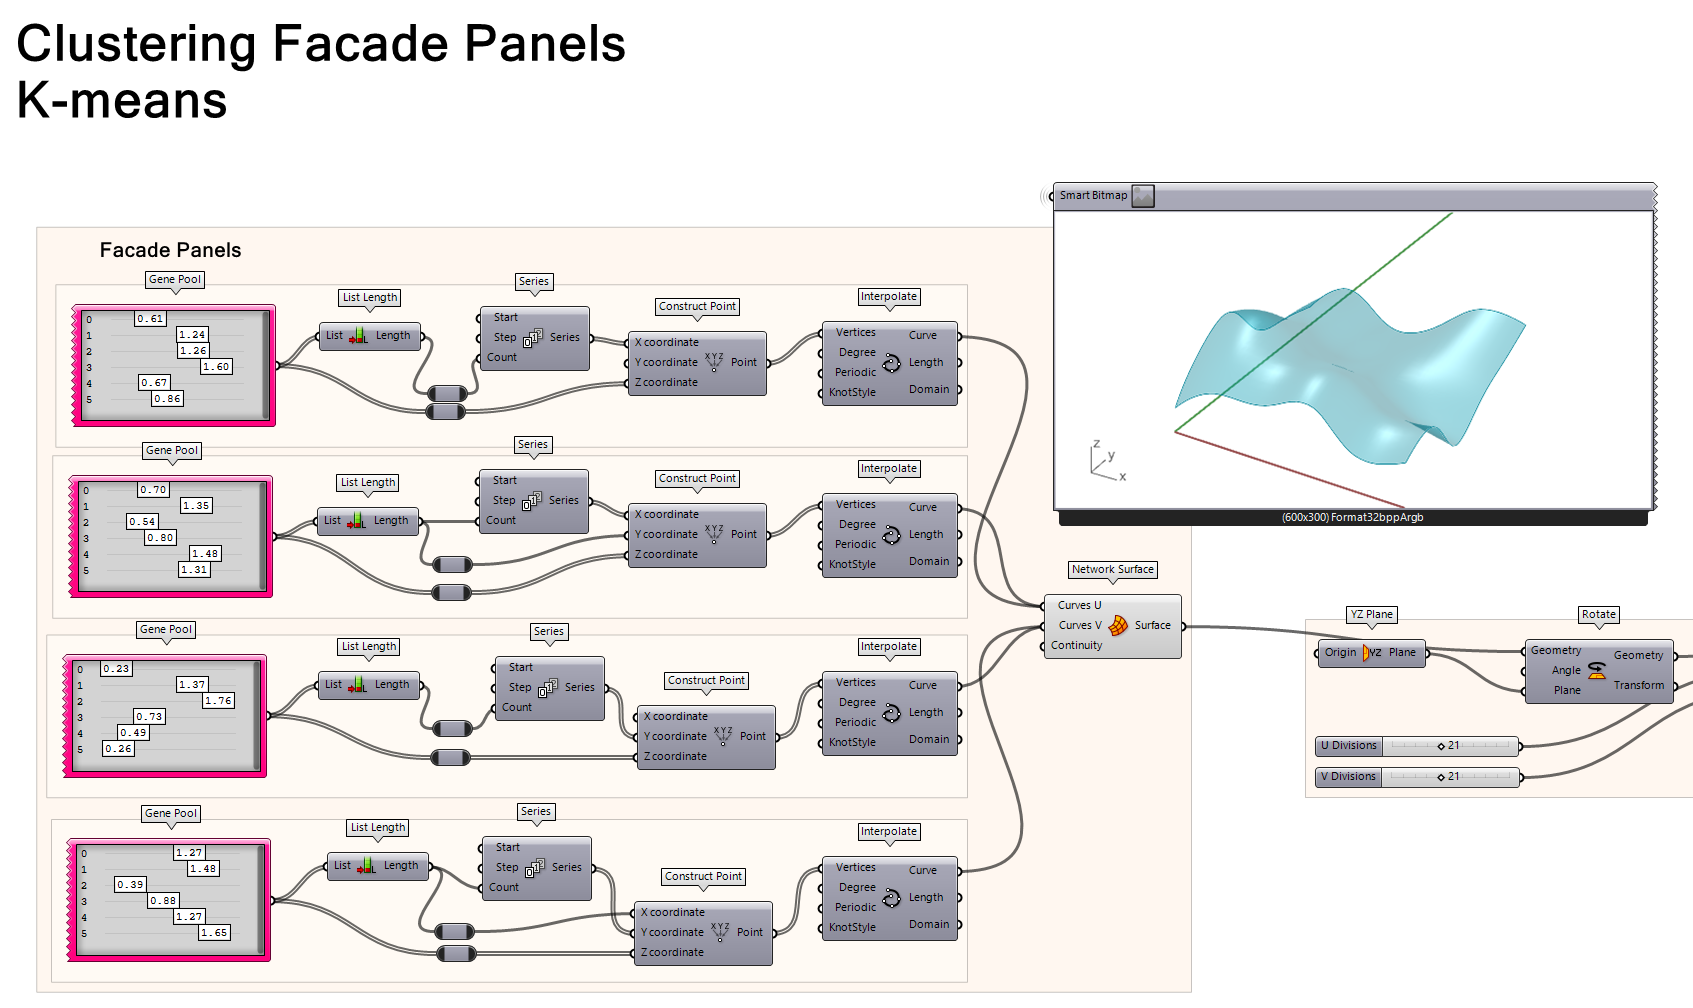
Go ahead and view the 4 interpolated curves and edit the gene pool variables to see what the surface is made of, and you can adjust it.
Panelization of a Surface
Using LunchBox Panelization components, we can divide the surface into regular grid-sized shapes. For this, we use the component Quad Panels. The surface was made on the XY plane which is horizontal. As this is our building facade, it is necessary to rotate it so it is vertical.
- Connect the surface to YZ Plane component to rotate on that plane.
- Using the Rotate component, connect the YZ Plane output into the Plane input of Rotate and connect the surface geometry to the Geometry input of Rotate.
- Set two number sliders from 0 to 50, connect them to Quad Panels U and V Divisions and connect the rotate geometry to Surface.
- Once your surface is rotated, connect the output of the panels to a Surface component and right click it and choose Reparametrize.
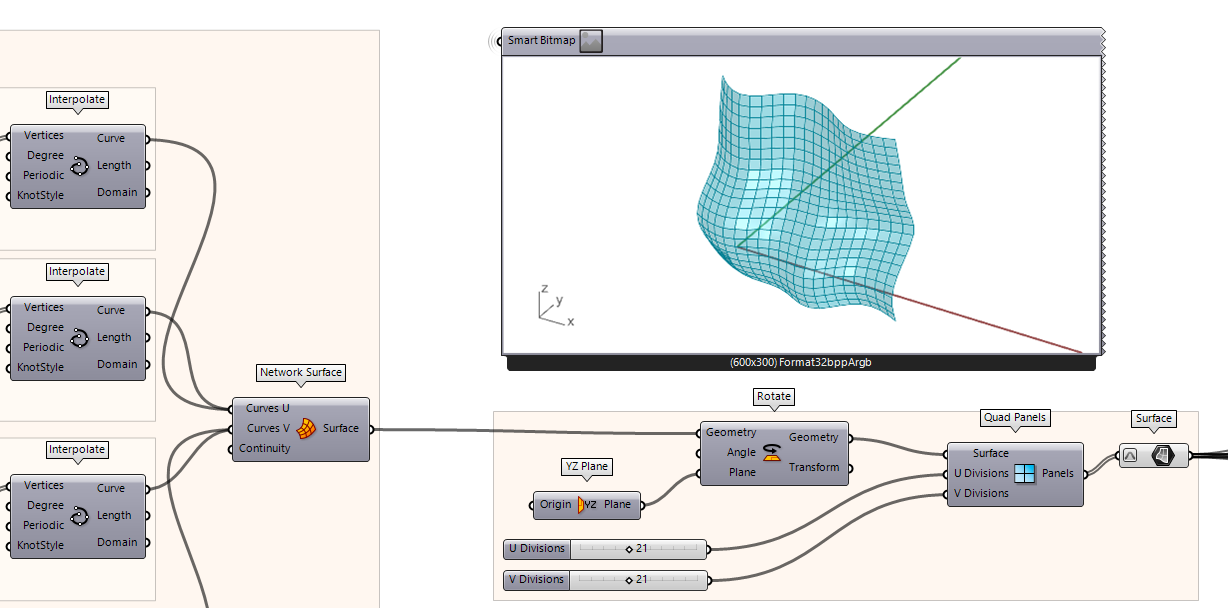
Go ahead and adjust the U and V divisions of Quad Panels to see how they change.
K-Means Clustering GH Façade Panels 3/5
Feature Engineeringlink copied
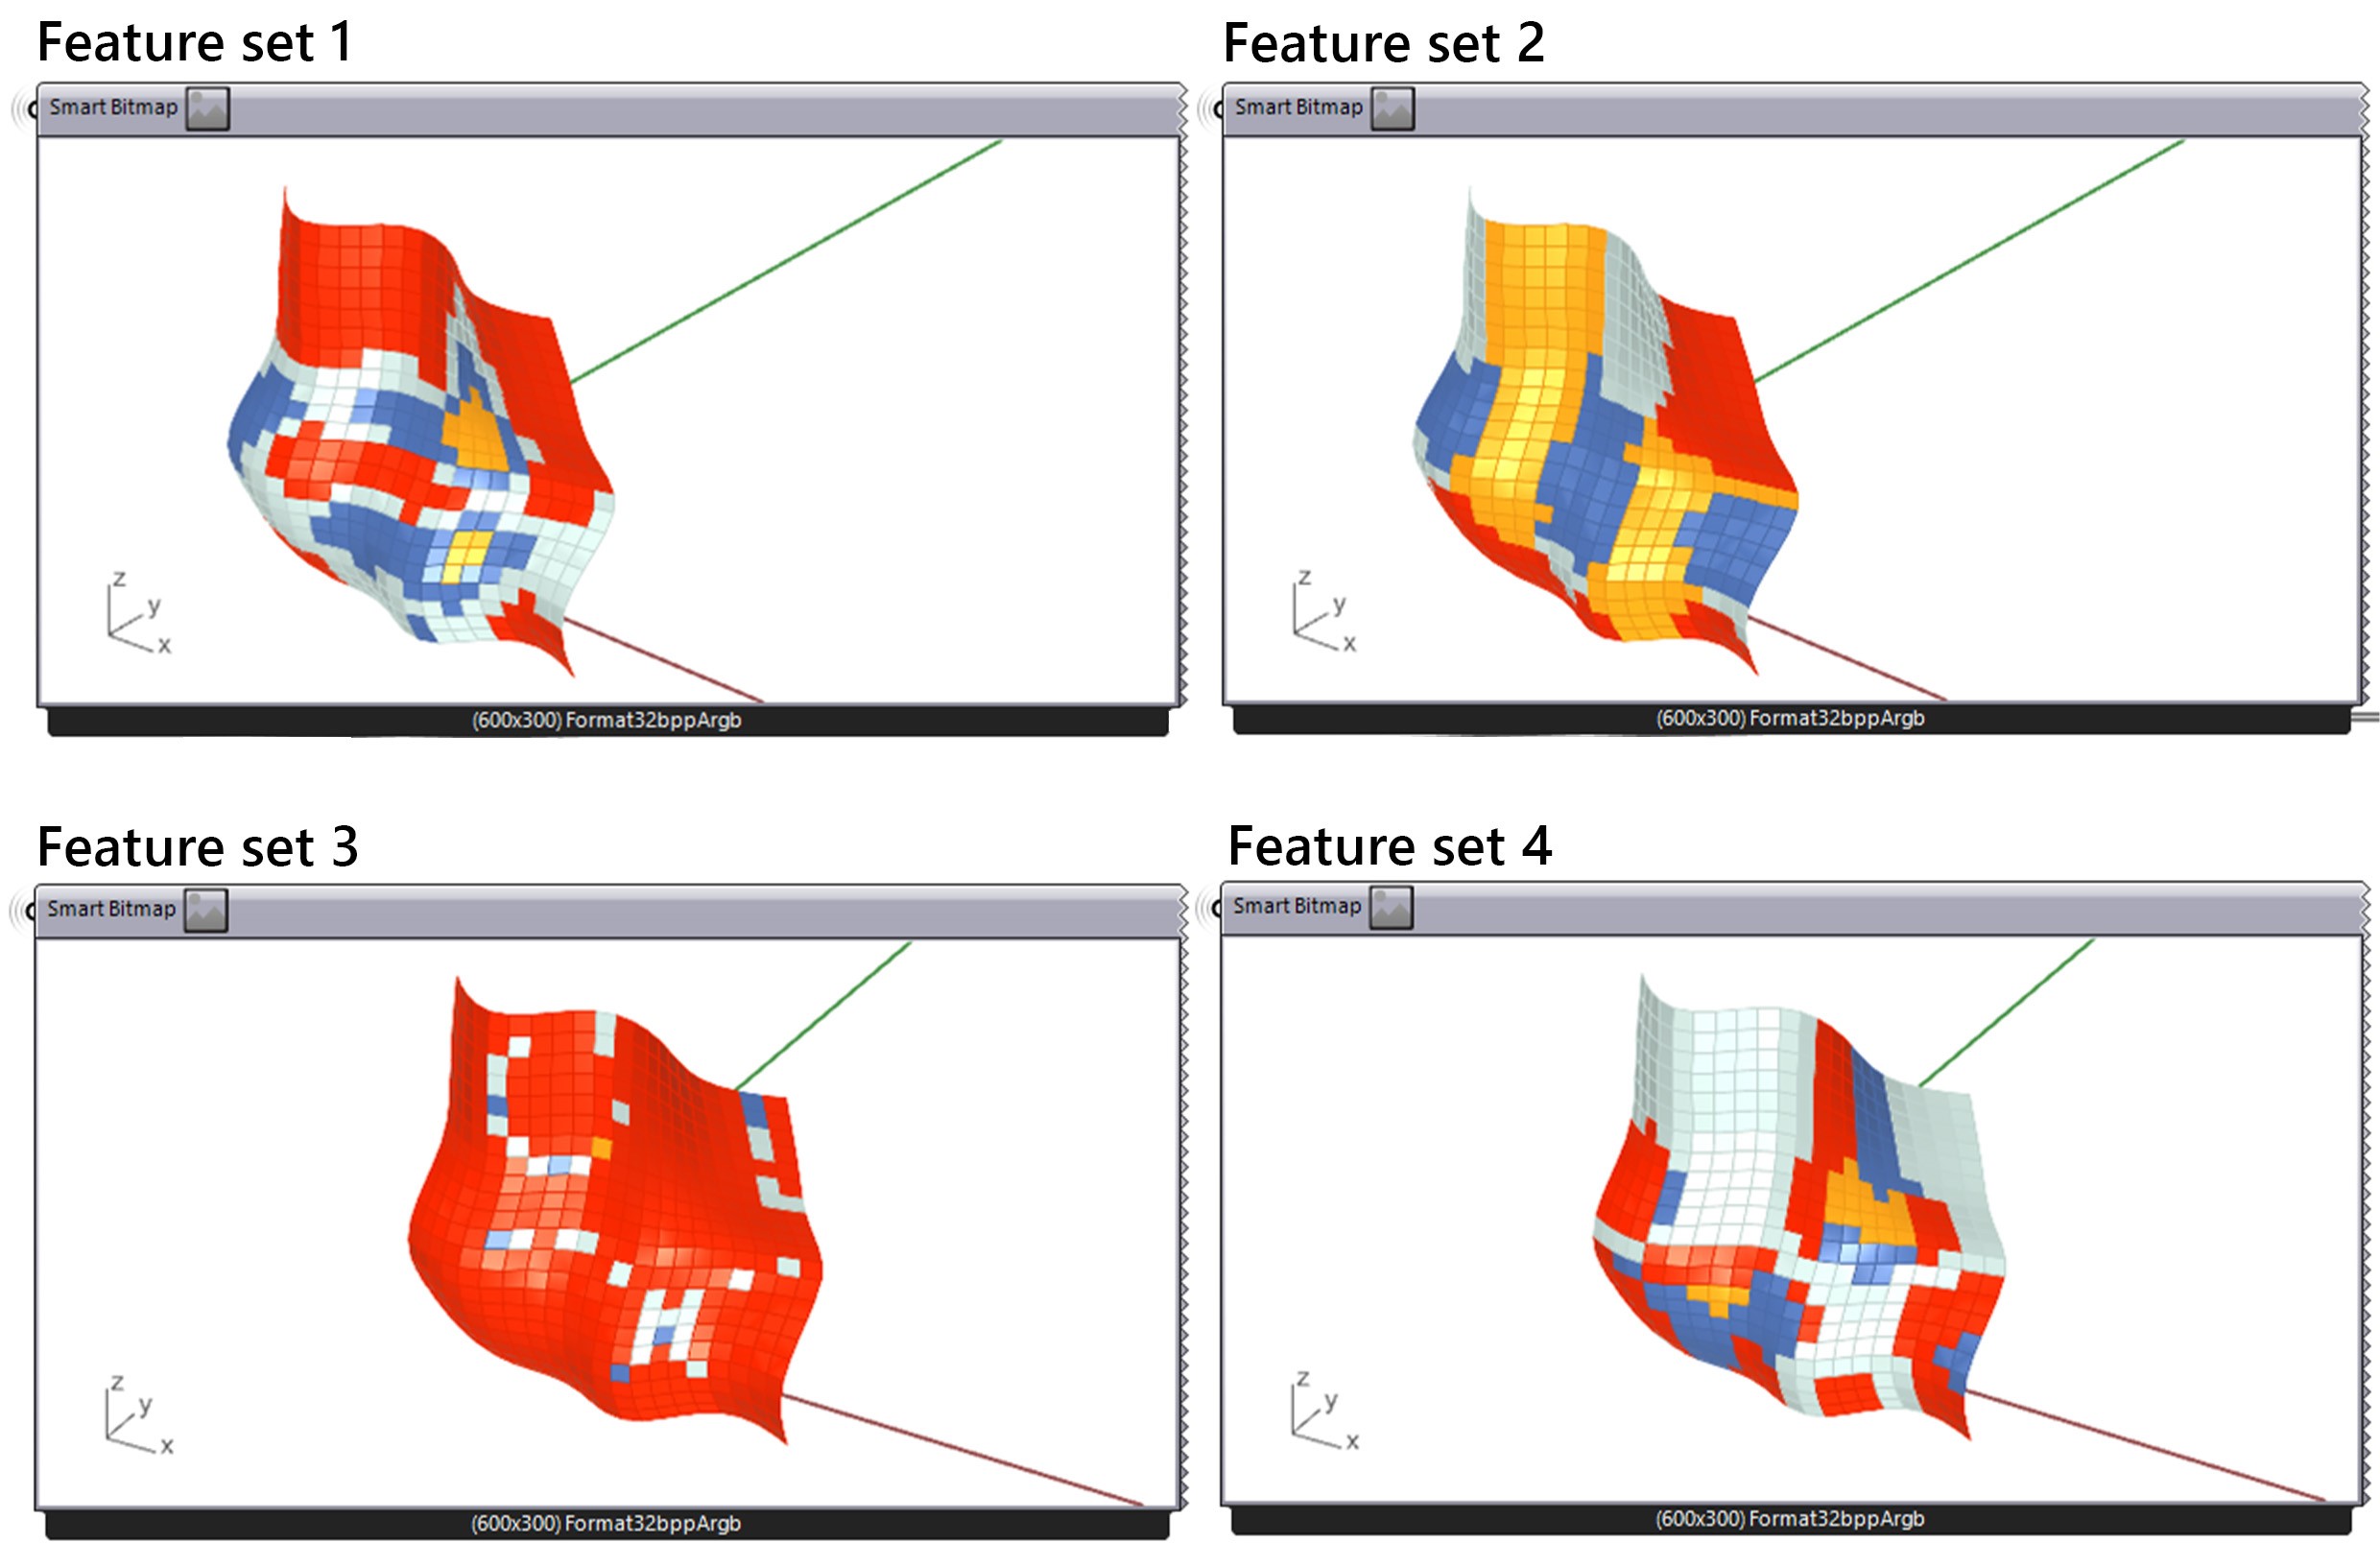
In this part we will explore how we can describe our geometry using their unique properties such as area and edge lengths. The features sets are used as indicators to identify which panels are more similar to others. In this tutorial we will create 2 different feature sets to see how they impact the clustering method. This tutorial will focus on the features of the panels used. To learn more about feature engineering, see this tutorial.
Feature Set 1
Feature Set 1 will contain only 2 features the area of each panel and the perimeter of the panel (the combined length of the panel edges). To measure these metrics, we first deconstruct the panel to take the surface area and edges.
- Use the Deconstruct Brep component to extract its edges.
- Join all the curves together using the Join Curves component.
- Get the edge length.
- Plug the panels into the Area component.
- Now Entwine those two features together.

Feature Set 2
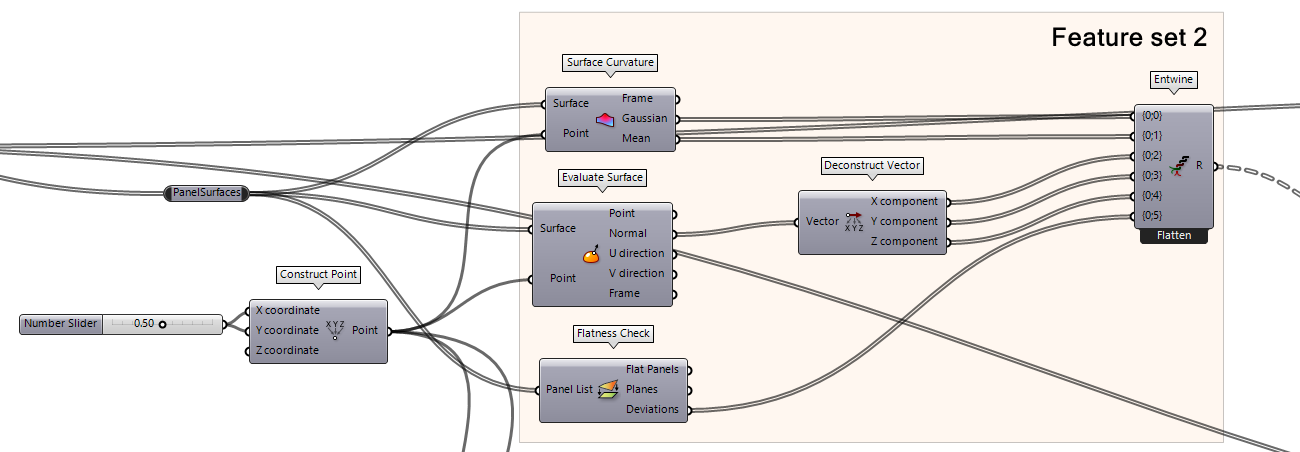
The second feature set will consider other panel features. The features will include information about the curvature (the Guassian and Mean values of curvature), the normal, and how much the panel deviates from being flat. These features are used to describe the curvature instead of only focusing on panel size like Feature Set 1. To make the second feature set you need a few components. These components evaluate the surface at a specific point, therefore you need to create a point on the surface.
- Construct a point and set the X and Y coordinates to 0.5 each, and Z coordinate remains 0. This will be in input for the Surface Curvatue and Evaluate Surface components.
- From Surface Curvature component, connect the geometry inputs of the panels and the point we created
- From the Evaluate Surface component, connect the geometry inputs of the panels and the point we created.
- Deconstruct the Normal outputs from Evaluate Surface.
- Use the Flatness Check and connect the panels to the Panel List input.
- Now Entwine all the inputs together. The entwined data includes Gaussian and Mean from Surface Curvature, X, Y, and Z from the deconstructed vector from the Normal output of Evaluate Surface, and the Deviation of Flatness Check.
NOTE: As discussed, feature selection is an important process in preparing your data. You can use the noted features and others to cluster your panels in a meaningful way. The features that are most important will vary based on your design.
Feature Set 3
The third feature set will consider the principal osculating circle of the surface. This feature will include information on the arc radius extracted from the Osculating Circles component in Grasshopper. These features are used to describe the radius of both principal circles in relation to the panel.
- Similar to Feature Set 2, construct a point. Set the X and Y Coordinates on the Construct Point to 0.5 each, and Z coordinate remains 0. This will be in input for the osculating circles component. If you already have this input from Feature Set 2, use the same output for the next step.
- Create an Osculating Circles component. Connect your Construct Point coordinate output into the Point input. Connect your panels geometry into the Surface input for the Osculating Circles.
- Create a Deconstruct Arc component. Connect both first and second circle outputs into two separate Deconstruct Arc components. This will give us the radius output for each circle.
- Using an Entwine component, connect the two radius outputs from the Deconstruct Arc components into the Entwine inputs.

Feature Set 4
The fourth feature set will consider the principal minimum and maximum absolute principal curvature extracted using the Principal Curvature component in Grasshopper. These two features are used to describe principal curvature in relation to the panel.
- Similar to Feature Set 2 and 3, construct a point. Set the X and Y Coordinates on the Construct Point to 0.5 each, and Z coordinate remains 0. This will be in input for the osculating circles component. If you already have this input from Feature Set 2 and 3, use the same output for the next step.
- Create a Principal Curvature component. Connect your Construct Point coordinate output into the Point input. Connect your panels geometry into the Surface input for the Principal Curvature.
- Using an Entwine component, connect the two minimum and maximum curvature outputs from the Principal Curvature component into the Entwine inputs.

NOTE: As discussed, feature selection is an important process in preparing your data. You can use the noted features and others to cluster your panels in a meaningful way. The rest of the tutorial will use Feature Set 1 and 2. The features that are most important will vary based on your design. Select the ones shown (or others you create) that are relevant to you.
K-Means Clustering GH Façade Panels 4/5
Clustering the Façade Panelslink copied
In this step we view the clustering results based on our feature sets.

Clustering the Panels using K-Means
Different clustering techniques will provide different results. For an overview of different clustering techniques and applications see this tutorial.
Follow the steps below:
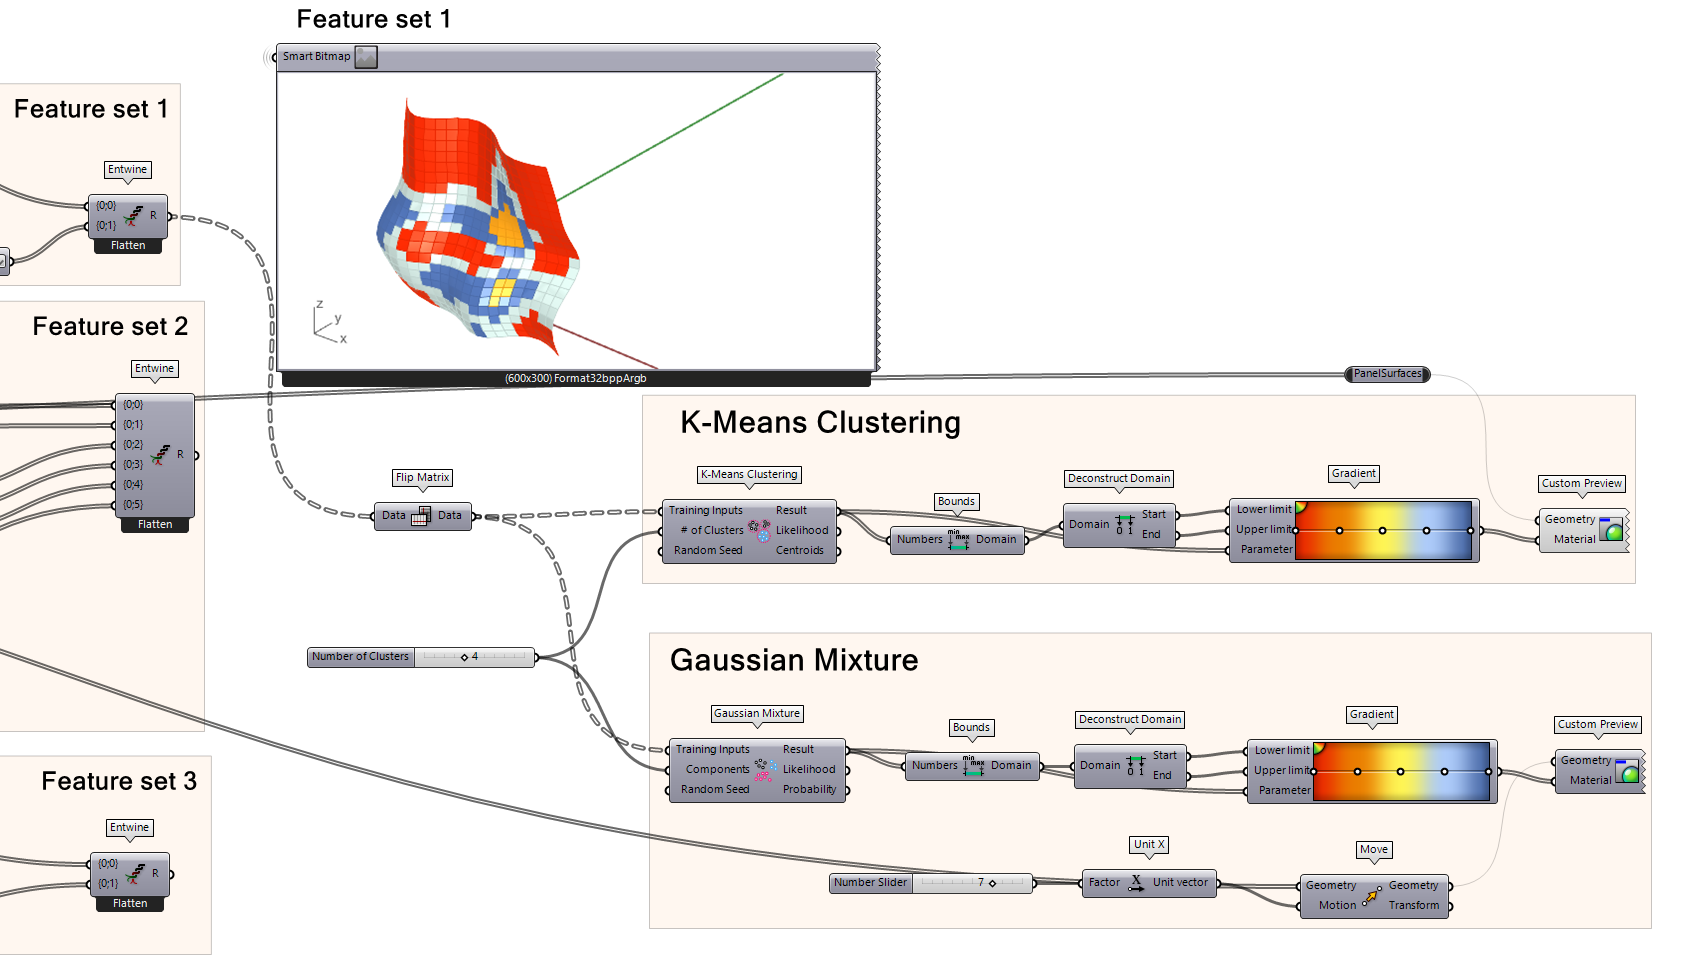
- Use the Flip Matrix component so that the clustering algorithm can read your data.
- Add your clustering algorithm from K-Means Clustering. And connect the flipped matrix into the training inputs, add a number slider to decide the number of your clusters (recommended range from 3 to 6 but feel free to experiment.
- Then to visualize the clustering results, connect the clustering results to Bounds component. Then connect the domain to Deconstruct Domain.
- Connect the Start and End domain from the Deconstruct Domain in previous step to a Gradient components’ Lower and Upper Limit inputs. Finally, connect the clustering results to Parameter.
- Once that’s setup, connect the gradient to a Custom Preview. Connect the gradient to Material and the geometry of the panels (from the reparametrized surface at the beginning of the script) and view your results!
You can also experiment with different clustering components, for example, Gaussian Mixture which is setup the same way as the K-Means Clustering but you replace the K-Means Clustering component with the Gaussian Mixture component.
K-Means Clustering GH Façade Panels 5/5
Conclusionlink copied
After this tutorial, you will be able to create a sample panelised façade, experiment with different feature sets, and cluster data based on their selected features.

Final exercise file
You can download the final exercise file of this tutorial below.
Useful links
this is a test
Write your feedback.
Write your feedback on "K-Means Clustering GH Façade Panels"".
If you're providing a specific feedback to a part of the chapter, mention which part (text, image, or video) that you have specific feedback for."Thank your for your feedback.
Your feedback has been submitted successfully and is now awaiting review. We appreciate your input and will ensure it aligns with our guidelines before it’s published.
