Hyperparameter Tuning for Supervised Learning
-
Intro
-
Design
-
Hyperparameter Tuning Introduction
-
Loading the Dataset
-
Tuning Classification Model
-
Tuning Regression Model
-
Conclusion
Information
| Primary software used | Python |
| Software version | 1.0 |
| Course | Hyperparameter Tuning for Supervised Learning |
| Primary subject | AI & ML |
| Secondary subject | General |
| Level | Intermediate |
| Last updated | December 19, 2024 |
| Keywords |
Responsible
| Teachers | |
| Faculty |
Hyperparameter Tuning for Supervised Learning 0/6
Hyperparameter Tuning for Supervised Learning
Intro, we are predicting how satisfied people are with their house. To do so we will use random forest classification.
Hyperparameter Tuning for Supervised Learning 1/6
Designlink copied
Overview
To discuss and understand hyper parameter turning, we will use the cleaned version of the following data set:
- The WoOn 2021 survey Citavista – Nieuw
Hyperparameter Tuning for Supervised Learning 2/6
Hyperparameter Tuning Introductionlink copied
Importance of hyperparameter selection
- max_depth
- max_features
- n_estimators
- random_state
Random State
We will also assign a random state so we can have the same results every time we run the code. Much of the machine learning code uses a random integer to initialize the algorithm. By assigning an integer to the random_state variable in the different functions, we will have the same results every time we run the code. Using a variable that is set here, allows you to change it in only one place. Set the random_int value here. If you choose any integer, it will give the same results every time you run the rest of the notebook. If you set random_int to None, then you will always have different results when you run the notebook.

Random Forest / Decision Trees -> Number of estimators
The Random Forest algorithm trains a certain number of Decision Trees and uses the most common resulting output as the resulting value for a data point. First, we will train a model using the default settings. It is important to keep in mind that this model will likely perform the best because the default value for the “maximum depth” parameter of the algorithm is none. When “maximum depth” is none, the model continues to split until all leaves are pure. This leads to overfitting. So, after seeing the performance with default parameters, we will turn certain hyperparameters including the maximum depth and maximum features. We will use 200 for the number of estimators and default settings for the other hyperparameters.
Hyperparameter Tuning for Supervised Learning 3/6
Loading the Datasetlink copied
Loading the dataset
In this case, we will load the clean data set from a CSV file into a Pandas Dataframe. If you need additional information about loading a dataset, review the Clean Data Set tutorial which provides more details.
Remember to update the folder location highlighted in blue.

Now that we loaded a clean data set, we can train a model with it. To have a high-performing machine learning model, we need to adjust the hyperparameters this is similar for the classification and regression models. The following section walks through those steps.
Hyperparameter Tuning for Supervised Learning 4/6
Tuning Classification Modellink copied
Overview
When adjusting hyperparameters, we need to somehow evaluate the model performance. A classification model will be evaluated by its accuracy. This is the number of predicted values that the model has gotten correct when compared to the true classification value.
Extracting Dataset to Input and output
In this training data set, there are several factors that we can use as either an input or an output. In this case, we will predict the ‘twoning’ which is a survey response of the respondent’s satisfaction with their current home. This response is one of 5 classes (1 to 5) with 1 being very satisfied and 5 being very dissatisfied. We are going to determine which features are most important in determining people’s satisfaction with their home. This means that we will extract this data as our Y value or our predicted value. The rest of the columns will be the X value, or the feature values.

Train/Test Split
Random forest does not require normalizing data, but we must split it into training and test sets.

Tuning Hyperparameters of a Random Forest Model
First, we will train a baseline classification model to which to compare against. Then we will tune certain hyperparameters including the maximum depth and maximum features. We will use 200 for the number of estimators and default settings for the other hyperparameters. Remember that this model with the default settings will likely perform the best because the default value for maximum depth is none which means that model continues to split until all leaves are pure. This leads to overfitting.
We start by training a baseline algorithm with the following hyperparameter settings:
- n_estimators=200
- random_state=random_int

Next, we will find the optimal max_depth value by testing different max_depth values and plotting the accuracy.
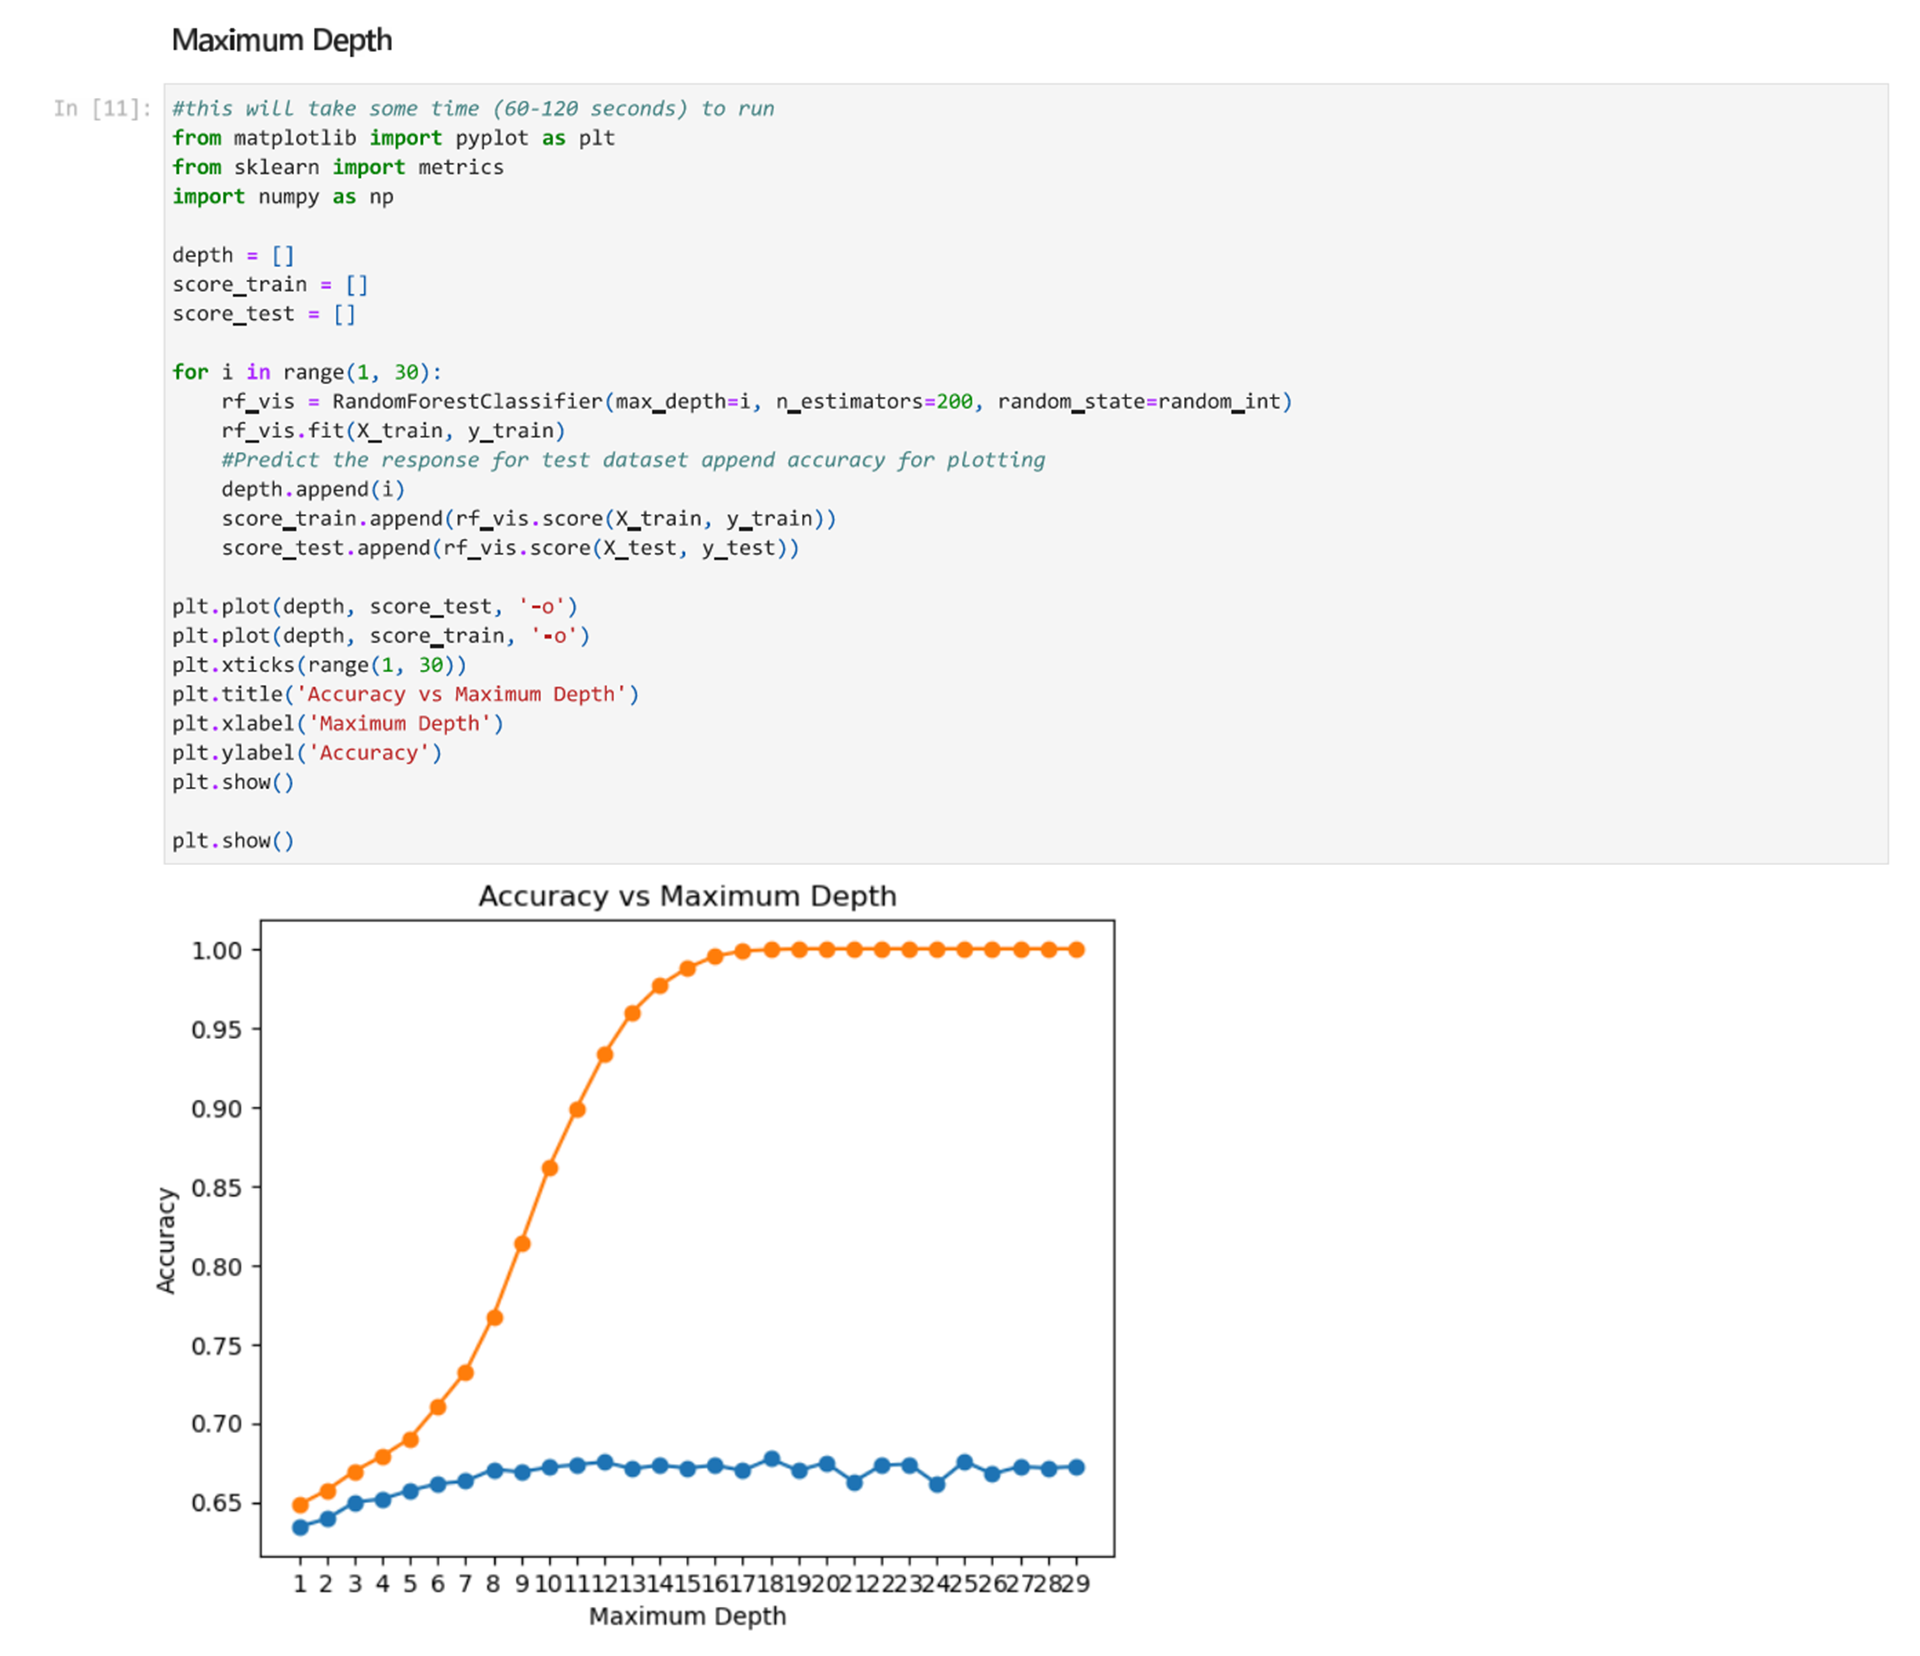
From the above noted plot, we can see that setting the maximum depth at 5 or 6 is a good option. We want to select a number that is at a point where the curve of the training data slightly flattens before a steep increase in accuracy and where the curve for the test data is fairly flat.
Next, we will find the optimal max_features value by testing different values and plotting the accuracy.
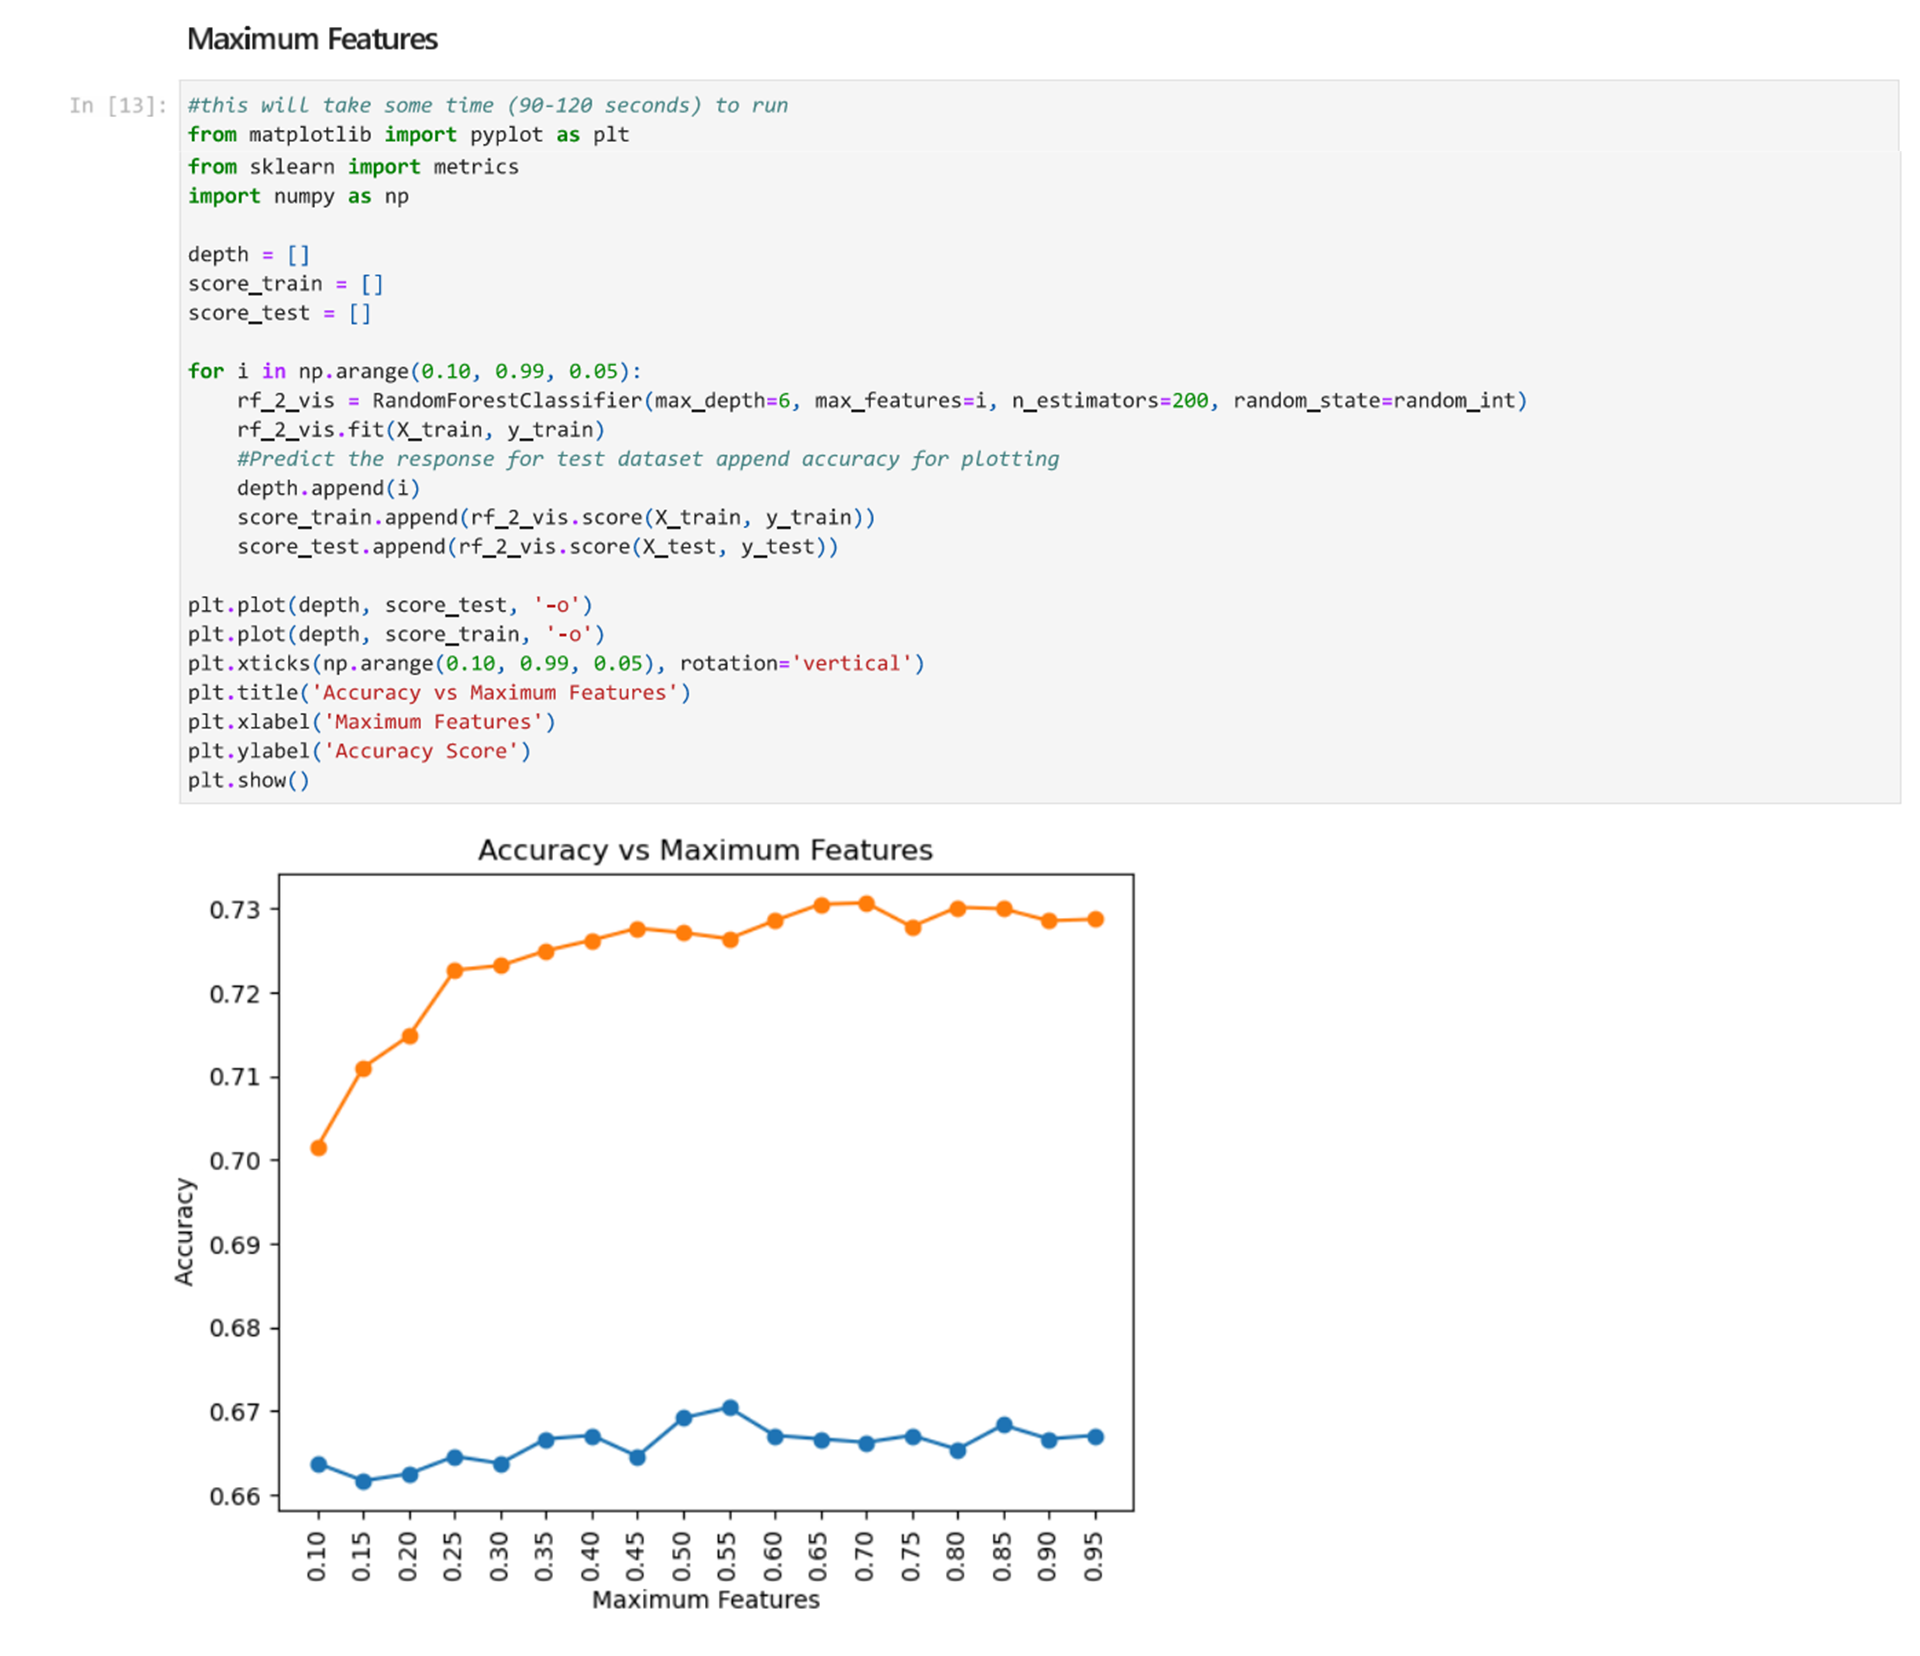
From the graph we can see that the maximum features value does not have a huge impact on the accuracy. The graphs are fairly flat because the difference between each mark on the y axis is 0.01. Still there is a slight difference. A good value for the maximum features hyperparameters is around 0.45 because the training accuracy of the test set flattens out around this value.
Based on this process, we determine that our model can reach an accuracy of approximately 64.67% with the following hyperparameters.
- max_depth=6
- max_features=0.45
- n_estimators=200
- random_state=random_int
Now we can use this model to predict the twoning which is the value residents placed rating their satisfaction with their current home.

Hyperparameter Tuning for Supervised Learning 5/6
Tuning Regression Modellink copied
Overview
In this section we will complete the same steps using a regression model.
In a classification model, we were able to compare the actual class to the predicted class to get the model accuracy. A regression model is instead evaluated by the R-squared score. It measures how far away the actual data points are to the regression function. An R-squared value of 1 indicates that the model explains the variability in the data set. A higher R-square value suggests a better fit to the data but it does not necessarily describe a better performing model.
The mean absolute error (MAE) measures the error between the predicted values and the true values. MAE takes an average by taking a total of the errors and dividing it by the total sample size. It is one of the options for assessing regression models. A lower values (close to 0.0) shows a more successful model.
Extracting Dataset to Input and output
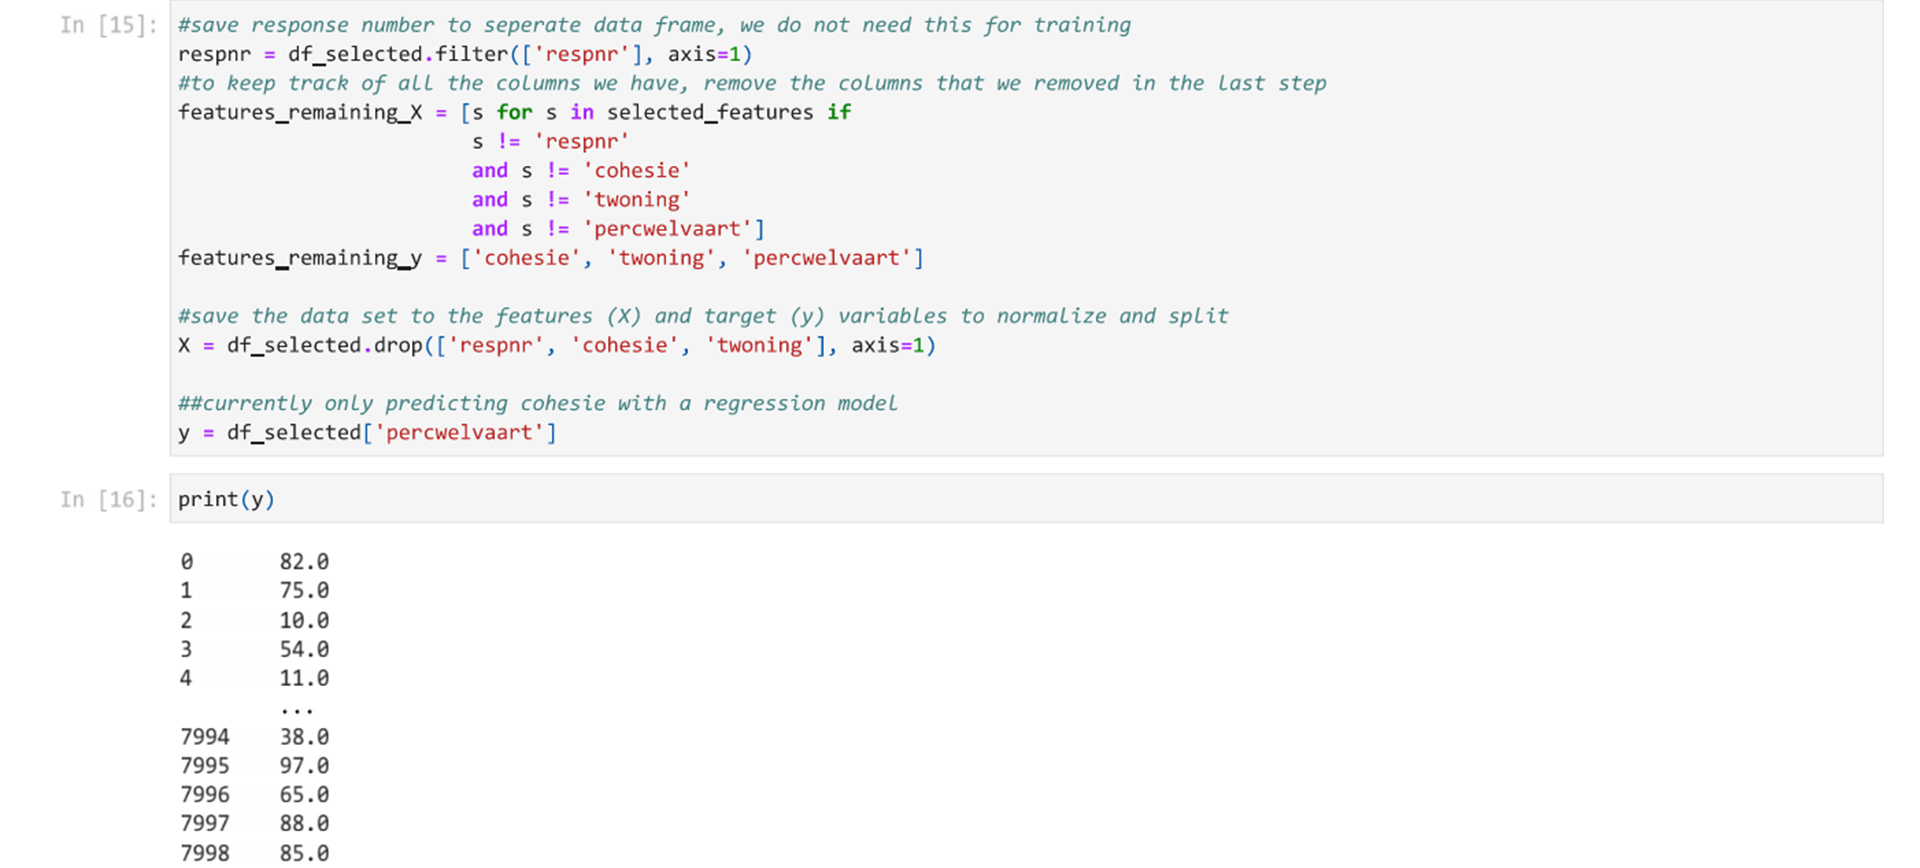
In this training data set, there are several factors that we can use as either an input or an output. For a regression model, we are looking for a parameter that has a continuous value. In this case we will look at the parameter “percwelvaart” which is the prosperity indicator on a scale between 0 and 100. We can print the y variable to see the values.
Train/Test Split
Random forest does not require normalizing data, but we must split it into training and test sets.

Tuning Hyperparameters of a Random Forest Model
Again, we will tune the hyperparameters, but first train a model with default settings. Remember that this model with the default settings will likely perform the best because the default value for maximum depth is none which means that model continue to split until all leaves are pure. This leads to overfitting.
We start by training a baseline algorithm with the following hyperparameter settings:
- n_estimators=200
- random_state=random_int

Next, we will find the optimal max_depth value by testing different max_depth values and plotting the accuracy.
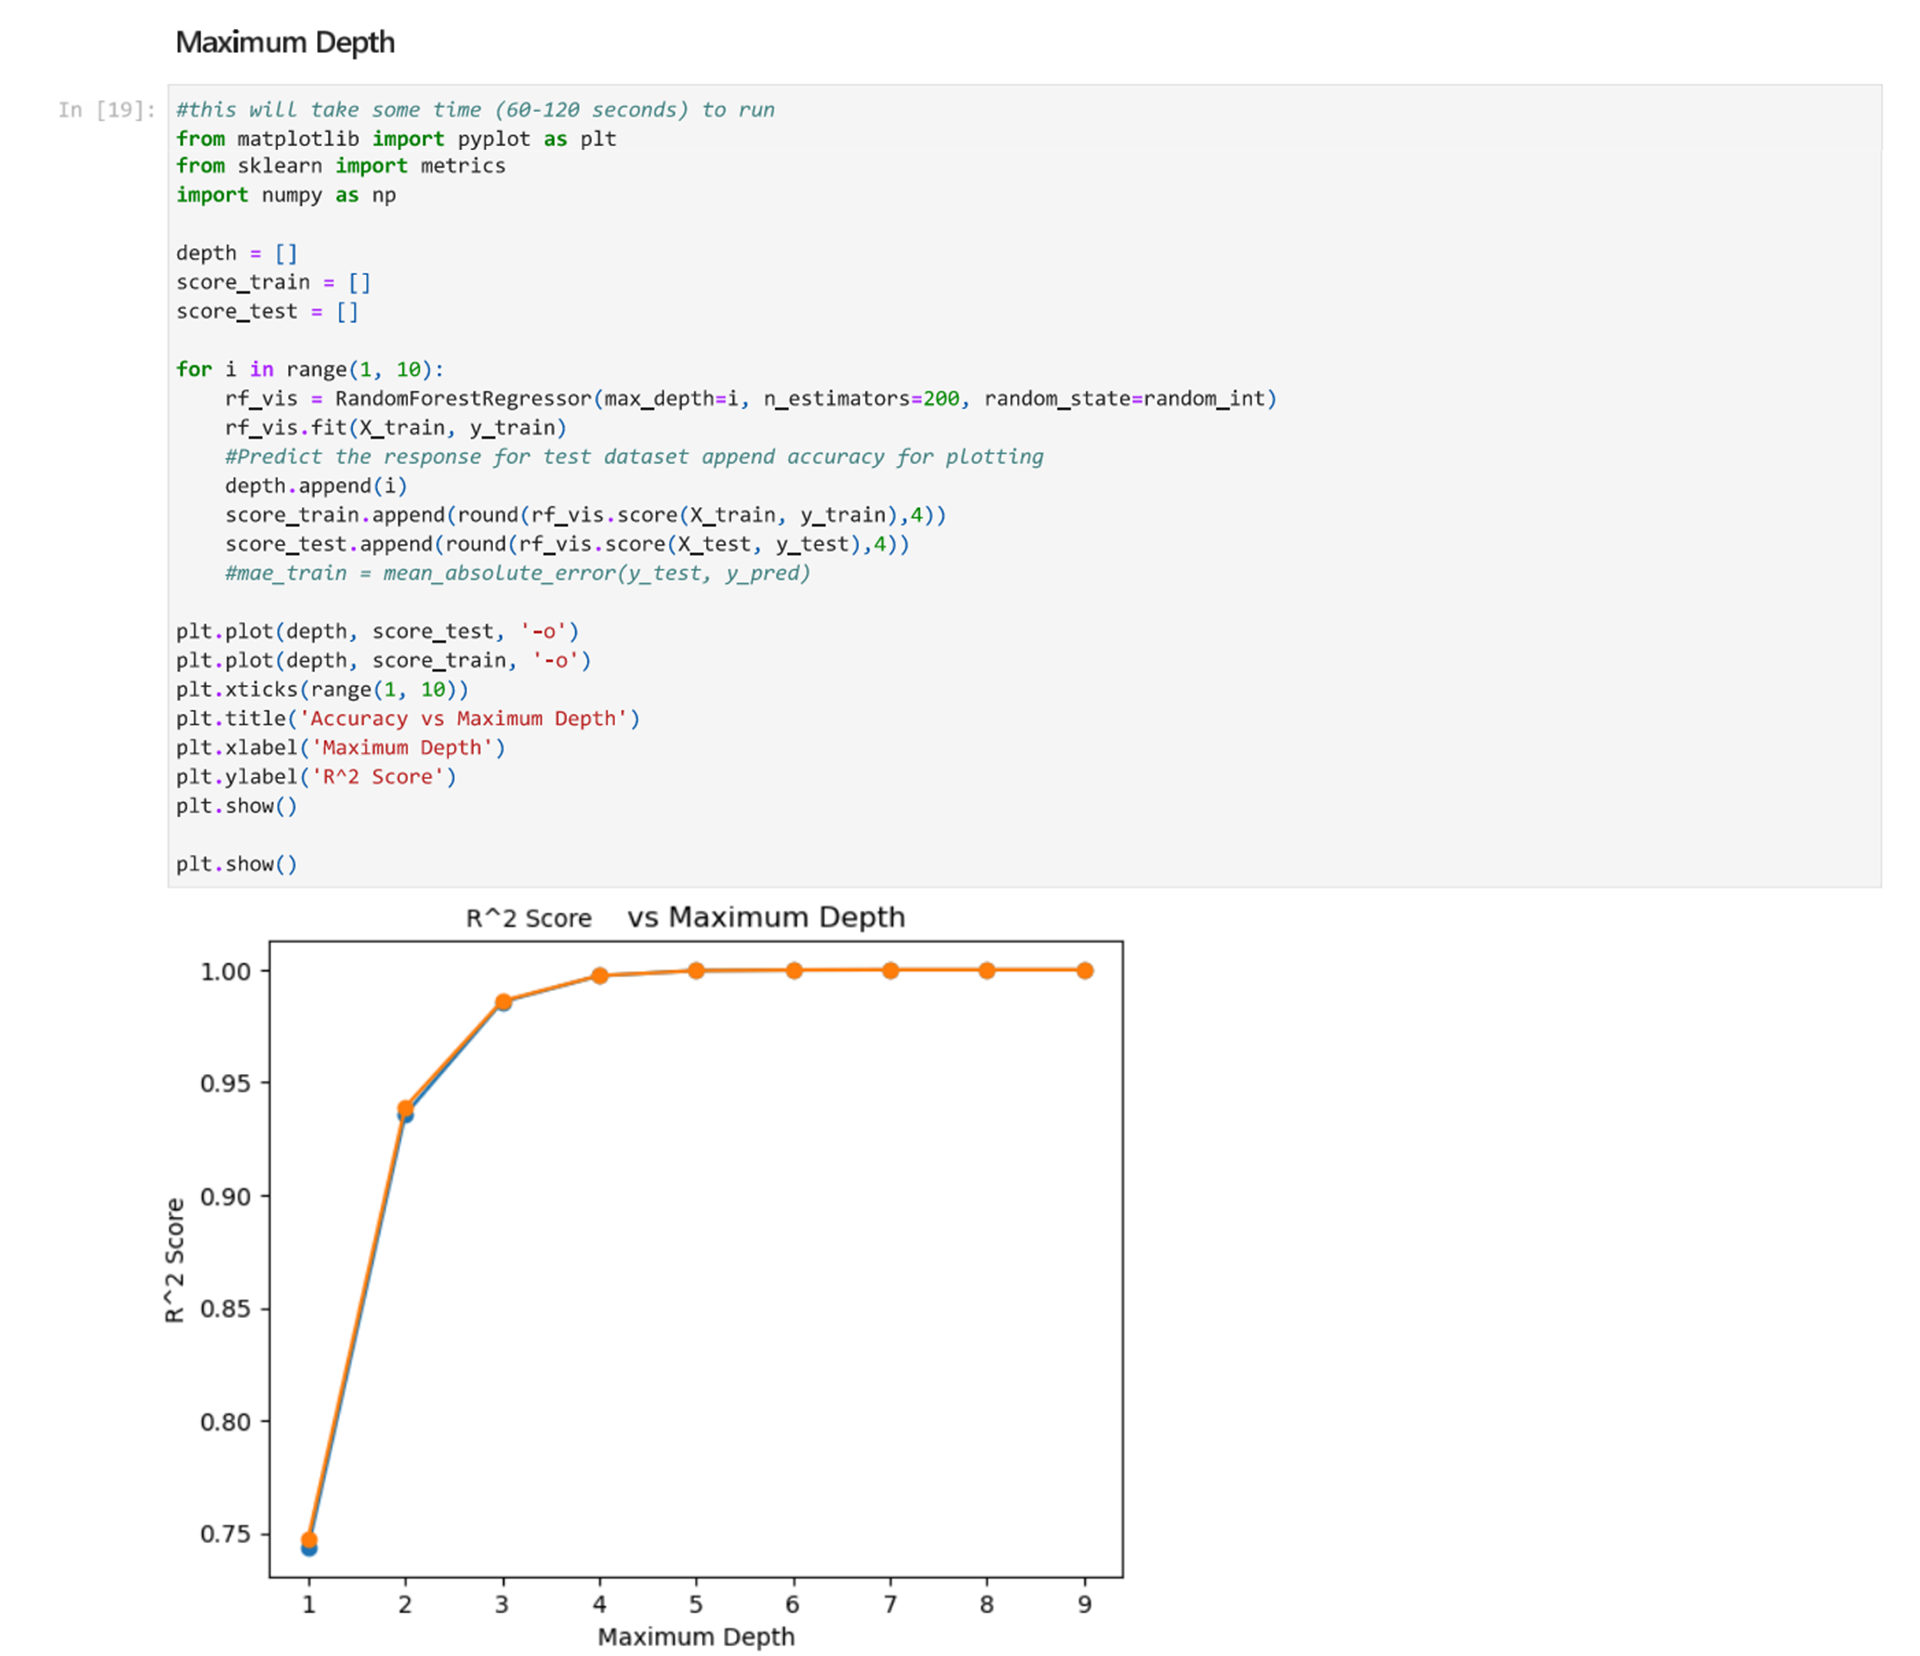
From the above noted plot, we can see that setting the maximum depth at 3 is a good option. We want to select a number that is at a point right before the curve flattens out.
Next, we will find the optimal max_features value by testing different values and plotting the accuracy.
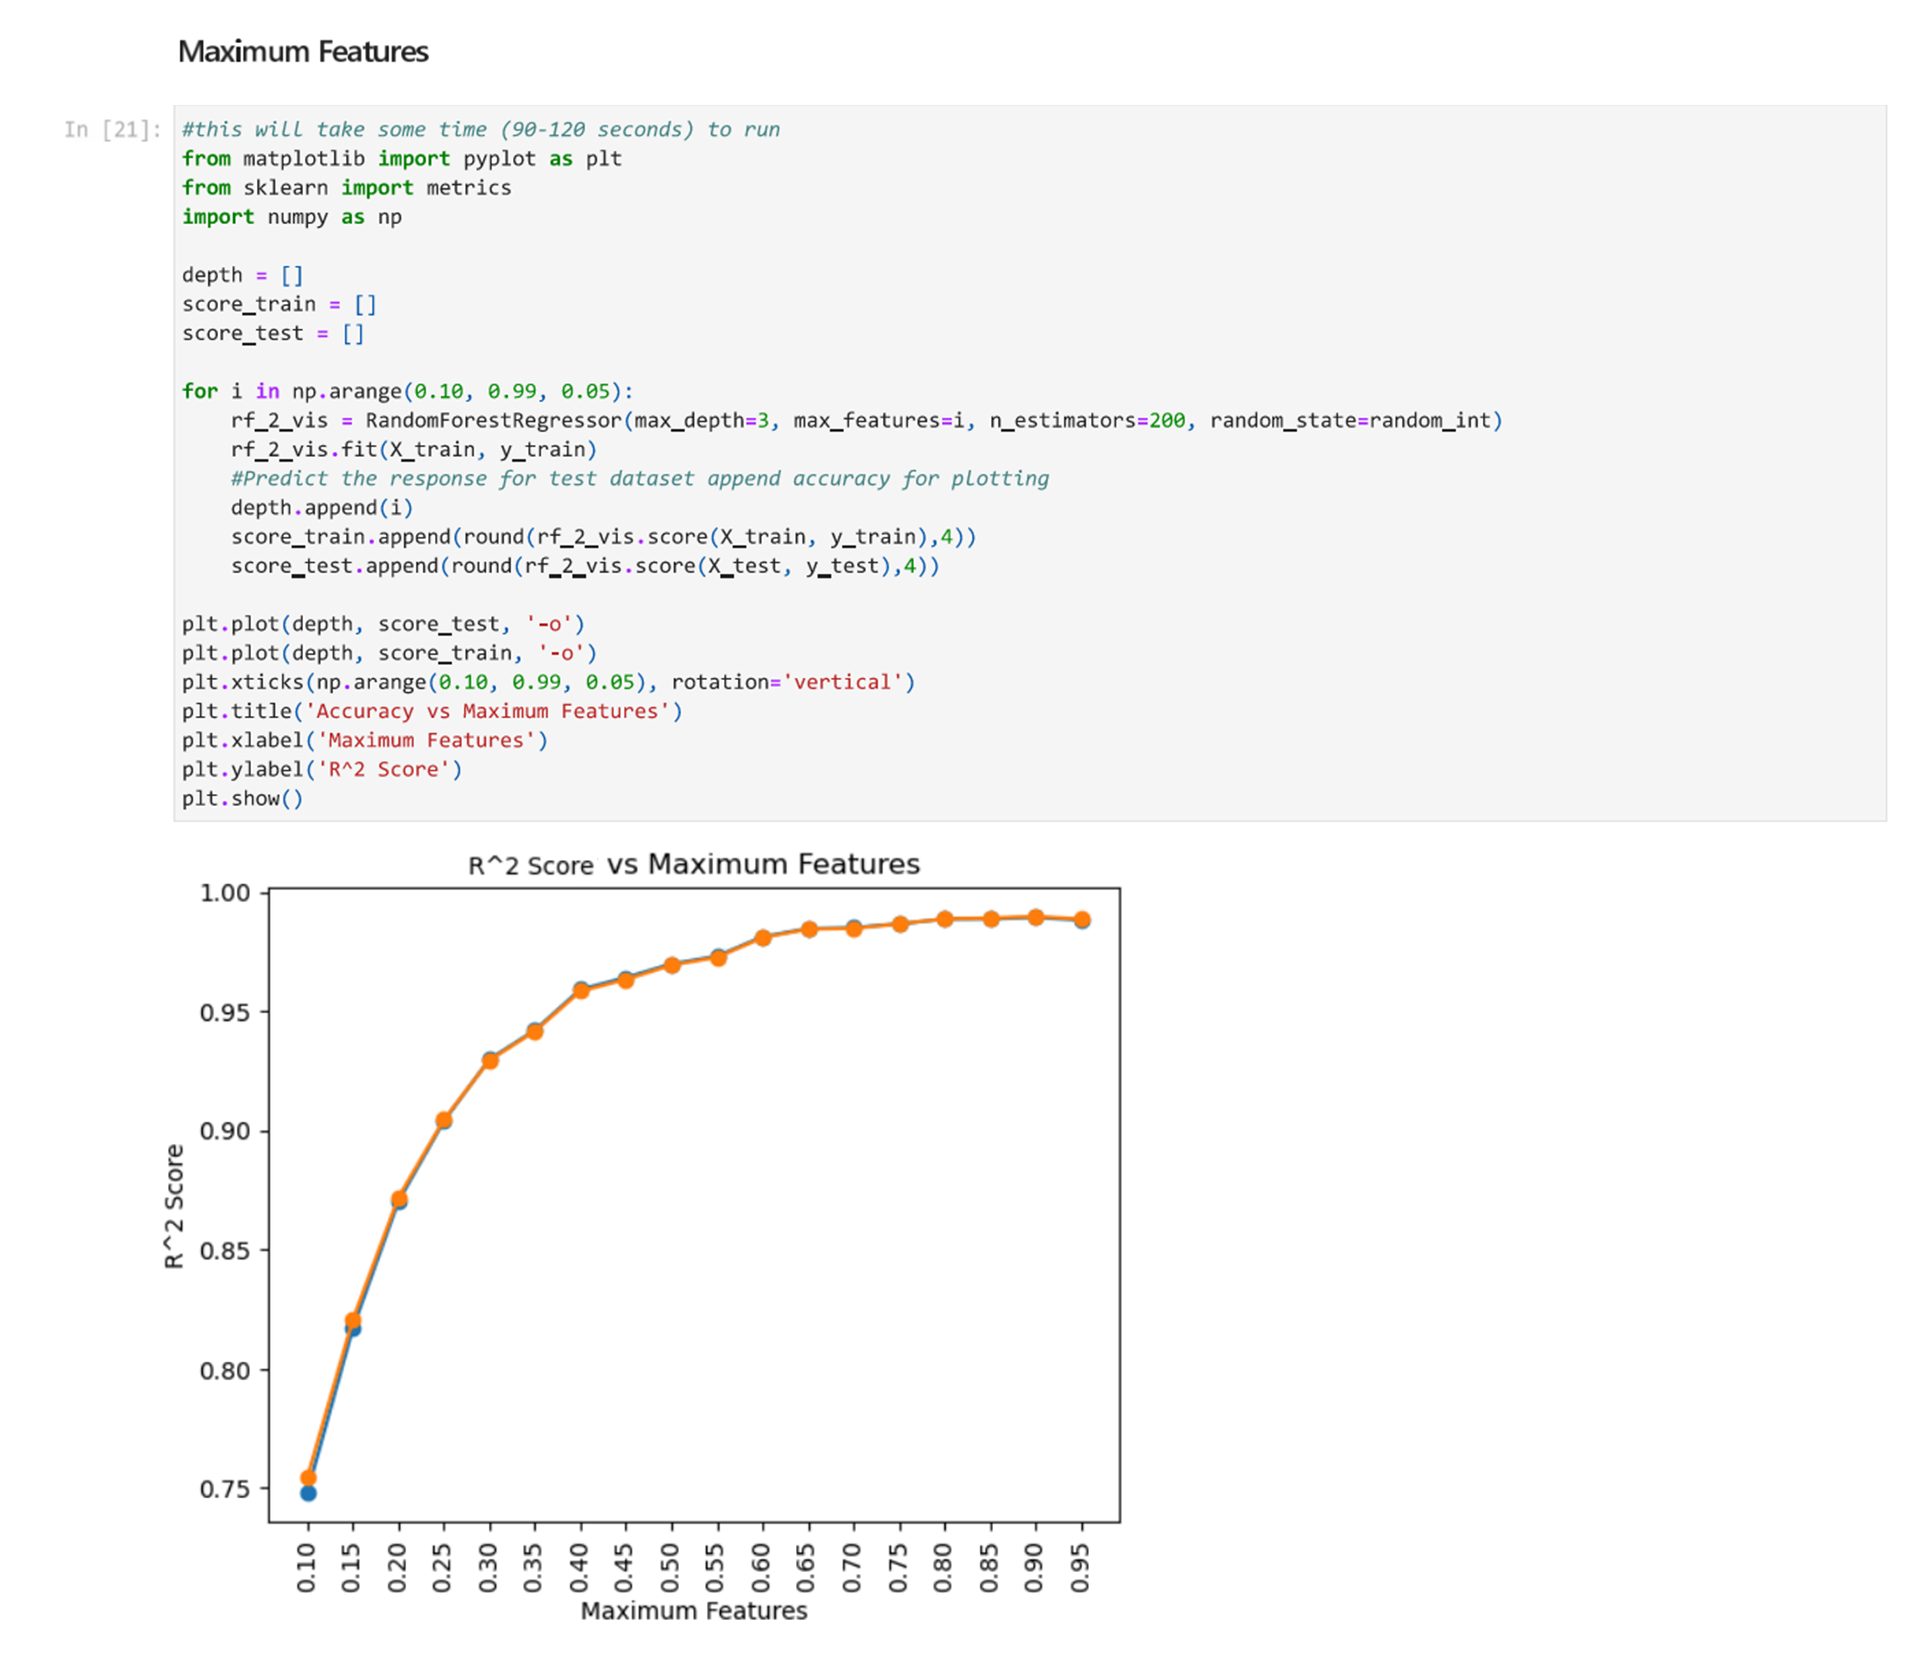
From the graph we can see that the maximum features value should be between 0.6 and 0.8, right before the curve flattens.
Based on this process, we determine that our model can reach an accuracy of approximately 64.67% with the following hyperparameters.
- max_depth=3
- max_features=0.8
- n_estimators=200
- random_state=random_int
Now we can use this model to predict the percwelvaart (prosperity indicator).

Hyperparameter Tuning for Supervised Learning 6/6
Conclusionlink copied
From this tutorial, we can see some techniques to select the right hyperparameter settings when training supervised learning models. We used Random Forest as an example, but you can use the same strategies for other models too.
From the regression model, we can see that training a regression model to predict the prosperity indicator leads to a reliable model. This shows us that there is a strong correlation between the factors in the data set and the prosperity rating. By narrowing down specific features, we can also see which features have the highest impact on the prosperity indicator. This additional step is not completed in this notebook.
Write your feedback.
Write your feedback on "Hyperparameter Tuning for Supervised Learning"".
If you're providing a specific feedback to a part of the chapter, mention which part (text, image, or video) that you have specific feedback for."Thank your for your feedback.
Your feedback has been submitted successfully and is now awaiting review. We appreciate your input and will ensure it aligns with our guidelines before it’s published.
