Thesis: Dementia-Inclusive Design – Alsaggaf
-
Intro
-
Technical Aspects
Information
| Primary software used | Python |
| Software version | 1.0 |
| Course | Thesis: Dementia-Inclusive Design – Alsaggaf |
| Primary subject | AI & ML |
| Secondary subject | Machine Learning |
| Level | Expert |
| Last updated | November 27, 2024 |
| Keywords |
Responsible
| Teacher | |
| Faculty |
Thesis: Dementia-Inclusive Design – Alsaggaf 0/1
Thesis: Dementia-Inclusive Design – Alsaggaf
Dementia-Friendly Wayfinding Quality Assessment Using Machine Learning. A machine Learning Assessment Tool for Indoor Wayfinding Quality in Dementia Care Spaces.
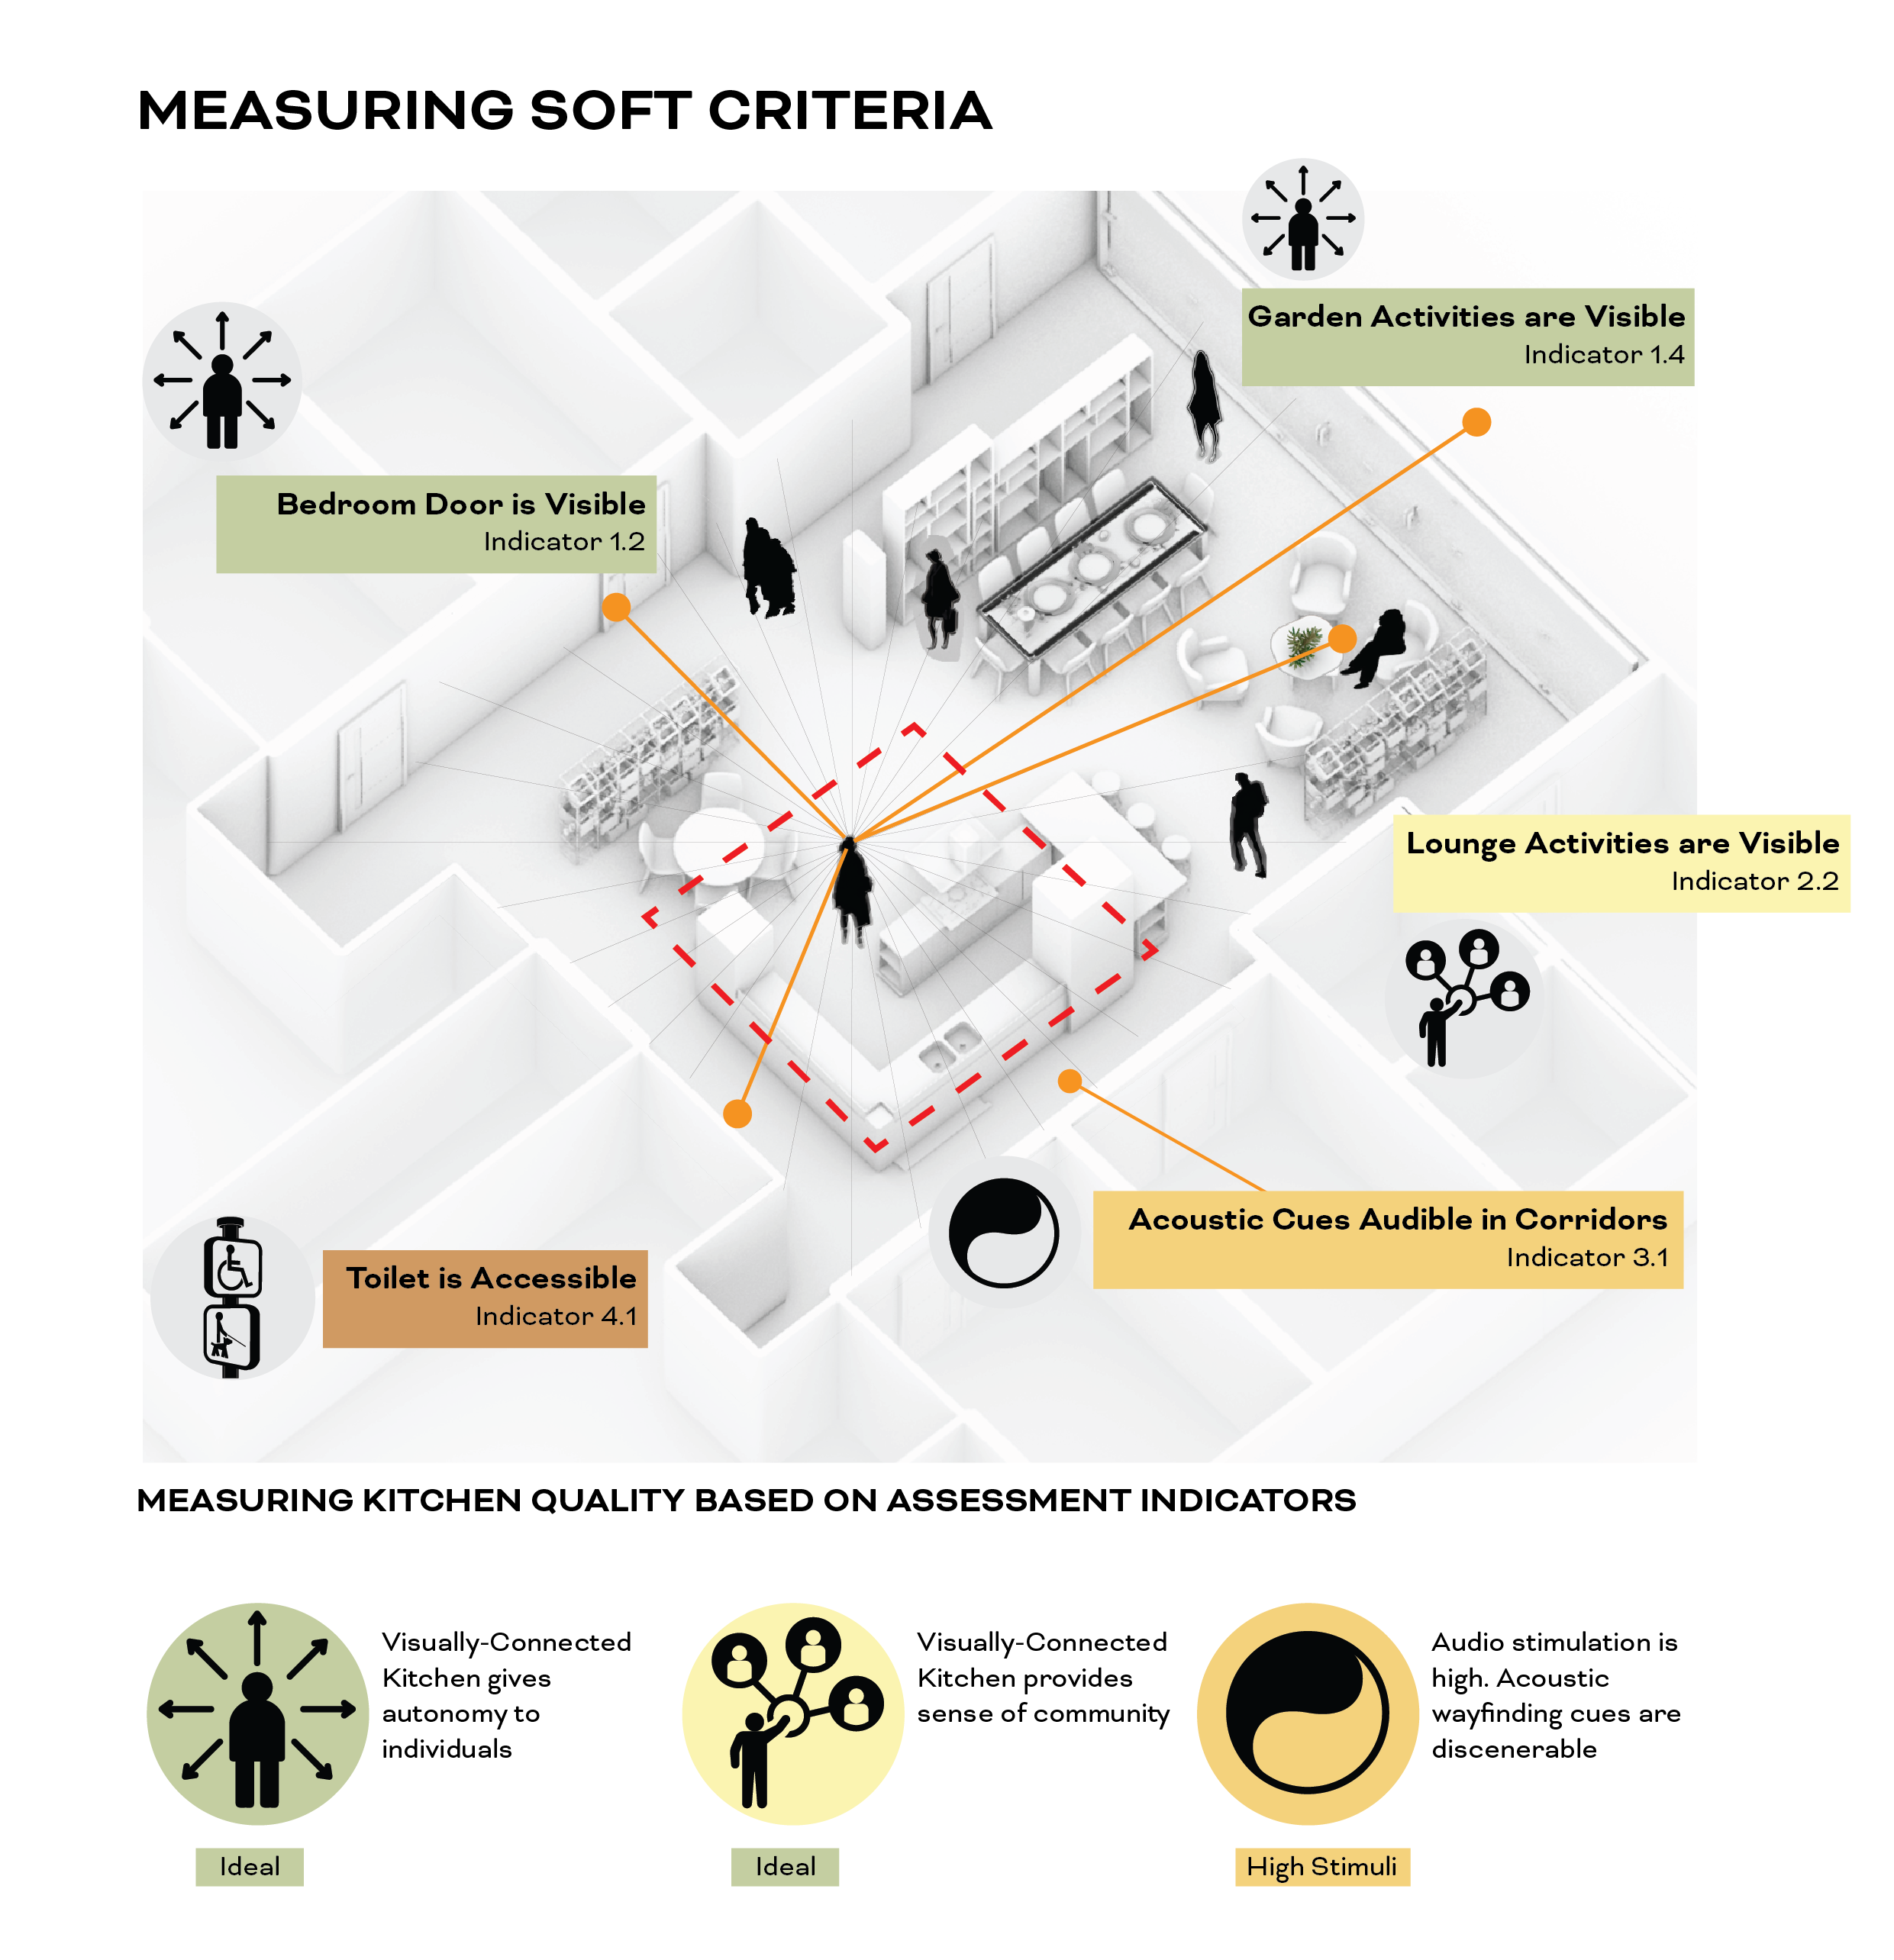
The design of residential care facilities has profound impact on the quality of life for people living with dementia. Dementia cases are on the rise, and the demand for care environments is increasing. This project investigates the development of an AI-driven tool to help assess indoor wayfinding quality in dementia care spaces to support the early-stage design process for architects. The tool integrates spatial analysis techniques generated from Grasshopper to evaluate the design of dementia-friendly spaces based on visual access requirements stated in the Environmental Assessment Tool (EAT) handbook by Fleming and Bennett (2017) which can help improve navigation skills and sense of community for residents living with dementia. The core of the research leverages supervised machine learning algorithms – Random Forest Ensemble – trained on a dataset comprising of 2D floor plans and visual access data.
The computational framework was developed to evaluate wayfinding quality using isovist data generated from Grasshopper and ranked layouts based on their visual access measured in different points in the living room. Ultimately, the goal of this research was to investigate the feasibility of a digital workflow that can be leveraged by architects to link early-stage concept design ideation phase to the specialist validation of final designs to help guide the design of floor layouts towards compliant designs based on the EAT assessment criteria. In this page you can learn more about the project. In the technical aspects you can see how the application of software was done for this thesis which includes using Grasshopper to generate visual access data by using isovists, then in Jupyter Notebook with Python how the data was processed, the model’s features and parameters selection methods, and multioutput classifier evaluation metrics.

APA: Alsaggaf, F.Y.J. (2024). Dementia-Inclusive Design – Machine Learning Assessment Tool for Indoor Wayfinding Quality in Dementia Care Spaces [Master thesis, TU Delft]. https://resolver.tudelft.nl/uuid:98b925fd-fd53-444f-a1f6-4863df303e3b
Here you can find the repository of the master thesis: Dementia-Inclusive Design Machine-Learning Assessment Tool for Evaluating Indoor Wayfinding Quality in Dementia Care Spaces
Project Information
- Title: Dementia-Friendly Wayfinding Assessment – Machine Learning Assessment Tool for Indoor Wayfinding Quality in Dementia Care Spaces
- Author(s): Feras Alsaggaf
- Year: 2024
- Link: https://resolver.tudelft.nl/uuid:98b925fd-fd53-444f-a1f6-4863df303e3b
- Type: Master thesis, Building Technology
- ML tags: Supervised Learning, Classification, Feature Selection, Grid Search, Random Forests
- Topic tags: Data Generation, Swiss Dwellings Dataset, Isovist, Dementia-Friendly
Thesis: Dementia-Inclusive Design – Alsaggaf 1/1
Technical Aspectslink copied
In this thesis, a machine learning framework was developed to measure visual access, one of the key indicators for improved wayfinding, to assemble a dataset that can predict visual access quality from 2D building geometry features.
All the files are shared and updated on github: Github-Dementia-Friendly-Wayfinding
Software & plug-ins used
- Rhino + Grasshopper | version 7
- python | 3.11.5
- pandas | 2.0.3
- numpy | 1.24.3
- matplotlib | 3.7.2
- scikit-learn | 1.4.2
- seaborn | 0.12.2
ML-framework
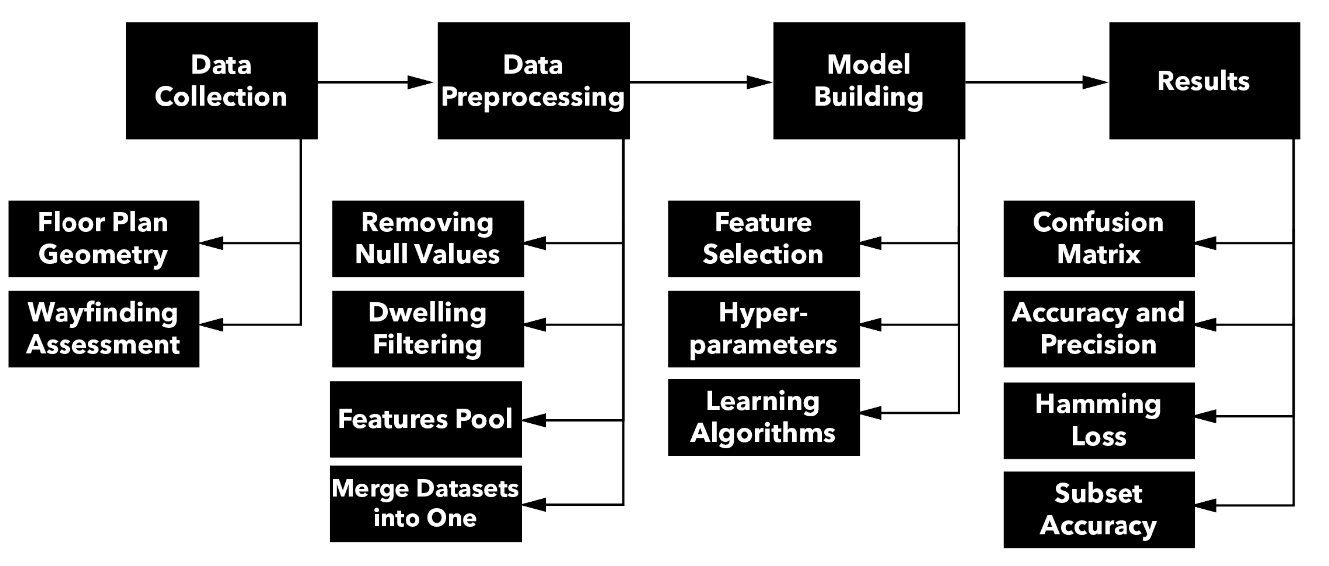
The overall includes 4 major steps:
- Data collection: assembling a dataset containing building geometry information/features and visual access data.
- Data Preprocessing: assemble the datasets into one including removing of null values, invalid geometries, and assigning bin classes.
- Model Building: selecting the feature subset, ML algorithm, and hyperparameter optimization.
- Results: evaluate the results of the model using metrics such as accuracy, precision, F1 score, and multilabel metrics such as hamming loss and subset accuracy.
Data Collection on Grasshopper
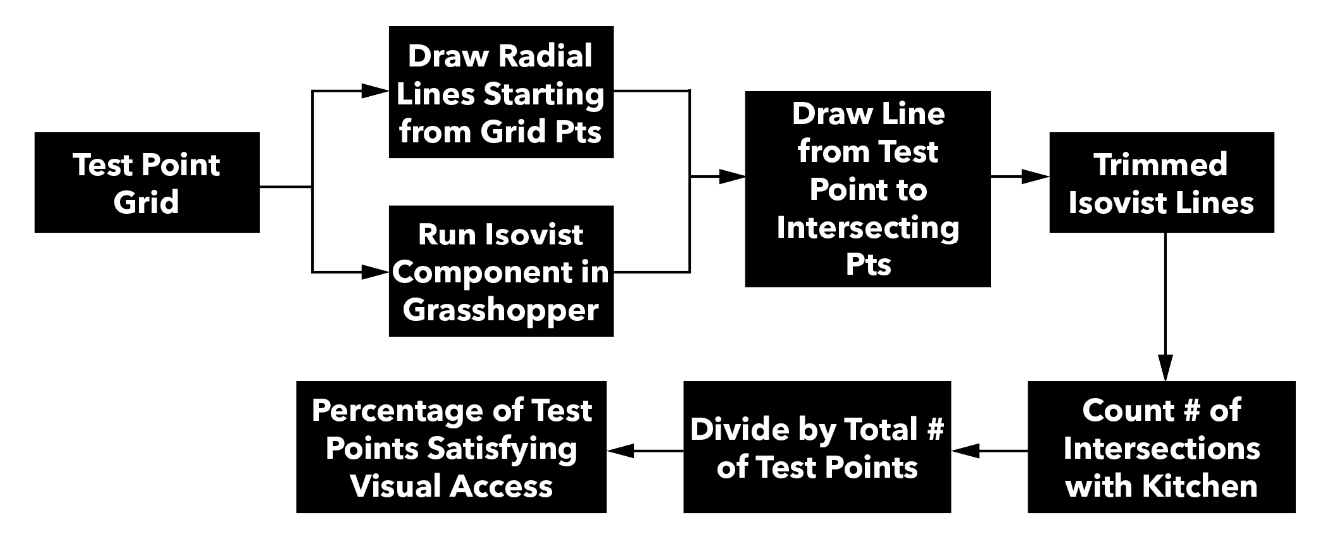
Grasshopper was used to generate isovist data on a filtered subset of households from the Swiss Dwellings dataset containing 1-story households that contain both living and kitchen as distinct room functions. The grasshopper script automatically populates the living room with the test point grid and records the successful visual sightlines made between the living room and other key spaces such as the kitchen and the nearest toilet.
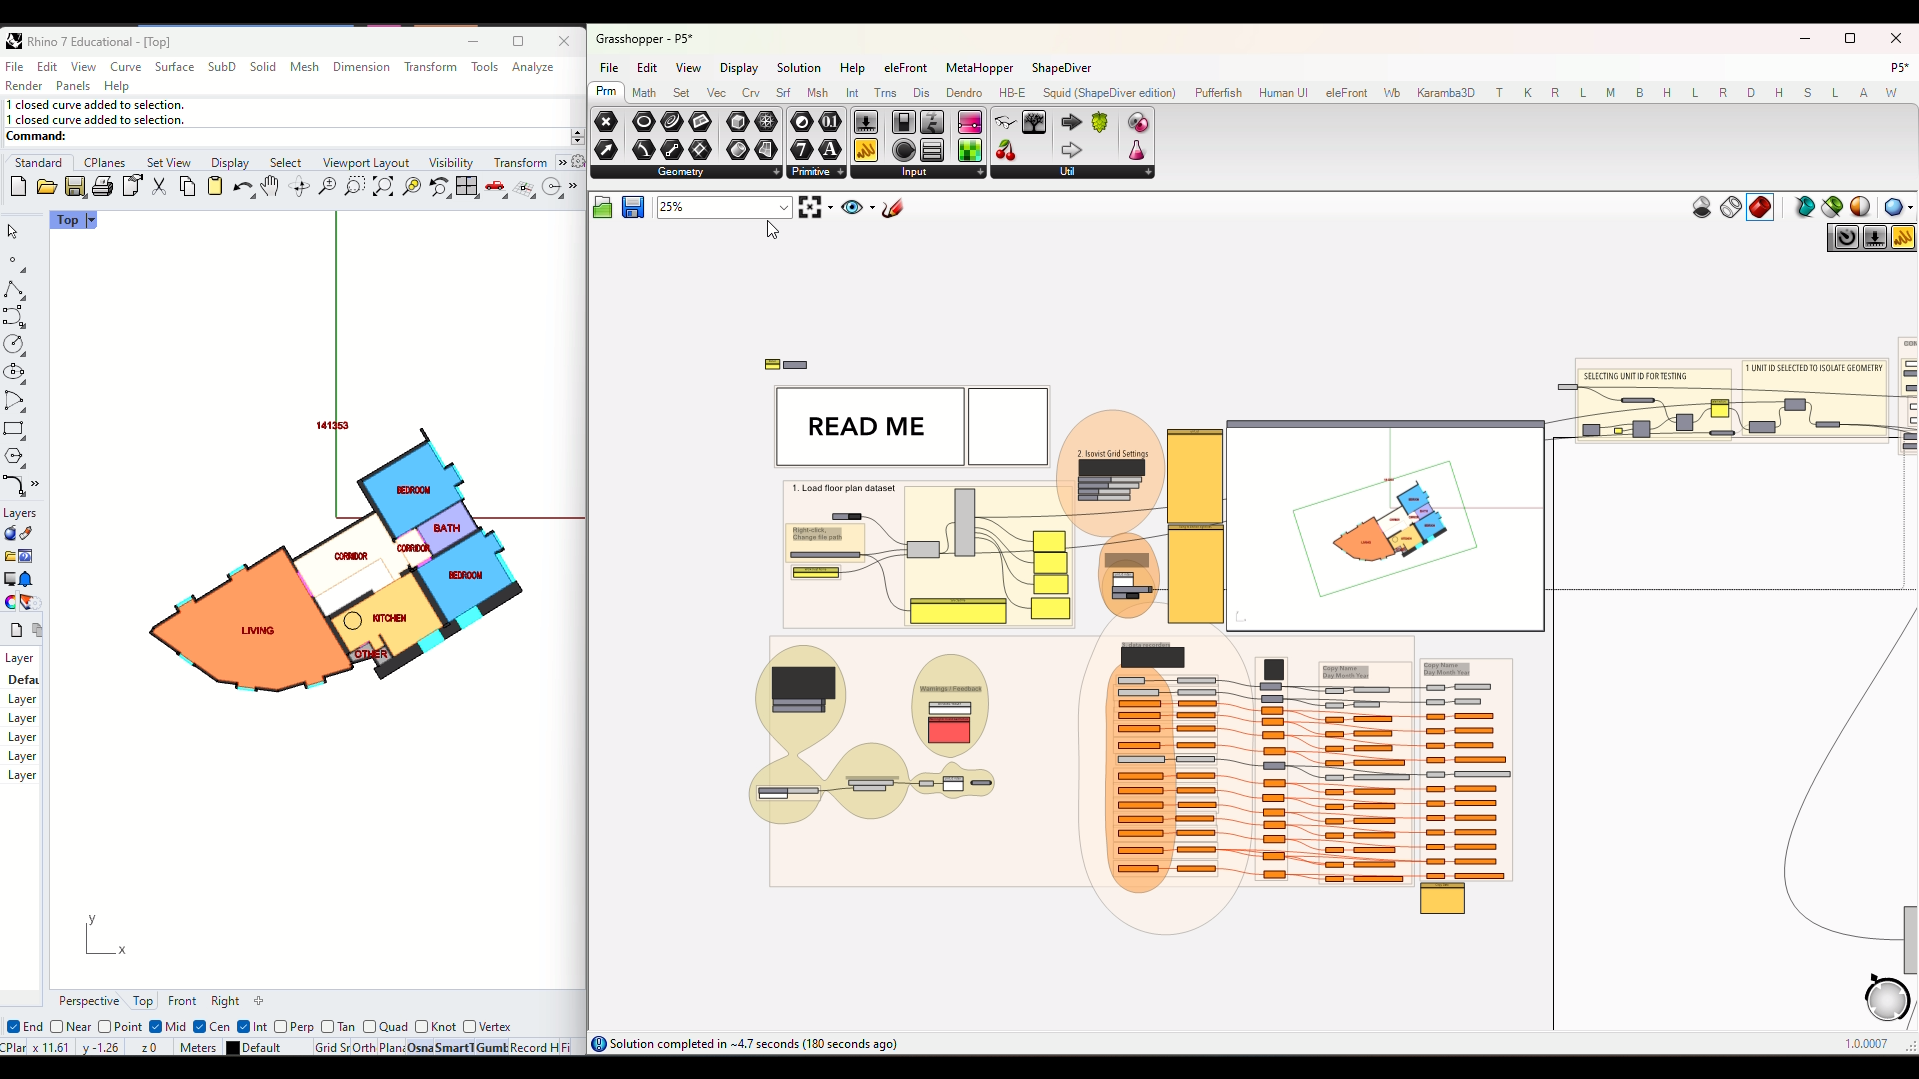
The following video will provide an overview of the Grasshopper file to explain the computational workflow for generating the data broadly. Visit the github repository to download the Grasshopper script and all other files needed to run them.
Data Processing
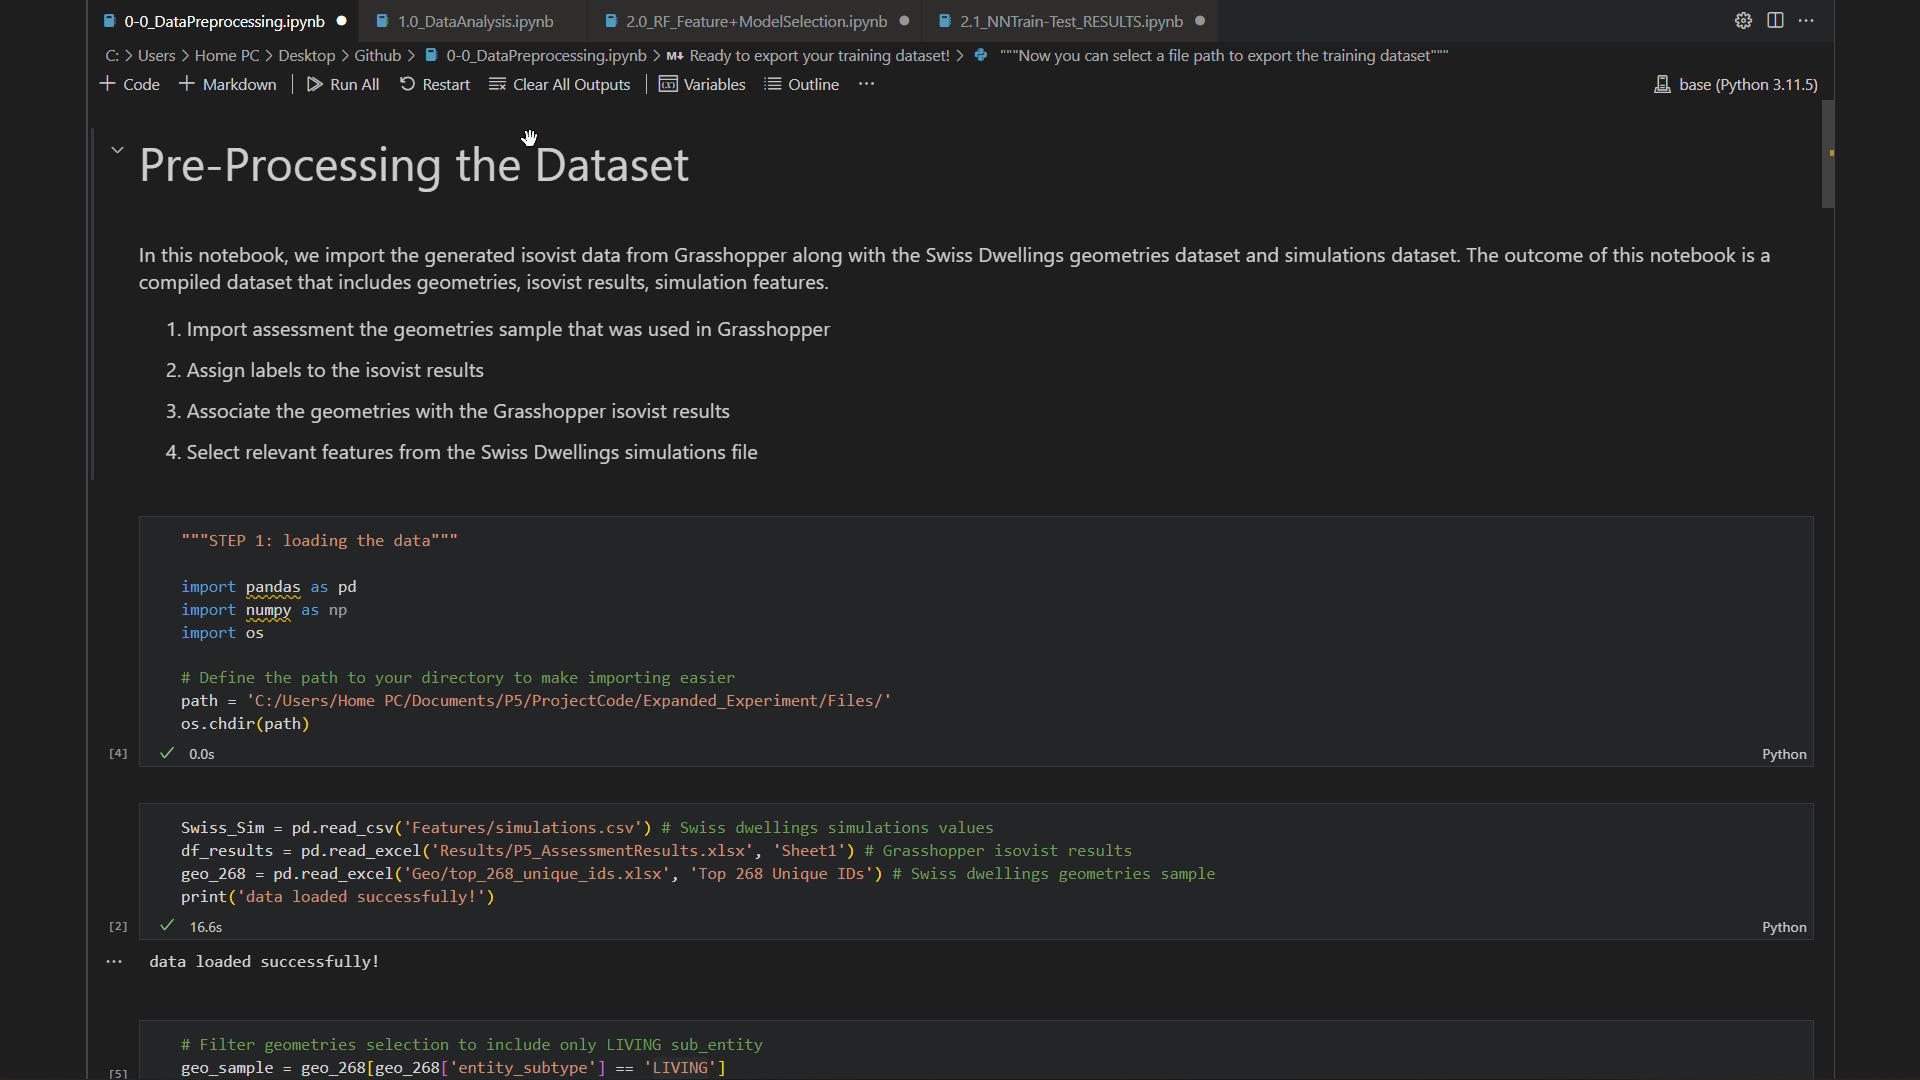
Once we export the raw data from Grasshopper, we need to perform an additional processing step to assign quality label based on thresholds for the visual access percentage. Then the entire dataset is combined into a single training set which will include the building geometry information, assessment results (including bin classes), and spatial features to be used to correlate layouts with assessment results.
The next video will give an overview how the notebook will produce a clean dataset that we can use for building the machine learning model.
Model Parameter Selection and Evaluation
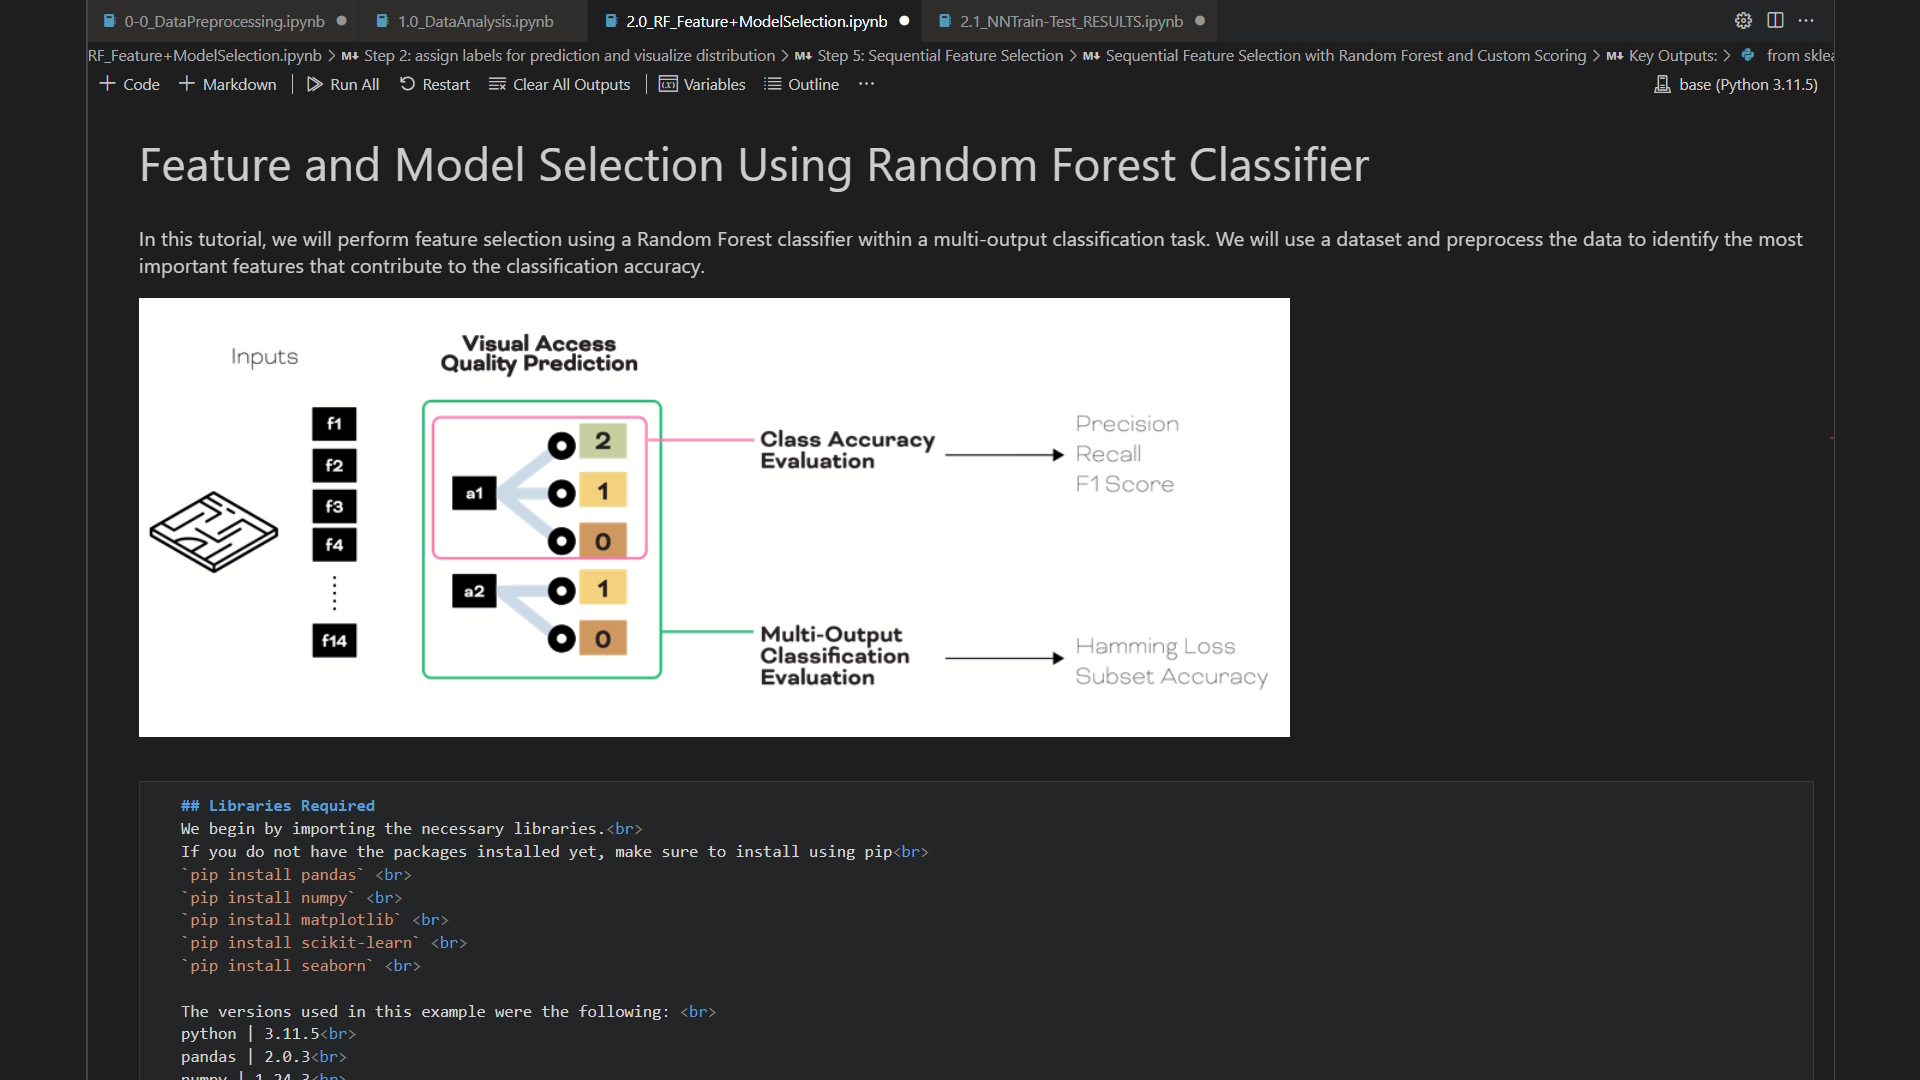
Using the training set we exported form the previous step, we now build our machine learning model by first defining a custom scorer multioutput multiclass because we will have the model predict 2 outputs where one of the have 3 classes possibilities and the other 2 classes. Then a sequential feature selector algorithm is performed followed by hyperparameter grid search. Then finally we view the performance of the model by printing the performance of each class with their respective confusion matrix and the final subsect accuracy attained.
Write your feedback.
Write your feedback on "Thesis: Dementia-Inclusive Design – Alsaggaf"".
If you're providing a specific feedback to a part of the chapter, mention which part (text, image, or video) that you have specific feedback for."Thank your for your feedback.
Your feedback has been submitted successfully and is now awaiting review. We appreciate your input and will ensure it aligns with our guidelines before it’s published.
