Curve attractor in grid
-
Intro
-
Design
-
Setting up the geometry
-
Curve attractor 2D grid
-
Curve attractor 3D grid
-
Geometry selection
-
Conclusion
-
Useful Links
Information
| Primary software used | Grasshopper |
| Course | Curve attractor in grid |
| Primary subject | Parametric Modeling |
| Secondary subject | General |
| Level | Intermediate |
| Last updated | May 27, 2025 |
| Keywords |
Responsible
| Teachers | |
| Faculty |
Curve attractor in grid 0/7
Curve attractor in grid
Basics of attractors in Grasshopper
Attractors in parametric design have various applications, ranging from pattern design to more advanced uses like performative design. For example, they can optimize a facade’s performance relative to the sun. This tutorial will cover the basic understanding of the use of attractors in Grasshopper and will explain this by an example of a parametric component system that relates to an attractor. In this tutorial the basics of attractors are explained with a 2D example of a curve used as attractor. The image on the bottom illustrates a curve attractor that determines the radius of a grid of circles.
Curve attractor in grid 1/7
Designlink copied
This tutorial will guide you through creating a grid of points and generating circles at each point. You will learn how to adjust the radius or extrusion of the circles based on their distance from a specified curve.
The variables of the definition will be:
- Grid of points: 30×30 meters
- Curve from Rhino
- Radius of the circles
- Height of the extrusion
Exercise file
In this tutorial, basics of using a curve as attractor will be explained. You can download the file developed for this tutorial. However, to really understand how the script works, it is recommended to build it yourself.
Curve attractor in grid 2/7
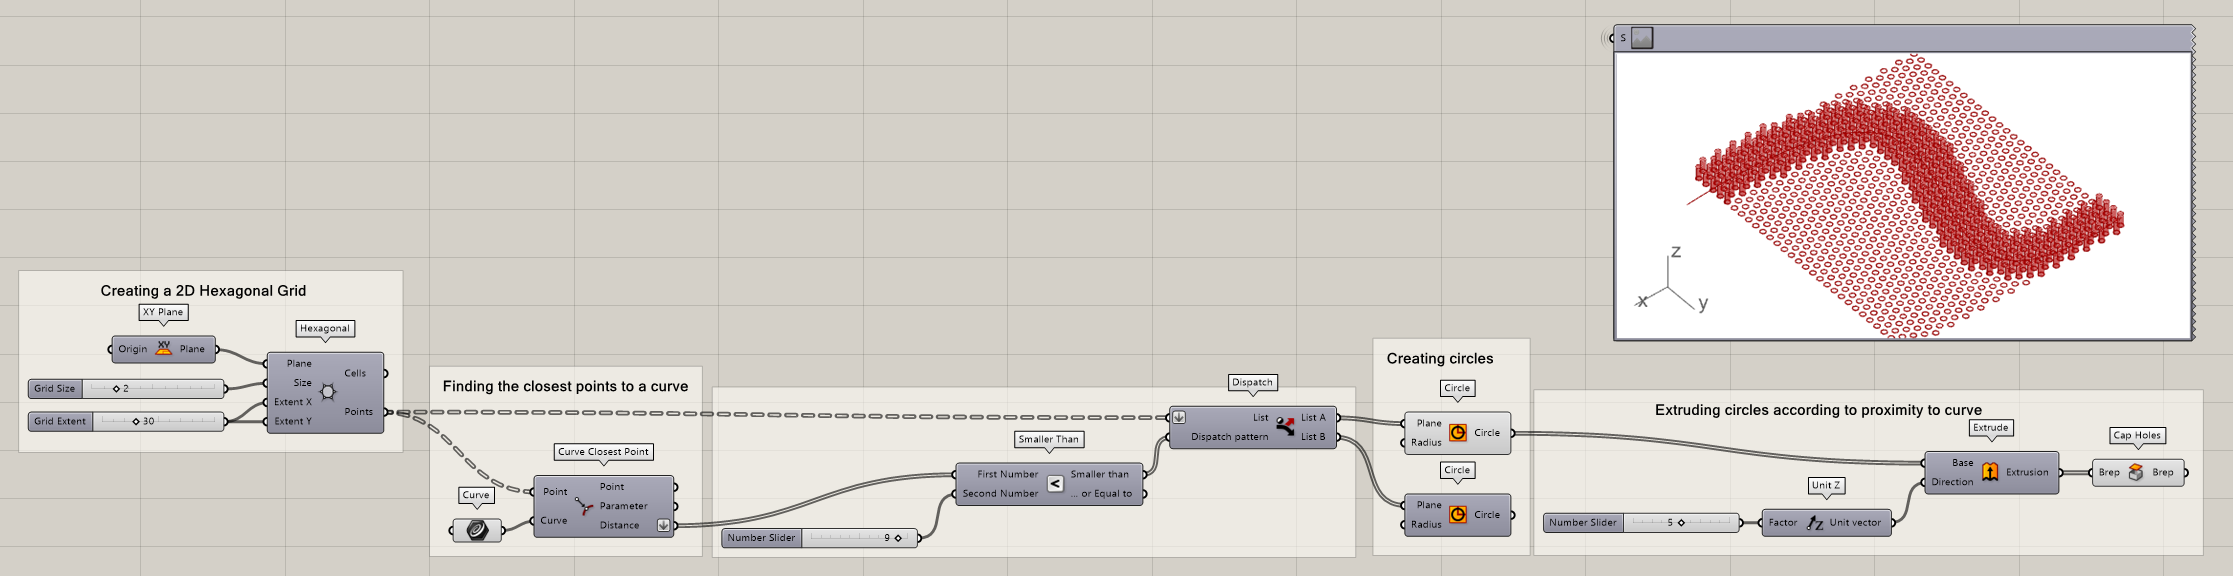
Setting up the geometrylink copied
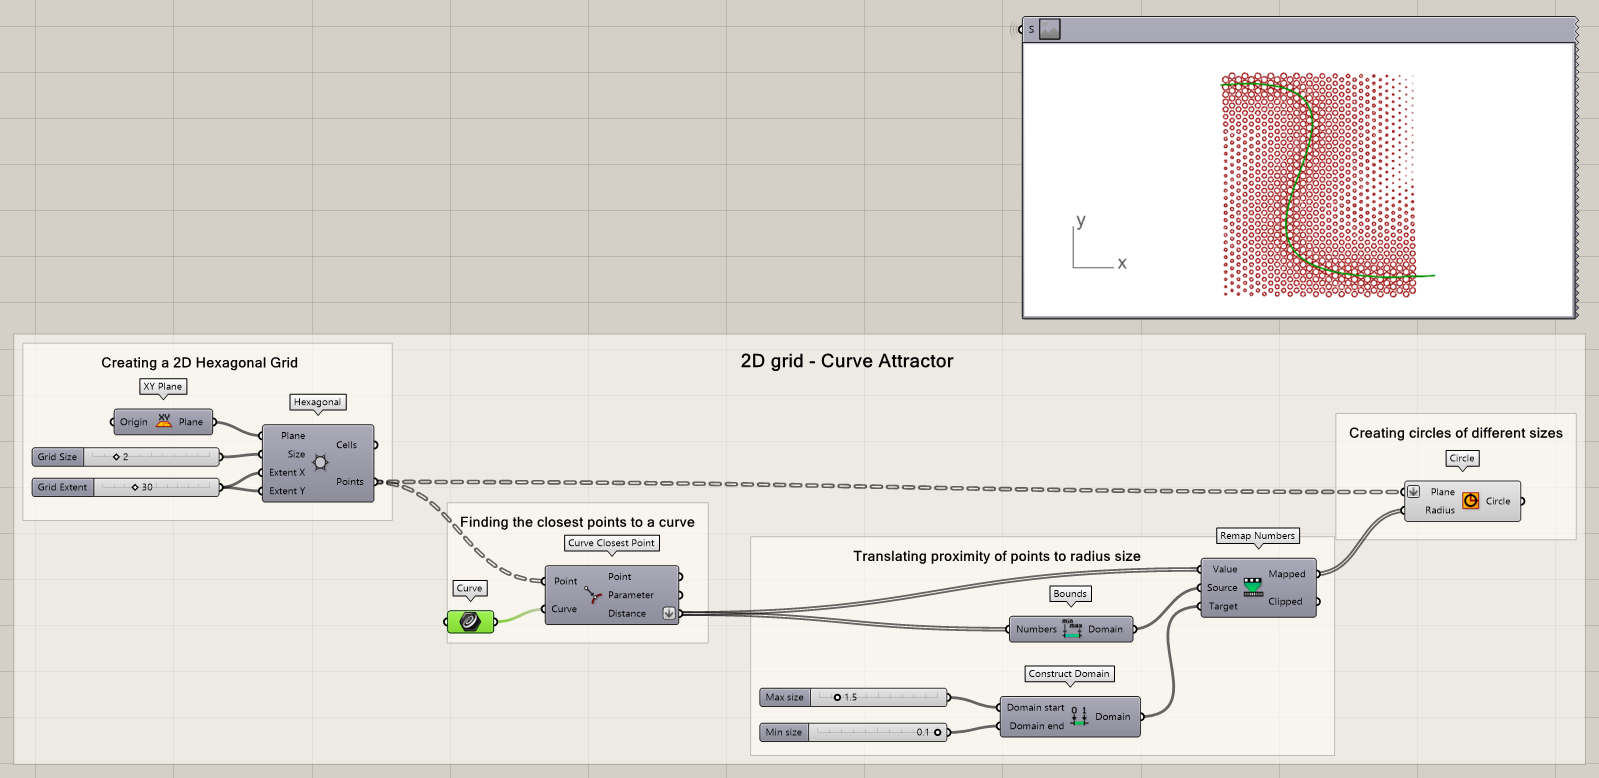
To prepare for the attractor script we need to prepare a 2D grid and curve. For the first set-up, we are using a 2D hexagonal grid and a curve created in Rhino. Create a hexagonal pattern using the respective component. Define the X and Y size using a numerical input.
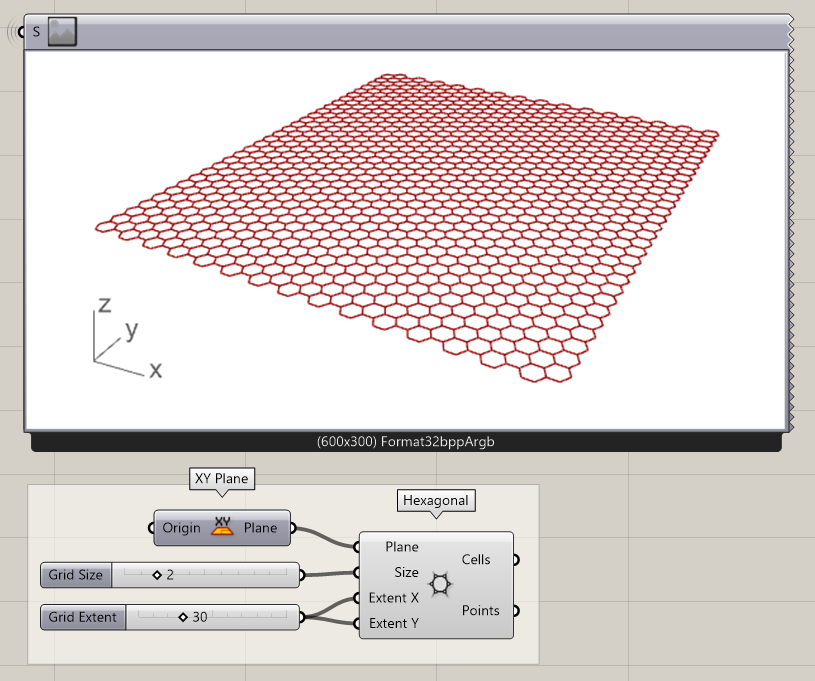
- Add a Hexagonal component to the canvas
Define the X and Y size with a Number Slider
Draw a curve in the hexagonal grid. The curve may intersect with the boundary of the grid. Set the curve to a curve parameter in the Grasshopper script
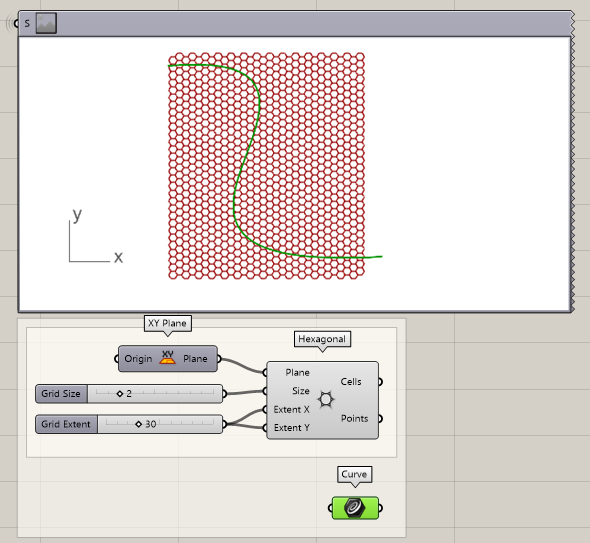
- Draw a curve through the grid in Rhino
- Add a Curve parameter to the canvas
- Set the curve to the parameter
Curve attractor in grid 3/7
Curve attractor 2D gridlink copied
Now that the geometries are created, the curved can be used as attractor in the hexagonal grid. Now we want to find the distance between the hexagon centers and the closest point on the curve. This can be easily done using the Curve Closest Point component.
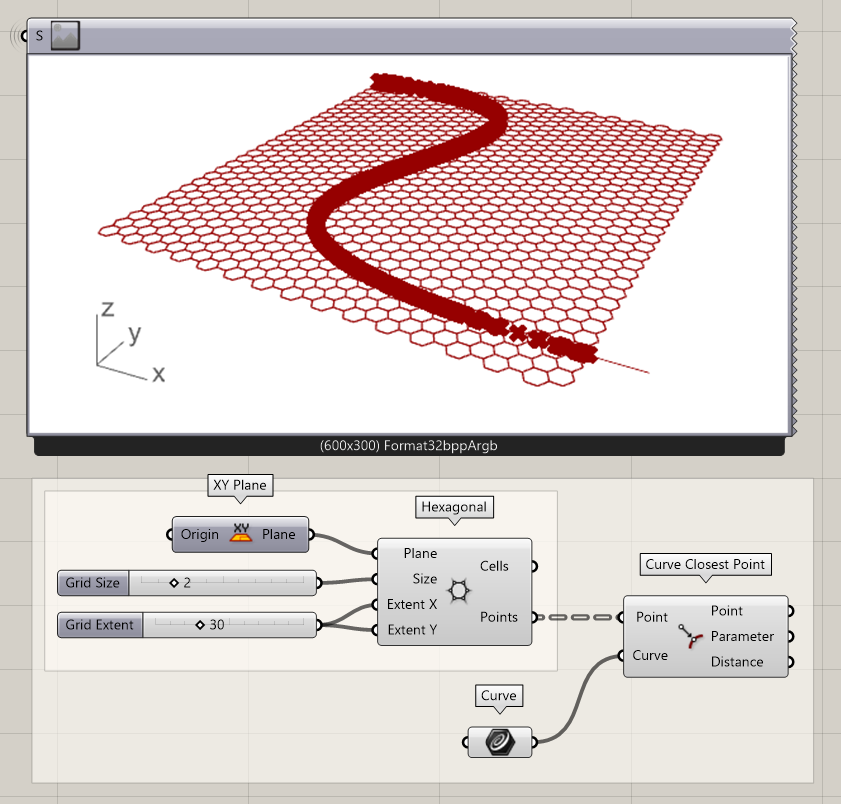
- Find the distance between the curve and the hexagon centers
Next, we want to remap the available distance values to another range. Make sure you first flatten the distance output! Because the distances vary and have a wide range, we use the remap options to create a smaller range that corresponds to the distance between each point and the curve. In this example, the distances range from 0.018 to 50.2, which are too small or too big for the radii of our circles. Therefore, we remap these numbers in a range between 0.1 and 1.5 to achieve our desired result for our radii. In this tutorial we will not explain the remapping extensively, if you are having trouble understanding the remapping, take a look at the tutorial Curve frames arrays.
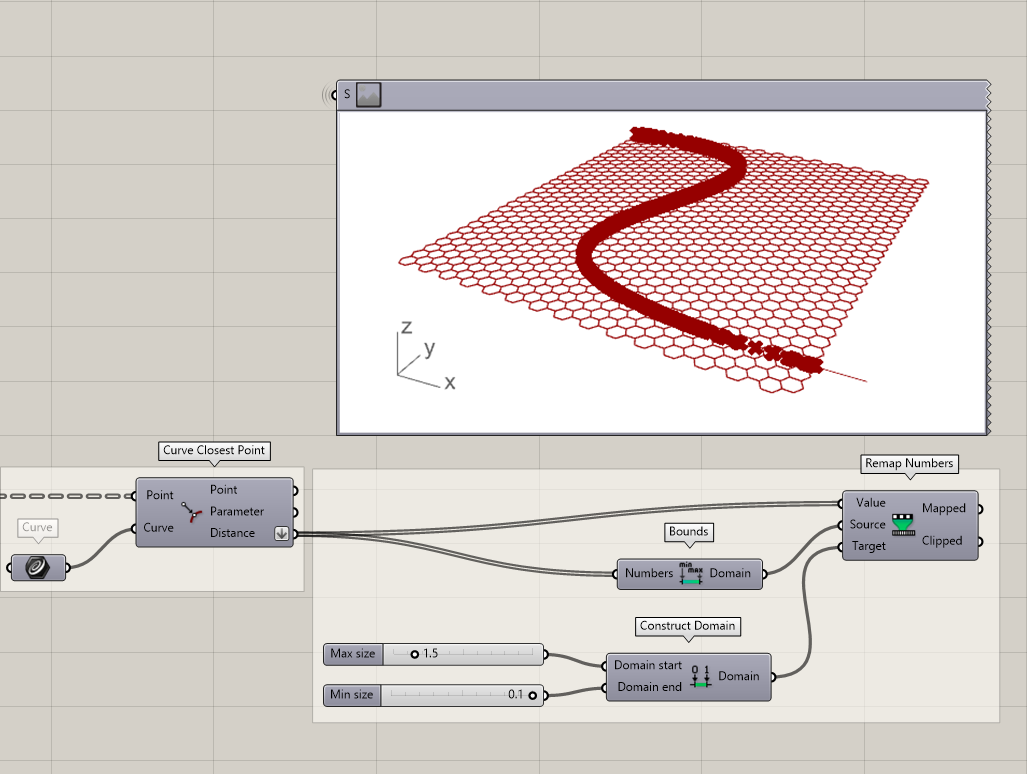
- Flatten the distance output
- Find the bounds of the distance values
- Remap the values
- Define the Target domain using a Construct Domain component
Based on the remapped distances, we create circles with the hexagon centers as origin. The radius is defined by the remapped distance. Make sure you flatten the Plane input.
- Add a circle component to the canvas
- Flatten the Plane input and connect the hexagon center points
- Define the Radius with the remapped numbers
Curve attractor in grid 4/7
Curve attractor 3D gridlink copied
To make the result a bit more visible in 3D, we can of course also extrude the circles based on their distance to the curve. One method could be to remap the numbers again, but in this case, we will use a simple multiplication and a Z Unit vector to define the height. Finally, you will have to cap the cylinders.
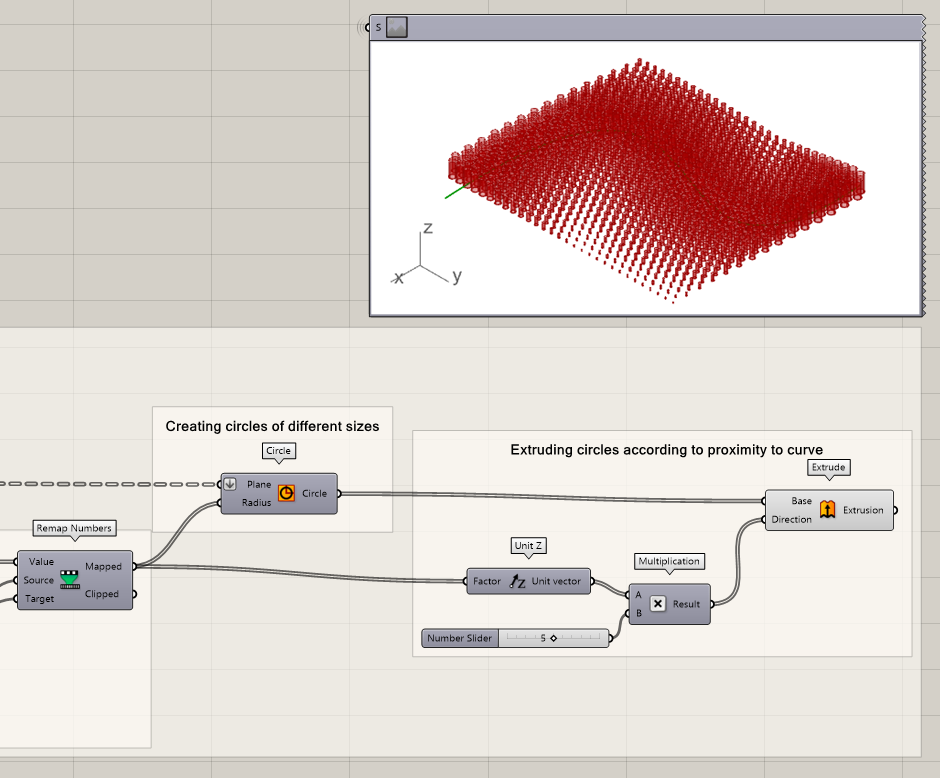
- Connect a Unit Z vector to the Mapped output
- Multiply the Unit Z vector with a factor
- Extrude the circles using the Multiplication output as Direction
Finally, you will have to cap the cylinders. The result is a cylindrical pattern in which the size of a cylinder is an expression of the distance to the curve.
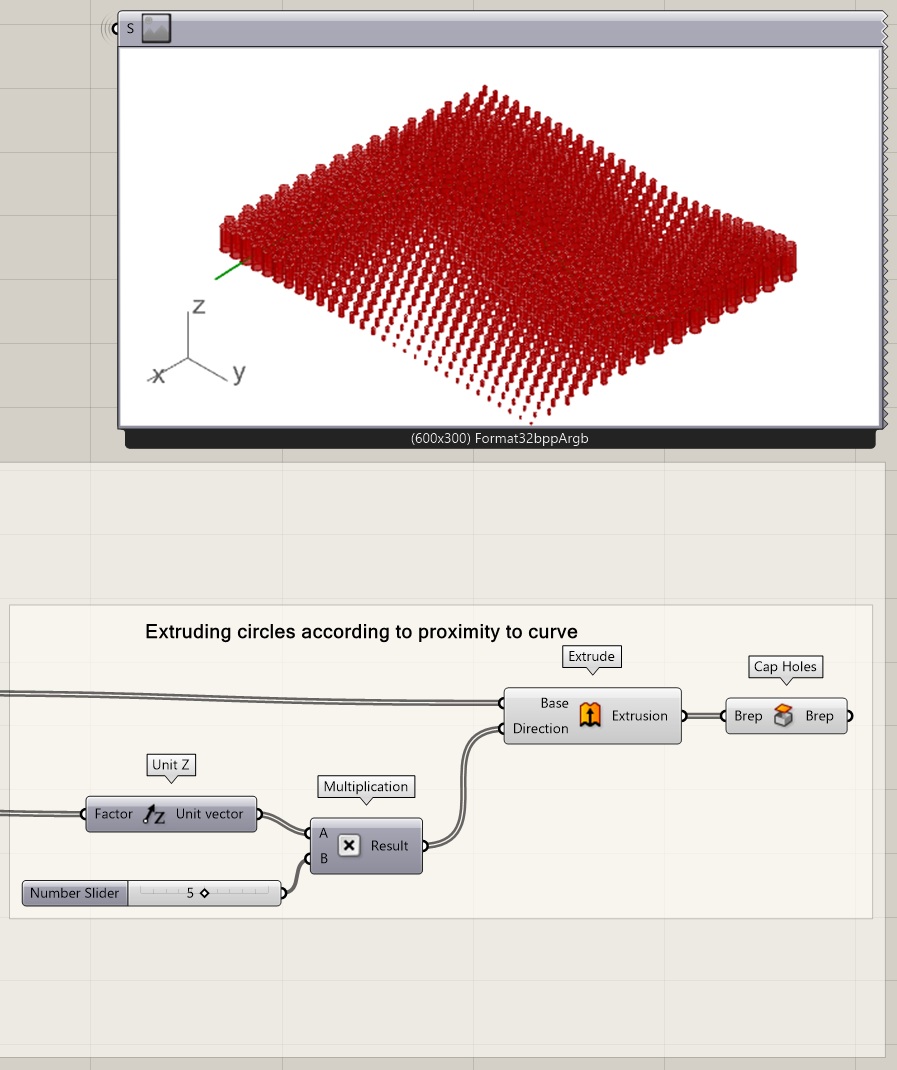
- Cap the cylinder holes
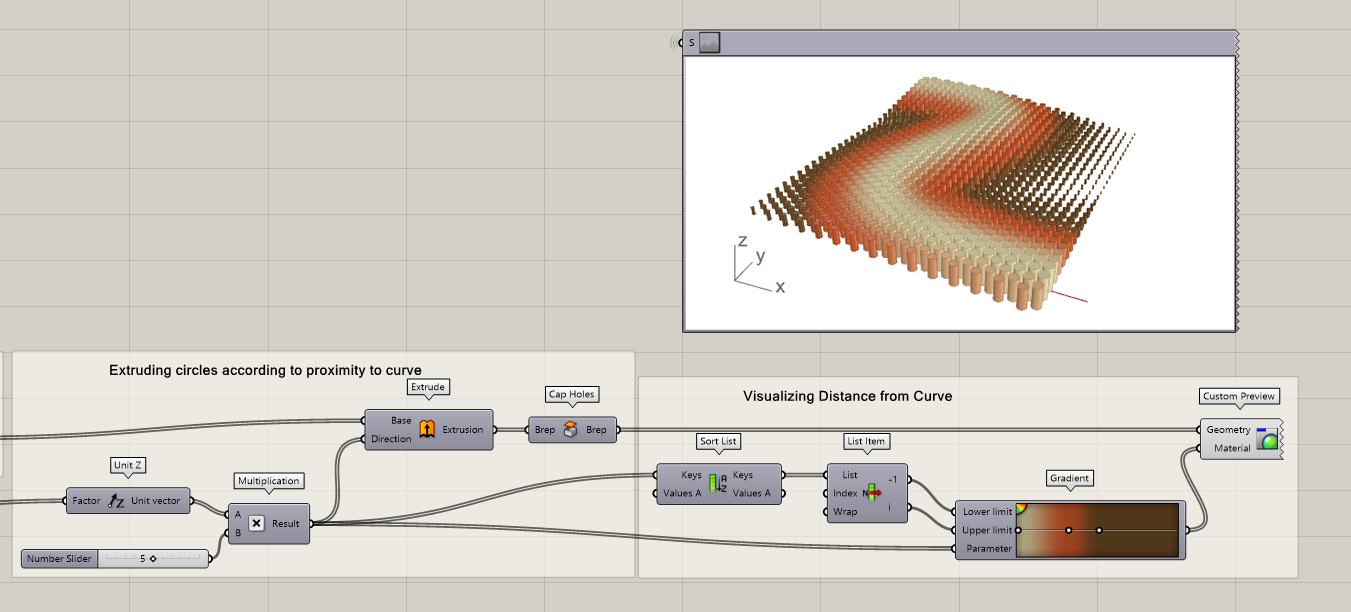
Visualization
You can also visualize your design in different ways. In this step we want to visualize the cylinders according to their proximity to the curve. To be able to do that you can:
- Use the sort list component to get the highest and lowest limits of our list
- Use List item to extract the highest and lowest values
- Connect the highest and lowest numbers to the Upper and lower limits of the gradient component to create a dynamic visualization
- Connect the gradient to the material input in custom preview and the brep caps to the geometry input
Curve attractor in grid 5/7
Geometry selectionlink copied
As alternative, you could also create a script where cylinders are removed if they are lower than a certain distance limit. This would lead to the following adjustments.
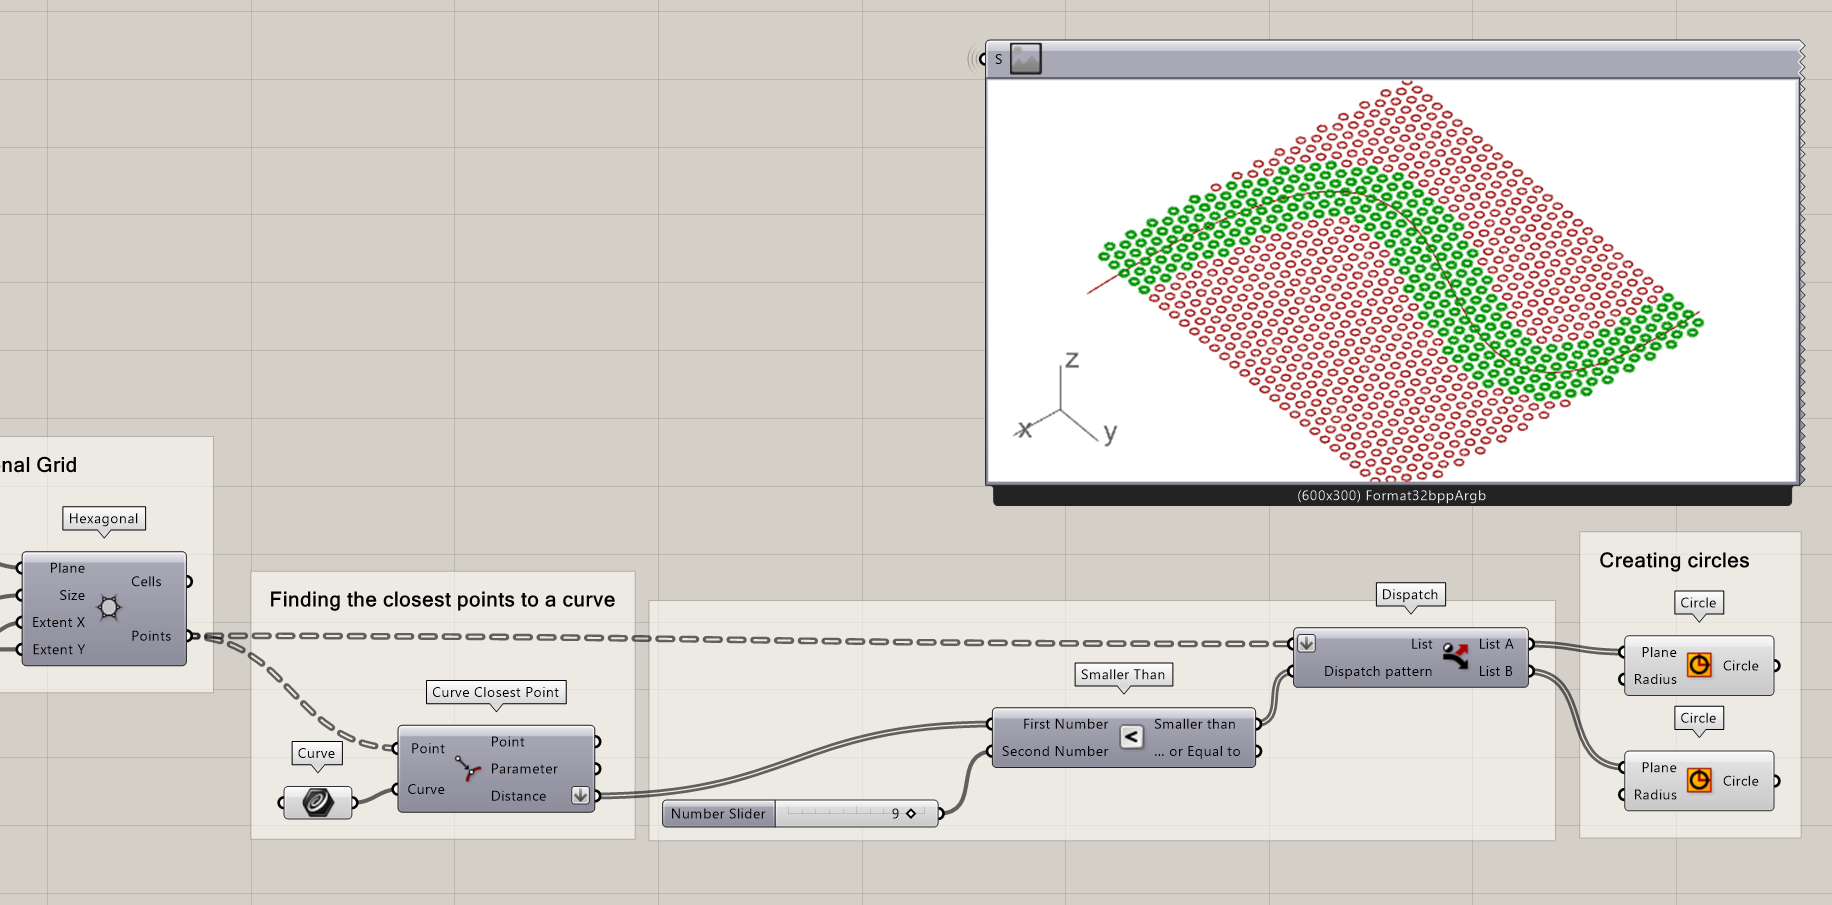
- Connect the grid points to the list in a dispatch component
- Dispatch the list according to a rule. In this case it is the smallest distance between the points and the curve
- Connect List A from the dispatch to the plane input in the circle component
- Extrude the circles in the Z-Direction
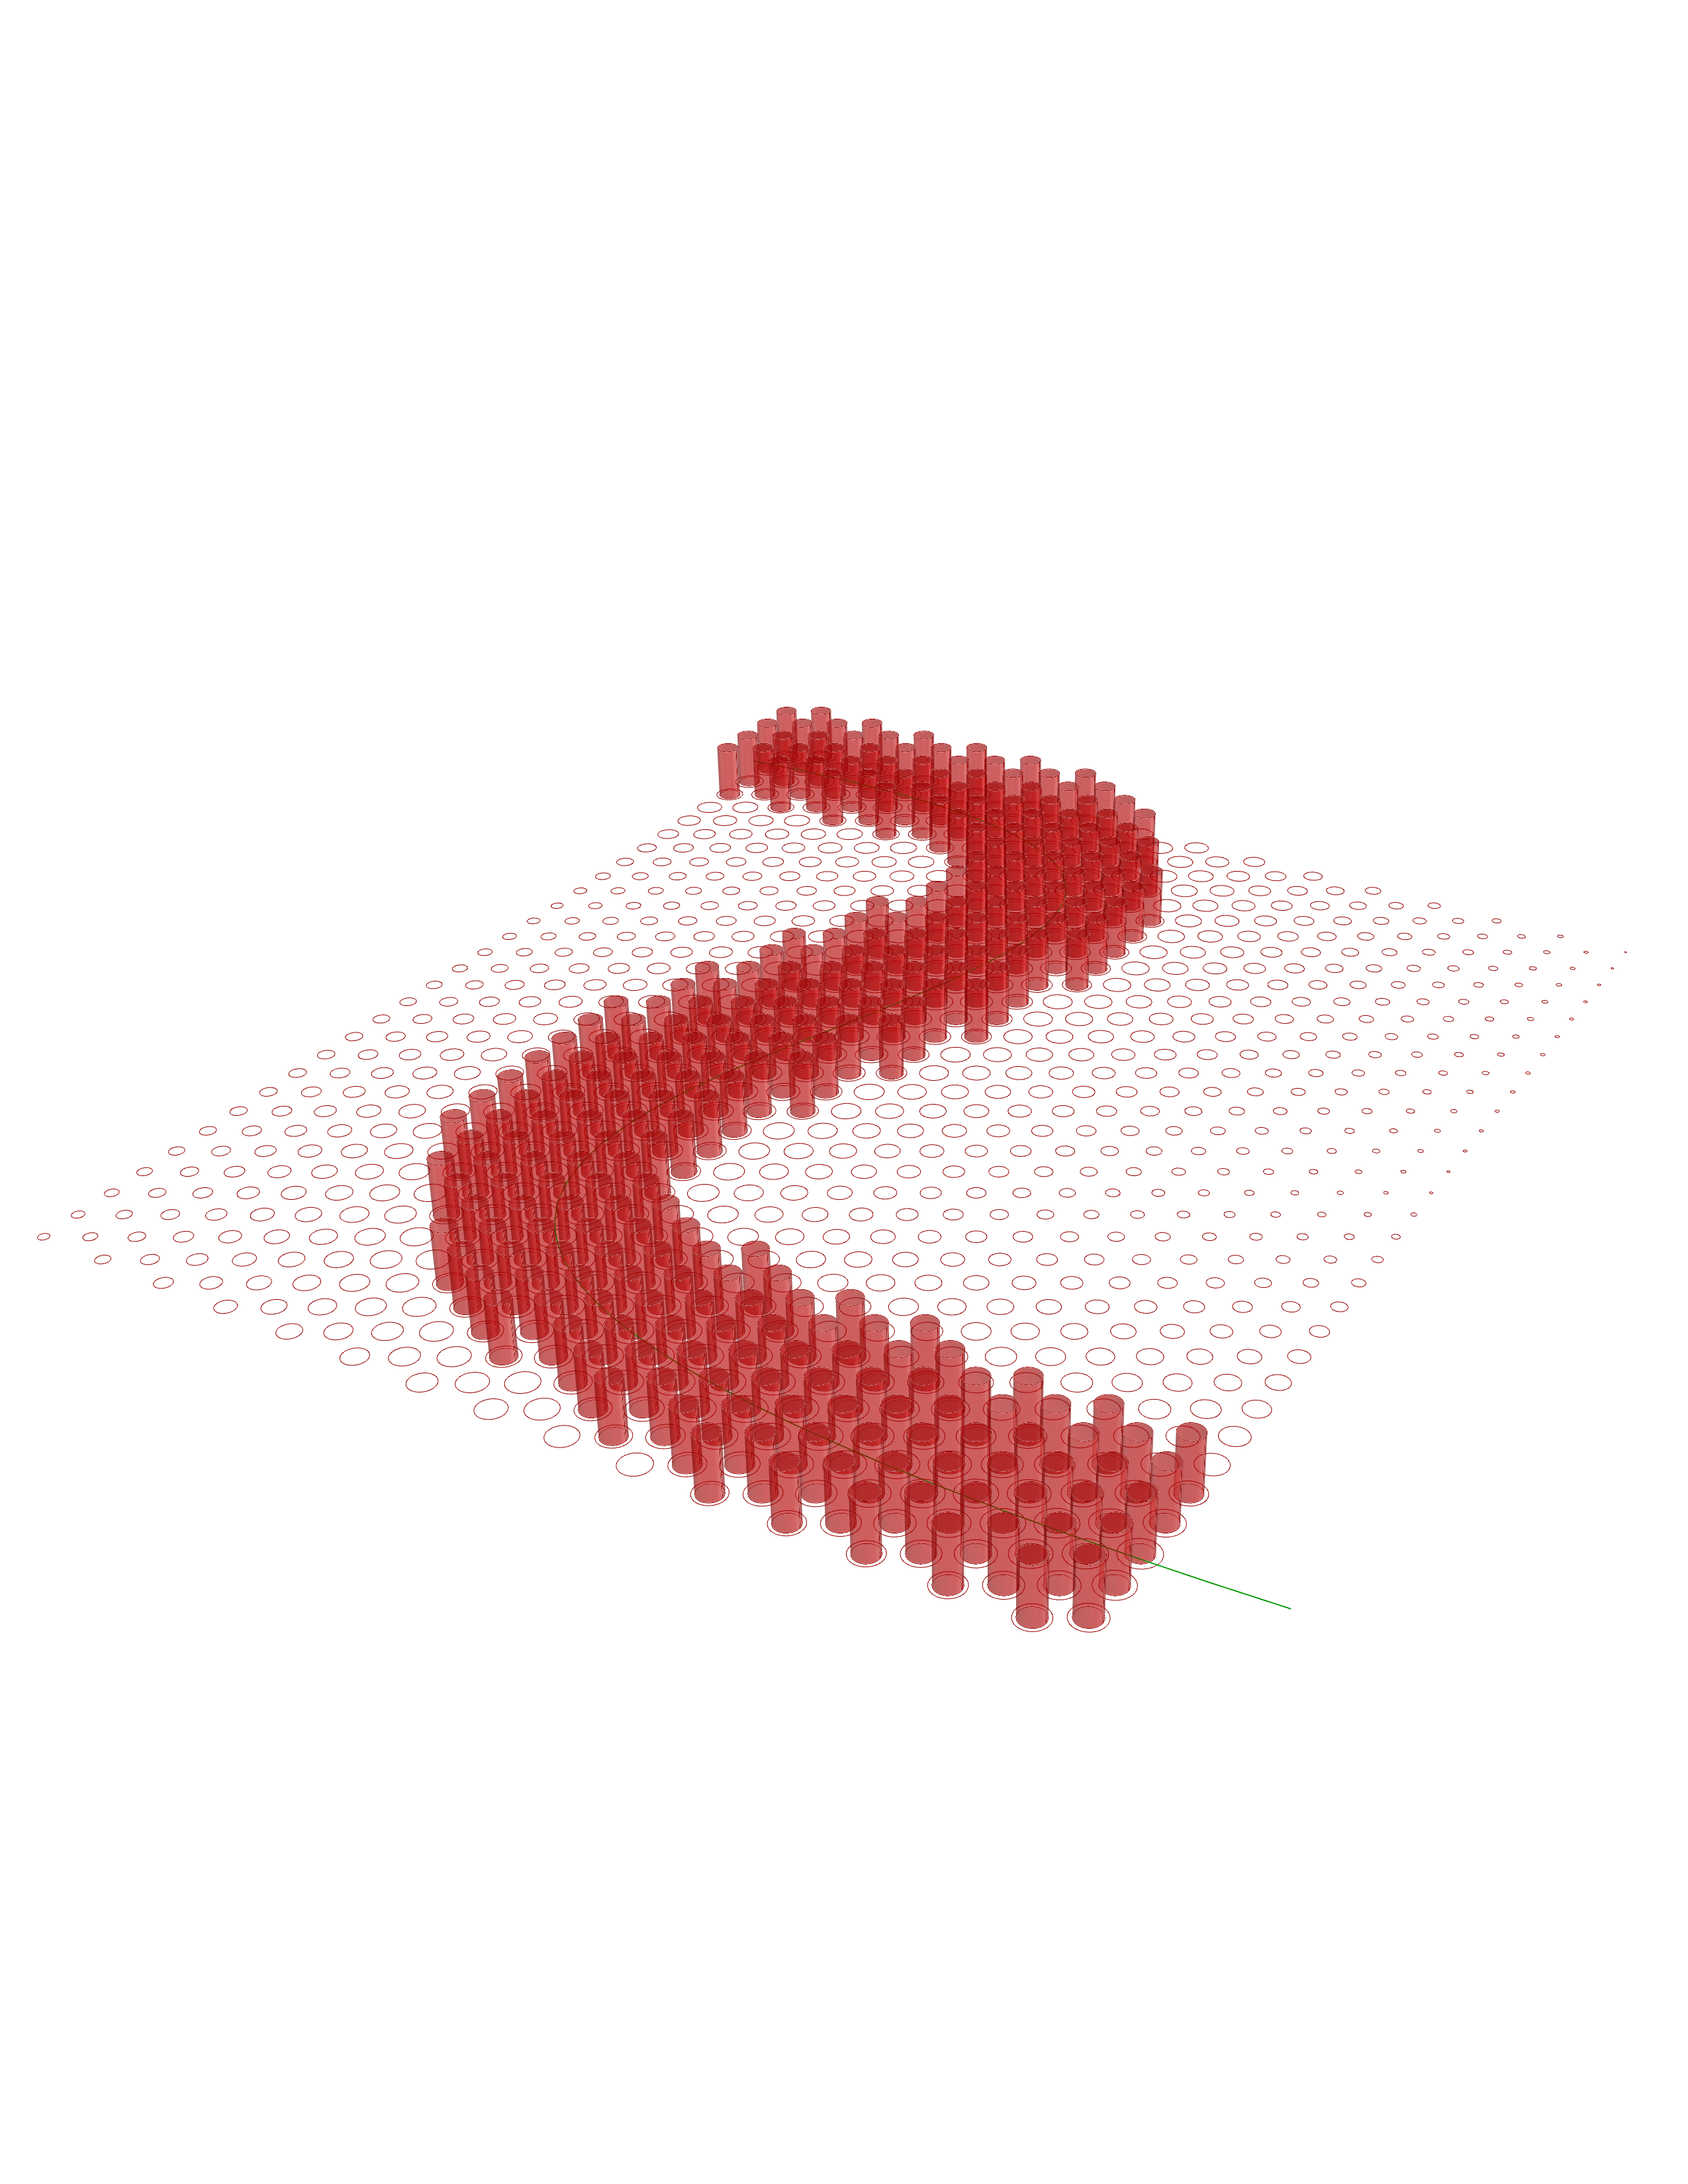
Now your final model looks like the following image.
Curve attractor in grid 6/7
Conclusionlink copied
This tutorial aims to give a basic overview of how to create a curve attractor on a 2D grid. You will also learn how to visualize your grid in 3D through different approaches using the distance between the curve and the grid points.
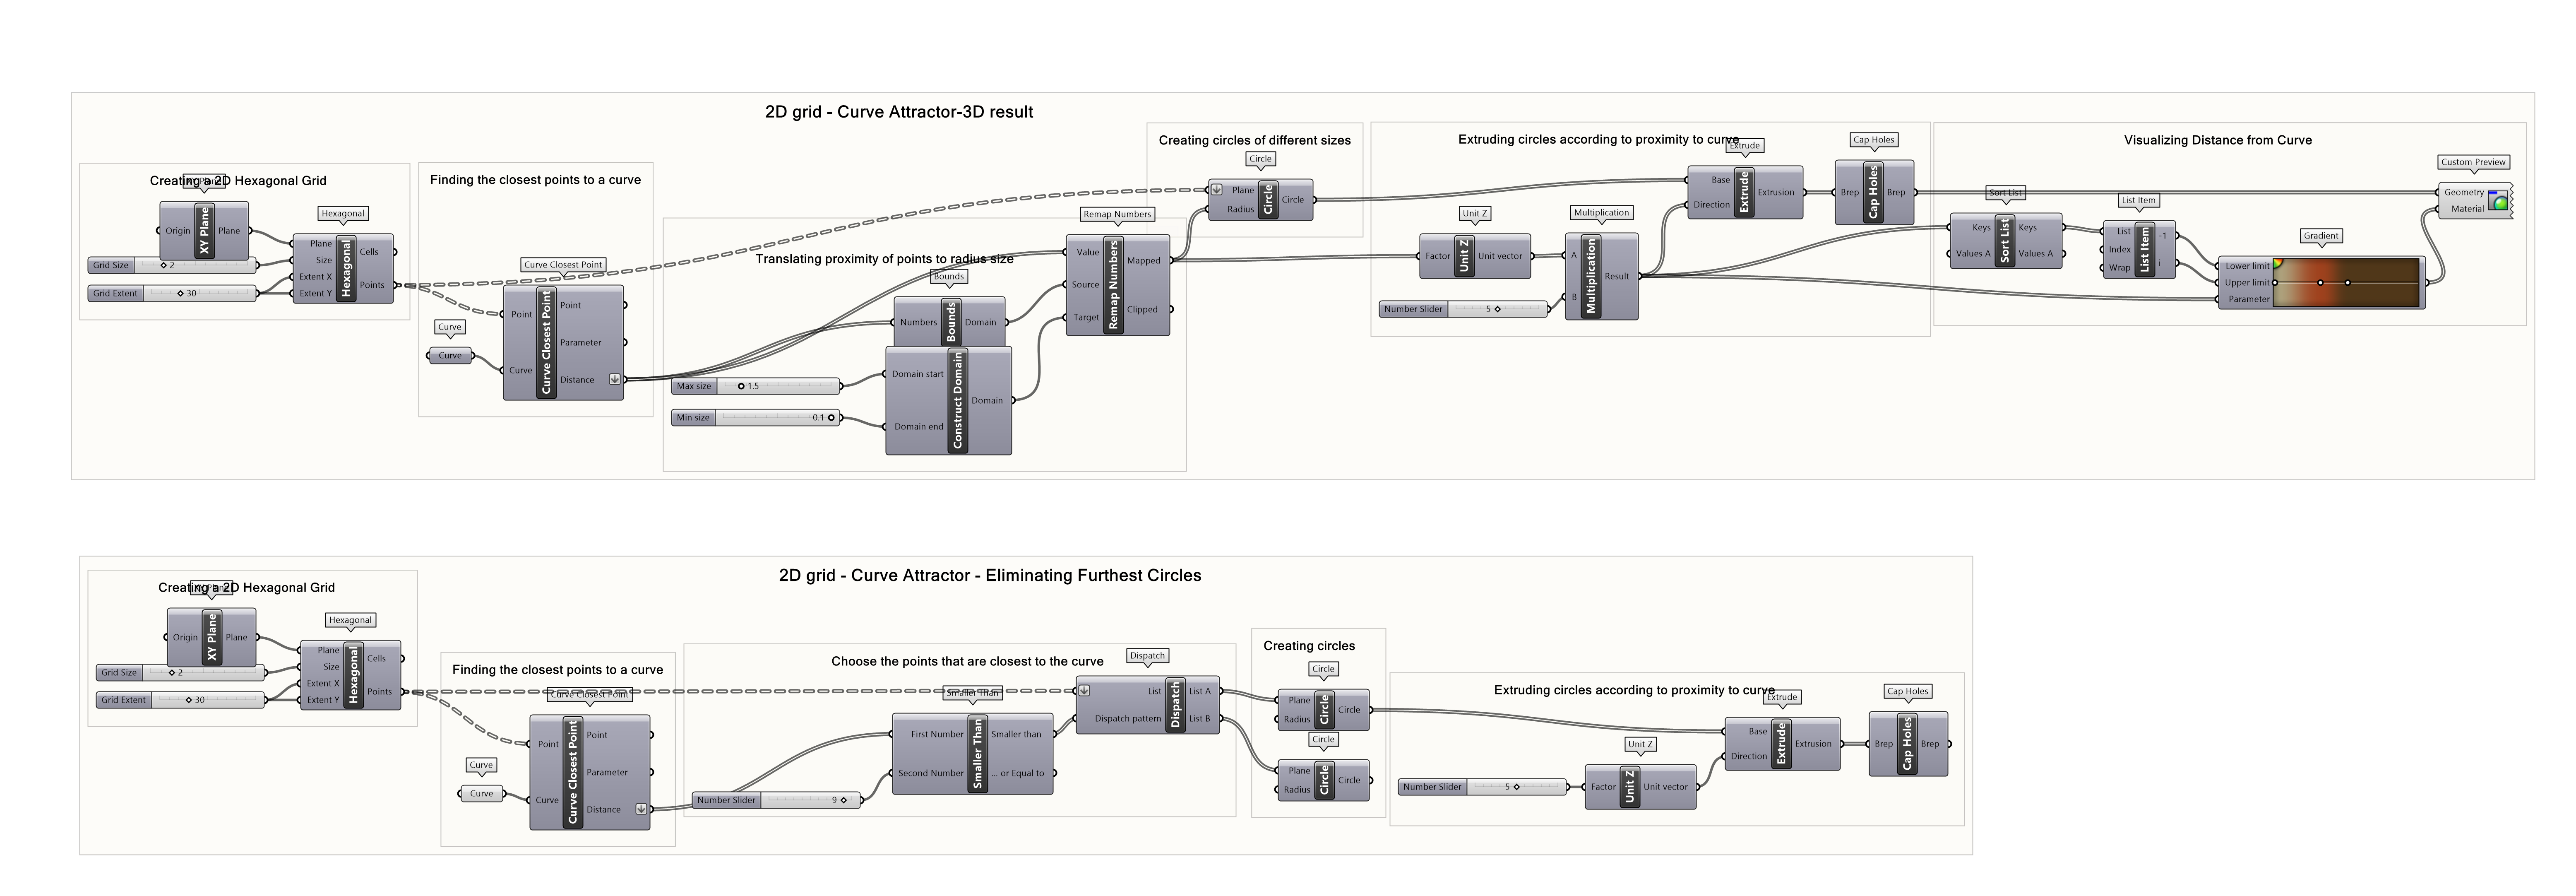
Complete exercise file
The final script includes two script option. In both script options you will find the 2D grid points and the curve attractor. In the first script you will find the gradient visualization of the 3D grid according to the curve. In the second script you will find the elimination of the points with greater distances from the curve.
Curve attractor in grid 7/7
Useful Linkslink copied
Linked Tutorials
Write your feedback.
Write your feedback on "Curve attractor in grid"".
If you're providing a specific feedback to a part of the chapter, mention which part (text, image, or video) that you have specific feedback for."Thank your for your feedback.
Your feedback has been submitted successfully and is now awaiting review. We appreciate your input and will ensure it aligns with our guidelines before it’s published.