Façade Panelization Geometry
-
Intro
-
Design
-
Basic façade geometry
-
Façade Panelization
-
Calculation Design Fitness Values
-
Visualization
-
Conclusion
-
Useful Links
Information
| Primary software used | Grasshopper |
| Course | Façade Panelization Geometry |
| Primary subject | Parametric Modeling |
| Level | Intermediate |
| Last updated | November 27, 2024 |
| Keywords |
Façade Panelization Geometry 0/7
Façade Panelization Geometry
This tutorial demonstrates a parametric approach to creating various façade panel subdivisions based on window placement within the façade.
This tutorial provides an example of a parametric way to create different subdivisions of façade panels depending on a window placement on a façade. The tutorial uses Grasshopper as parametric environment. A Grasshopper script is developed during the tutorial. This tutorial can be followed as stand-alone tutorial or as part of the BK3WV4 course (BSc course). If you are attending the BK3WV4 course, for you this tutorial is the first step in a sequence of tutorials about multi objective optimisation using the Wallacei plugin in Grasshopper. This tutorial assumes you are already familiar with Grasshopper, therefore it does not explain every detail of the script, but rather it’s general logic.
Façade Panelization Geometry 1/7
Designlink copied
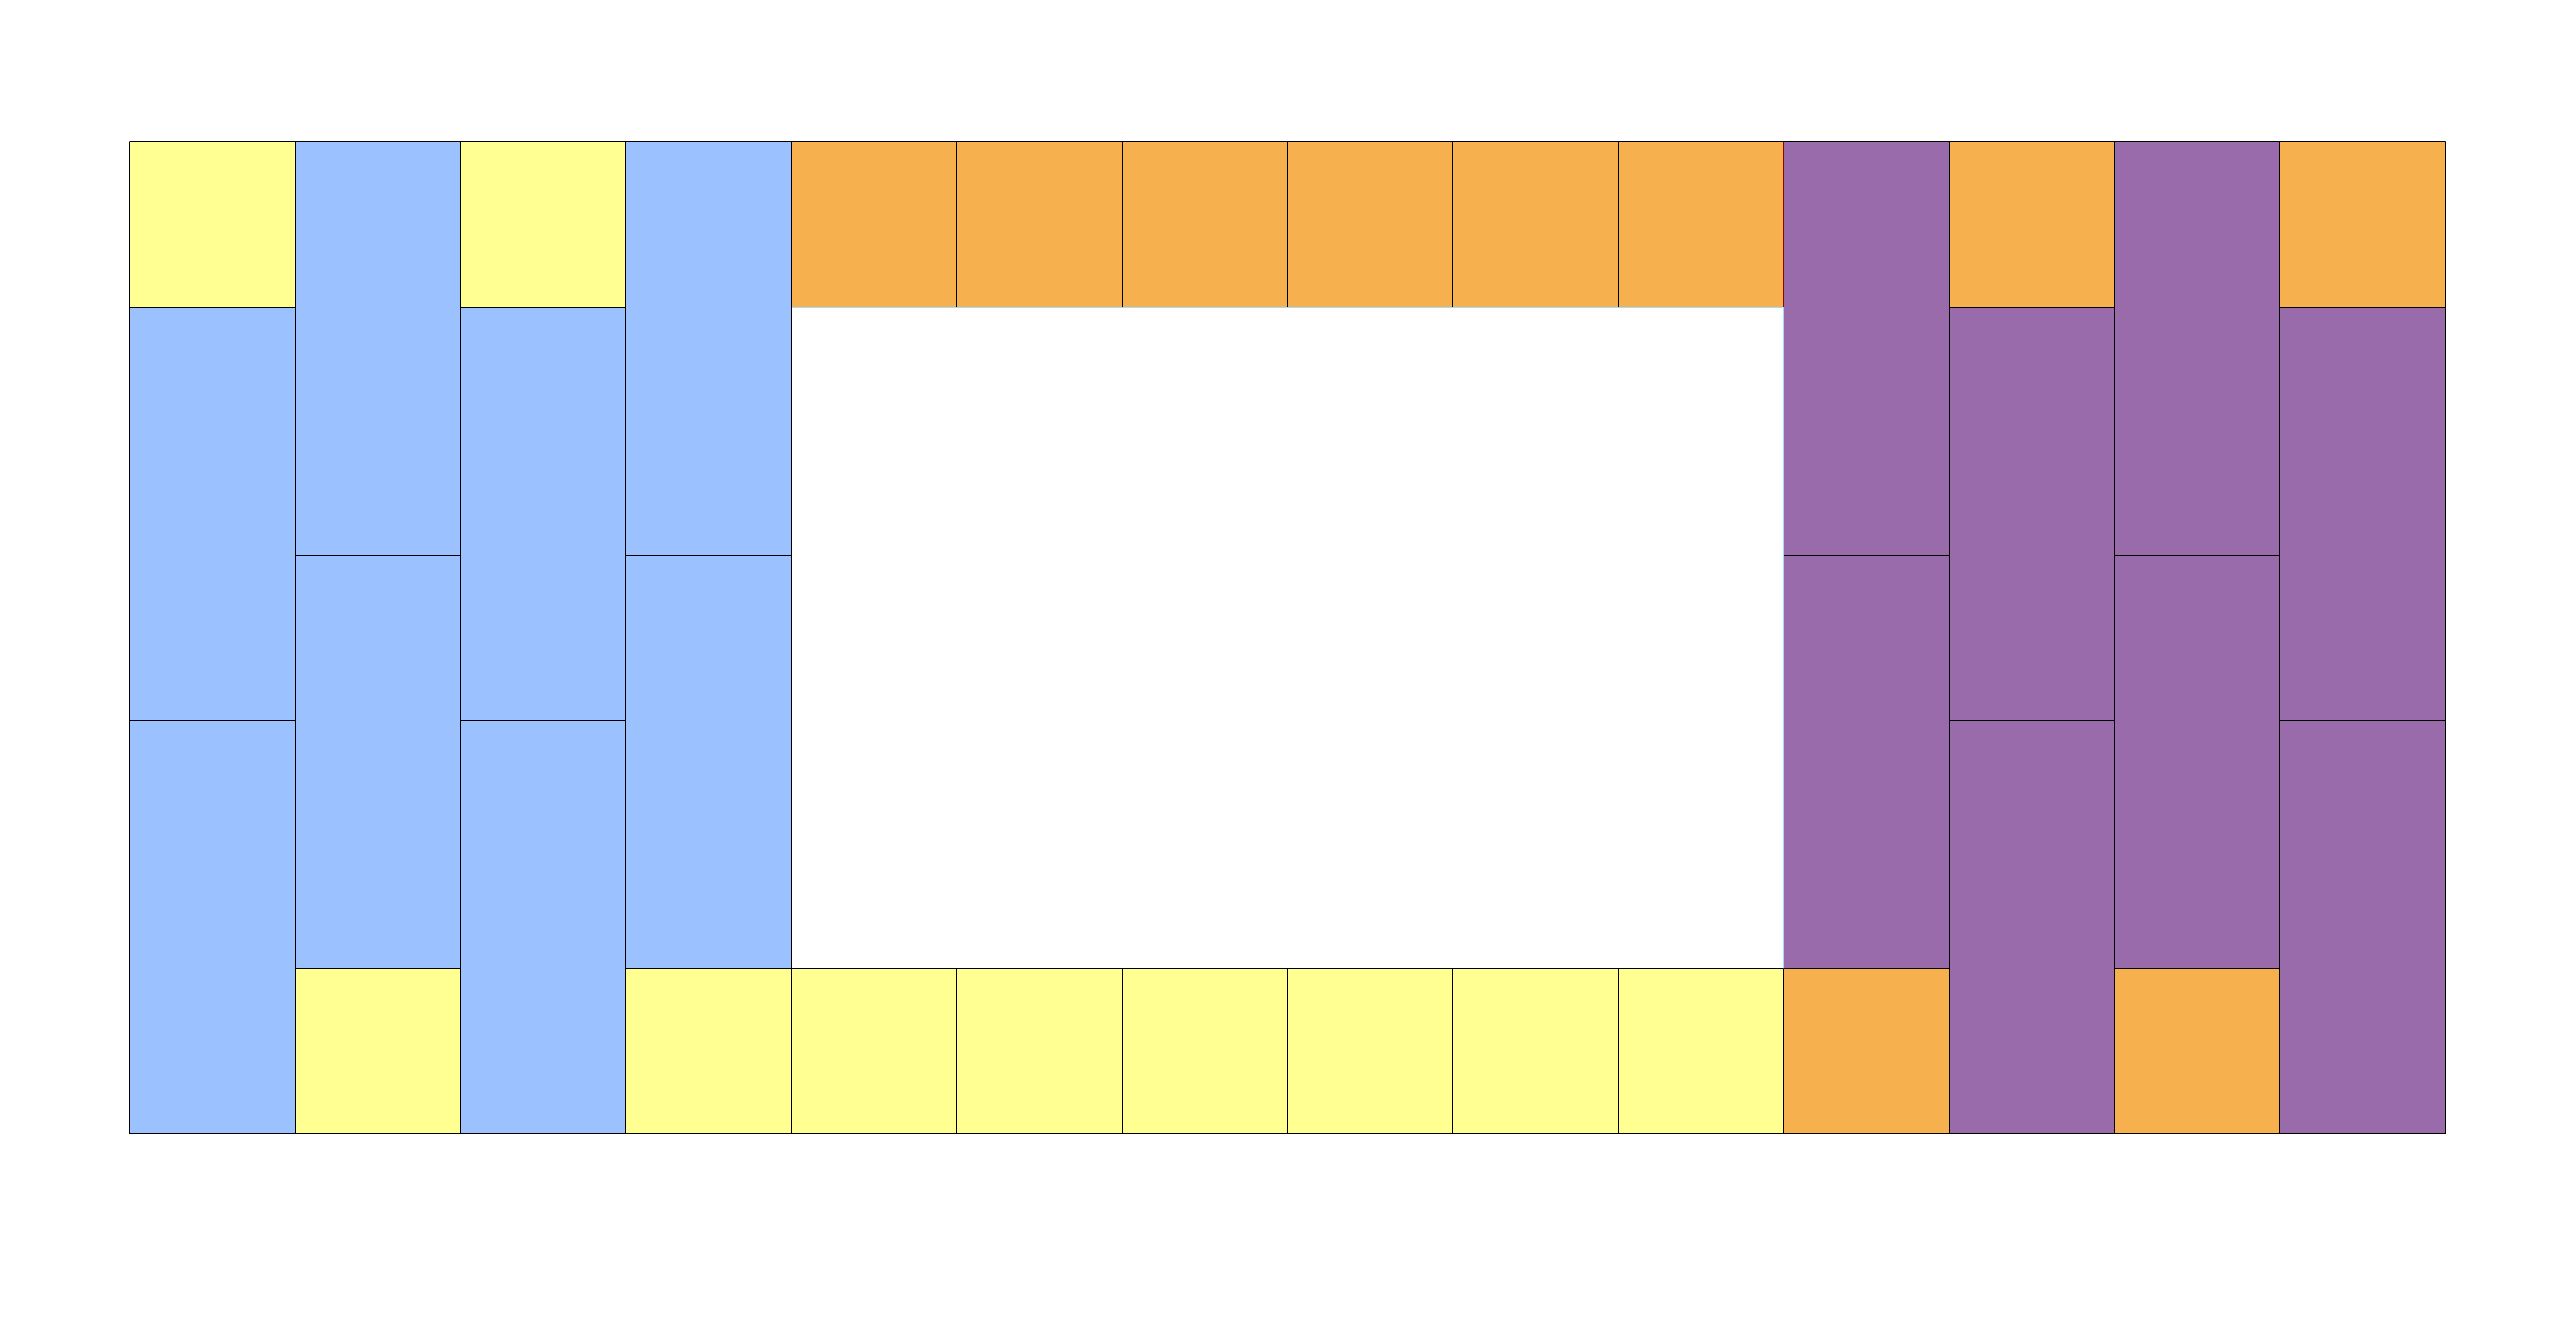
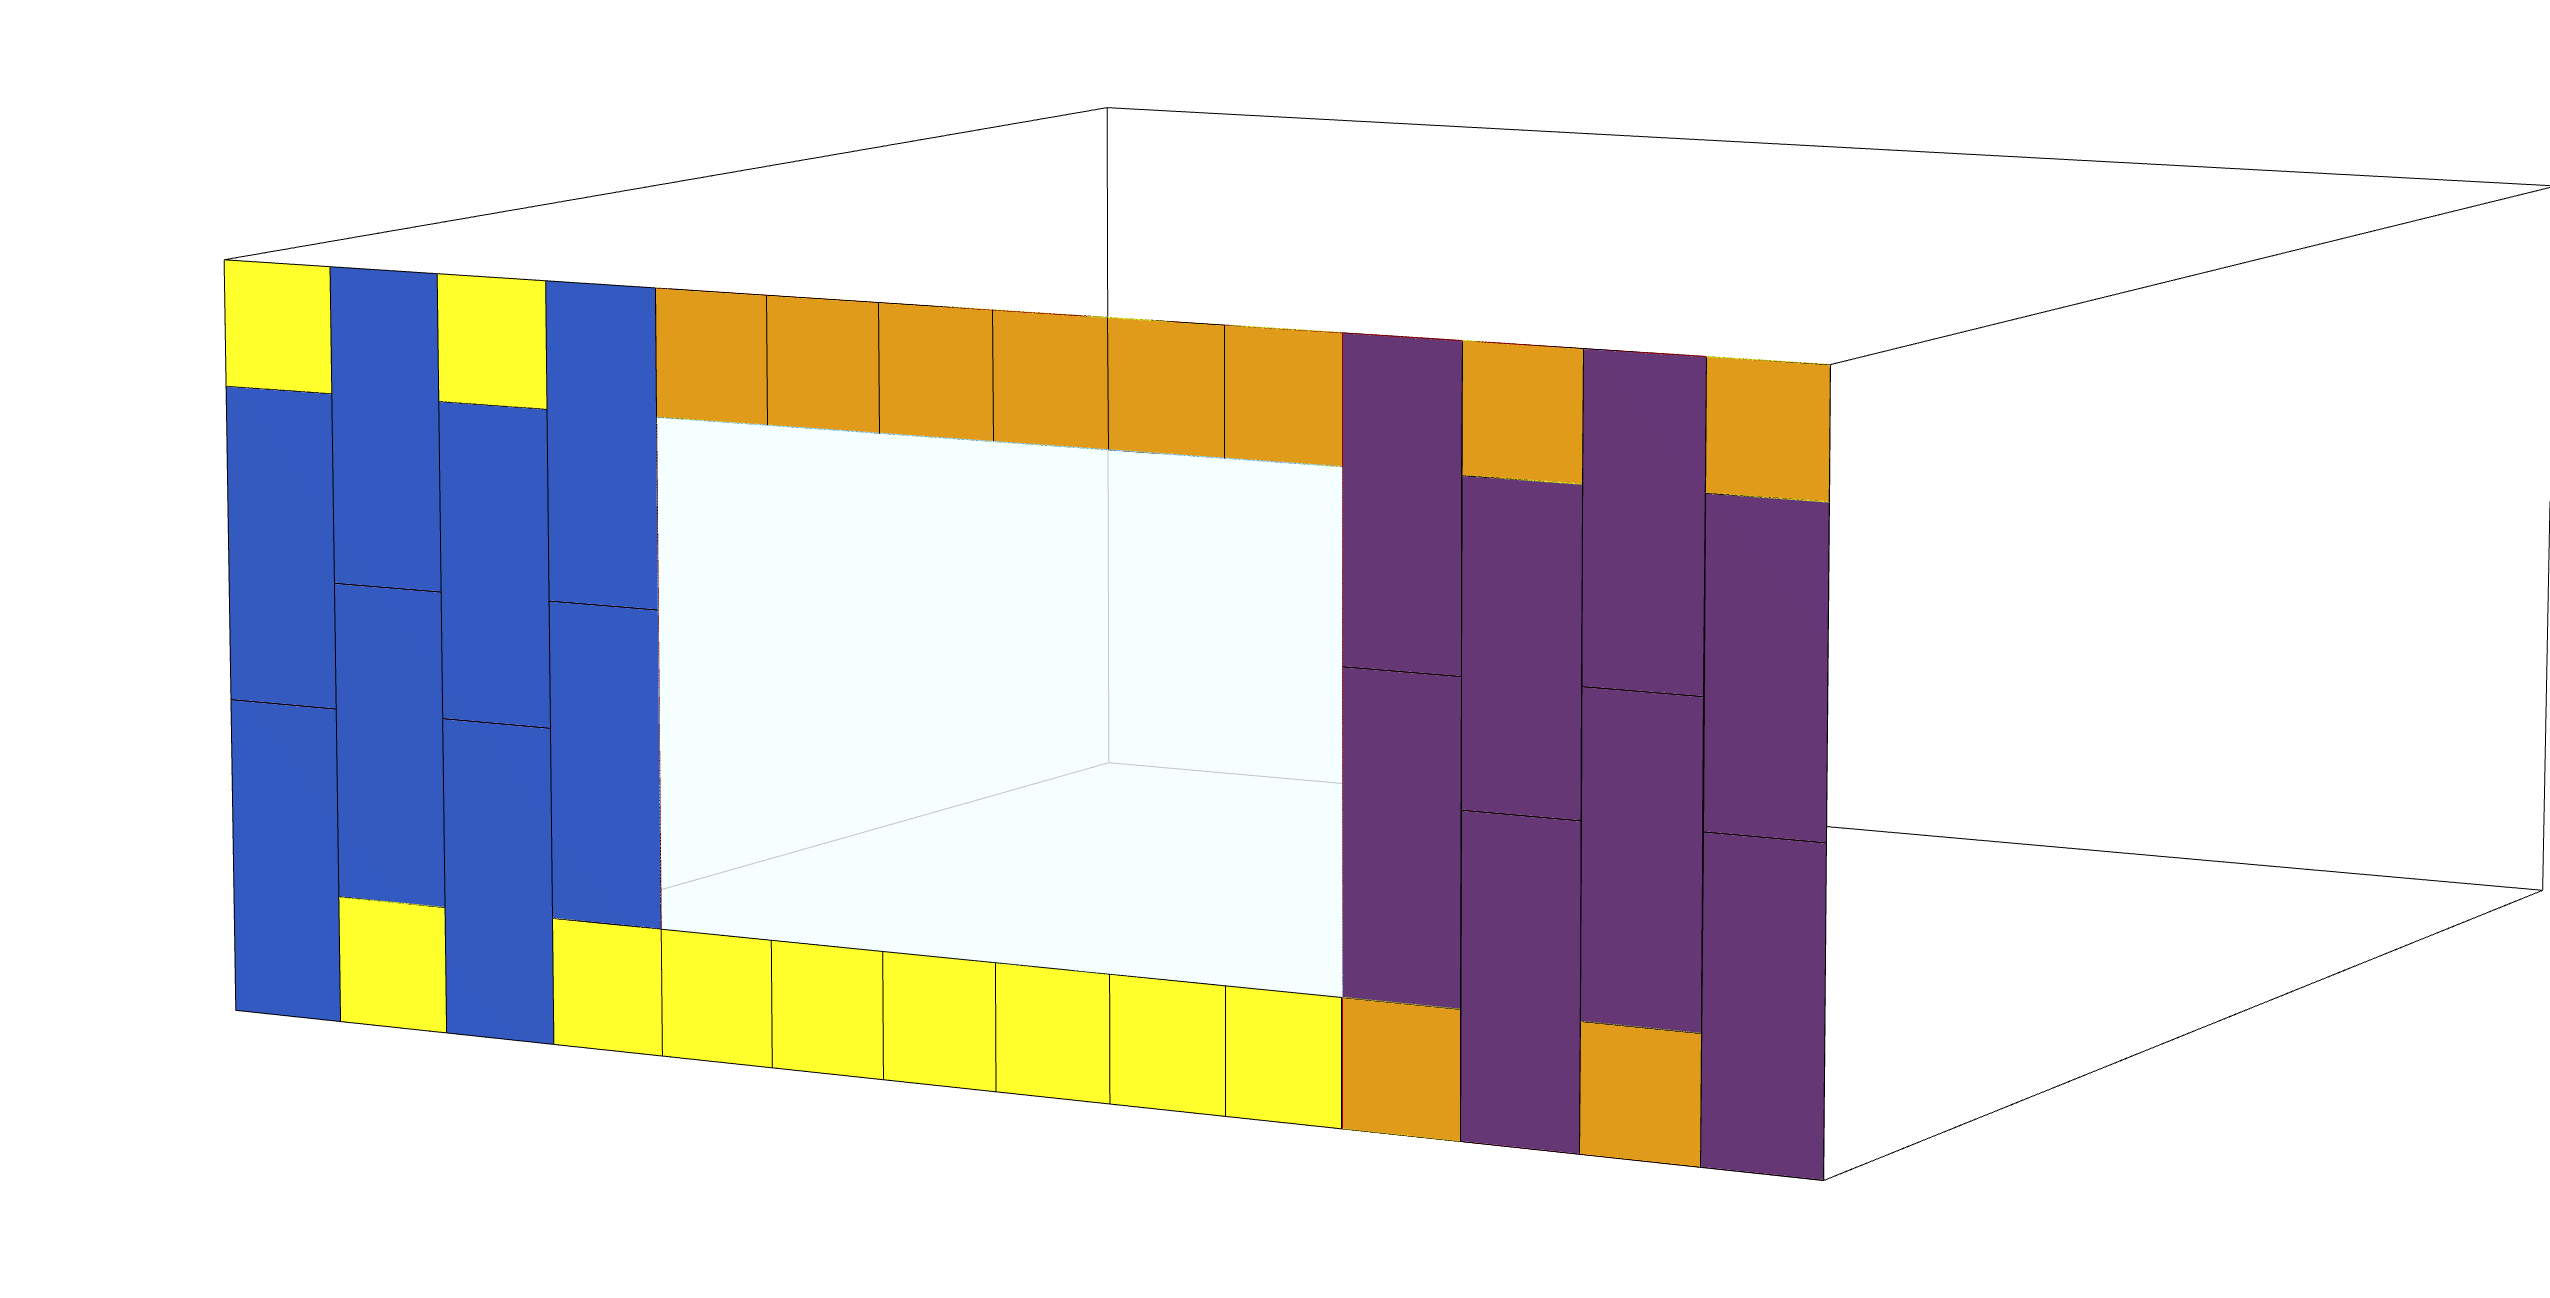
The purpose of this script is to create a façade with an opening (the window), while the solid part is later divided into panels. The window shall be placed in 9 different locations, 3 by 3-point grid in the middle of the façade. The inputs are window height, width, and placement. The outputs should be façade panels grouped by their similarity.
Façade Panelization Geometry 2/7
Basic façade geometrylink copied
In this first part of the tutorial, we’ll start by creating the foundation for our panels. We’ll begin by designing a room that measures 7x10x3 meters, which will serve as our workspace for this and future tutorials. After setting up the room, we’ll design a parametric window, meaning a window that you can easily adjust. You’ll be able to control its height, width, position, and other features to fit your design needs perfectly.
Façade Creation
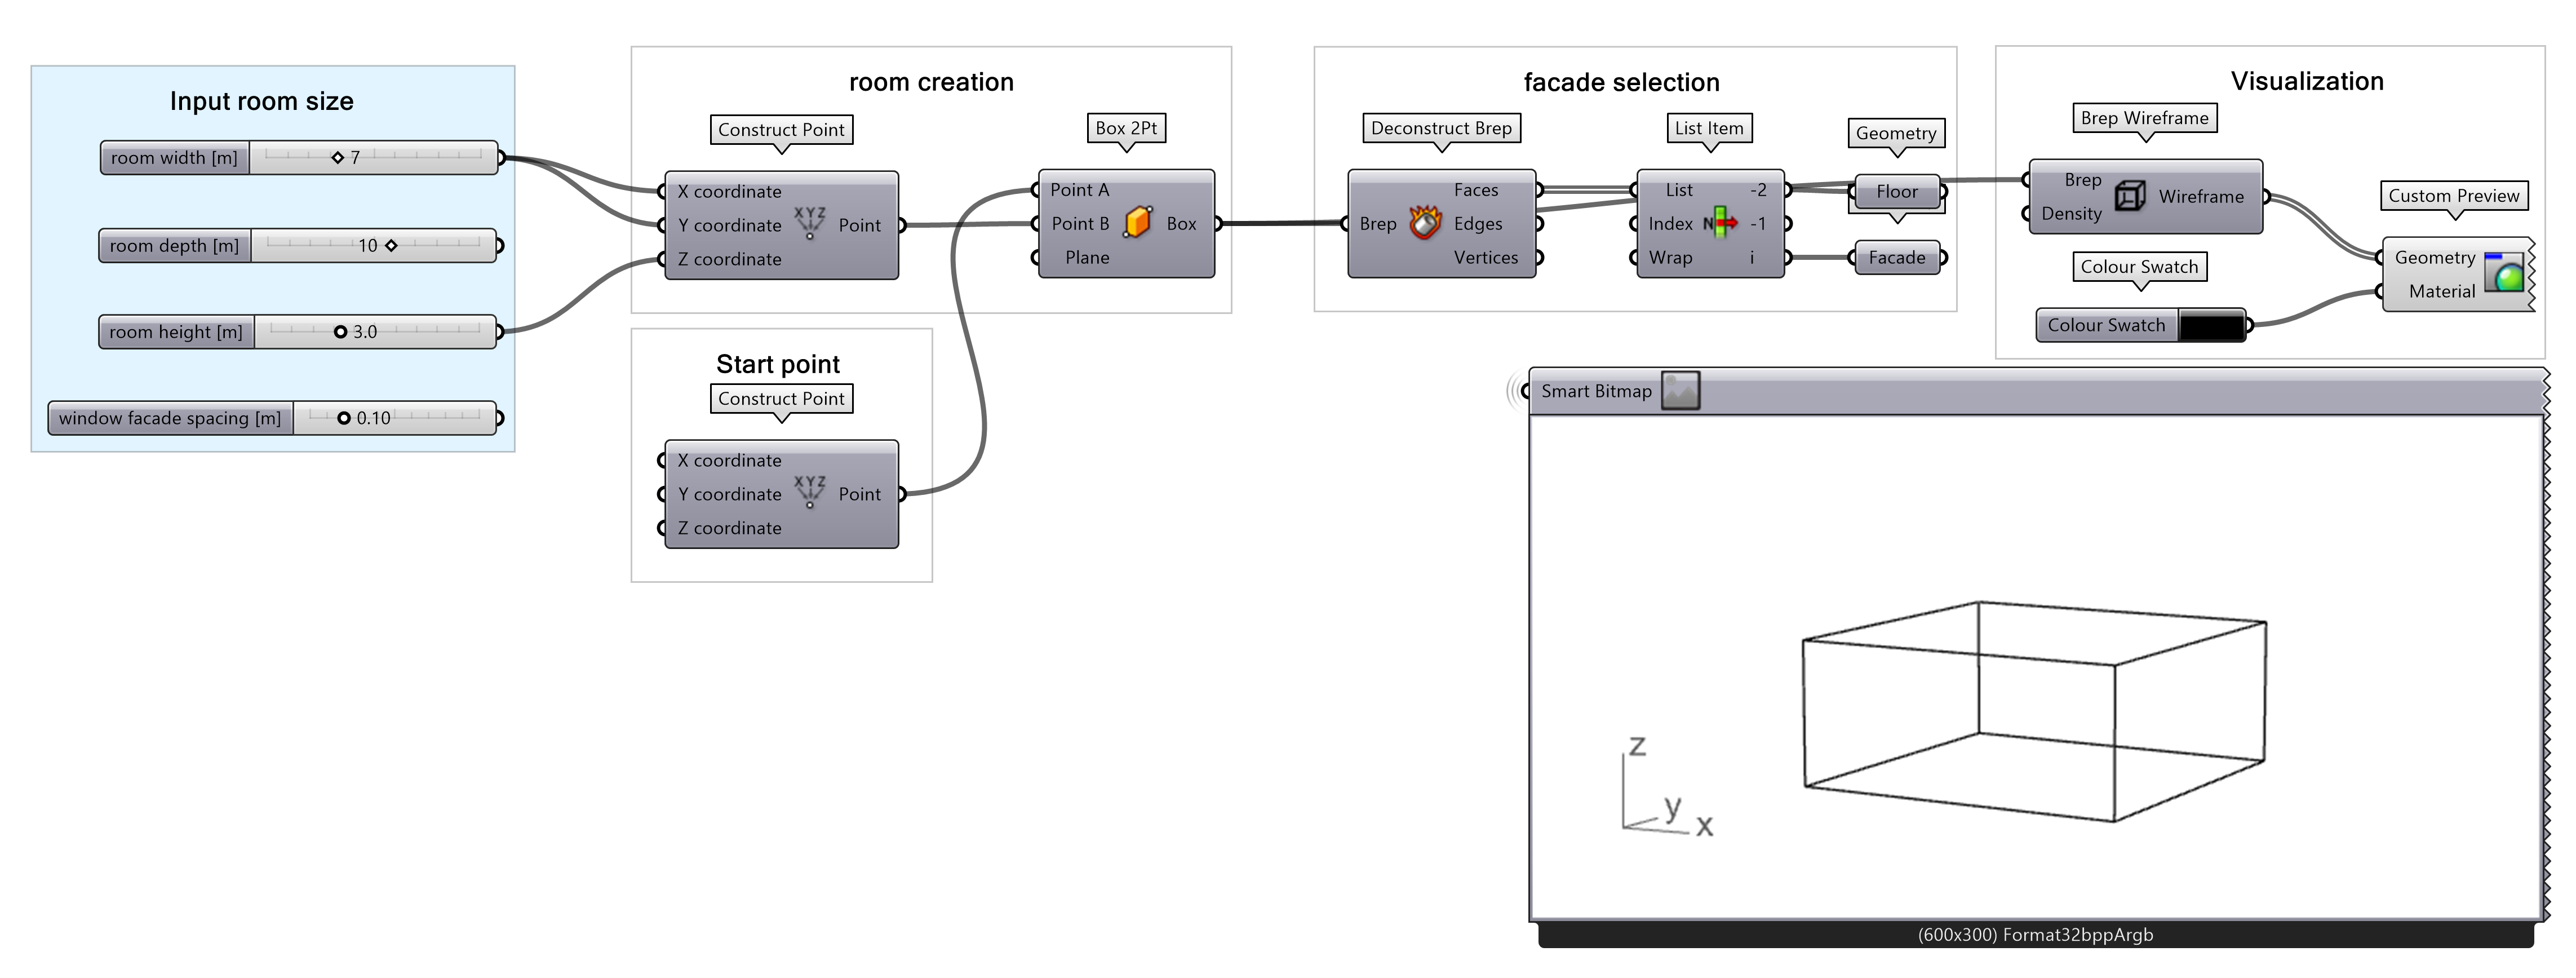
First, we’re going to make a box representing a room. We do this by using a “Box 2pt” component. First point is the origin point (0,0,0) and the second is defined by the room width (same depth) and height. From that box, we can extract the front wall using the “Deconstruct Brep” component.
Window Creation
Then, we create a window surface, also with a “box 2pt” component, but this time the box is 2-dimensional, with inputs being the origin point, and a point made by combining window width and height.

Window Placement
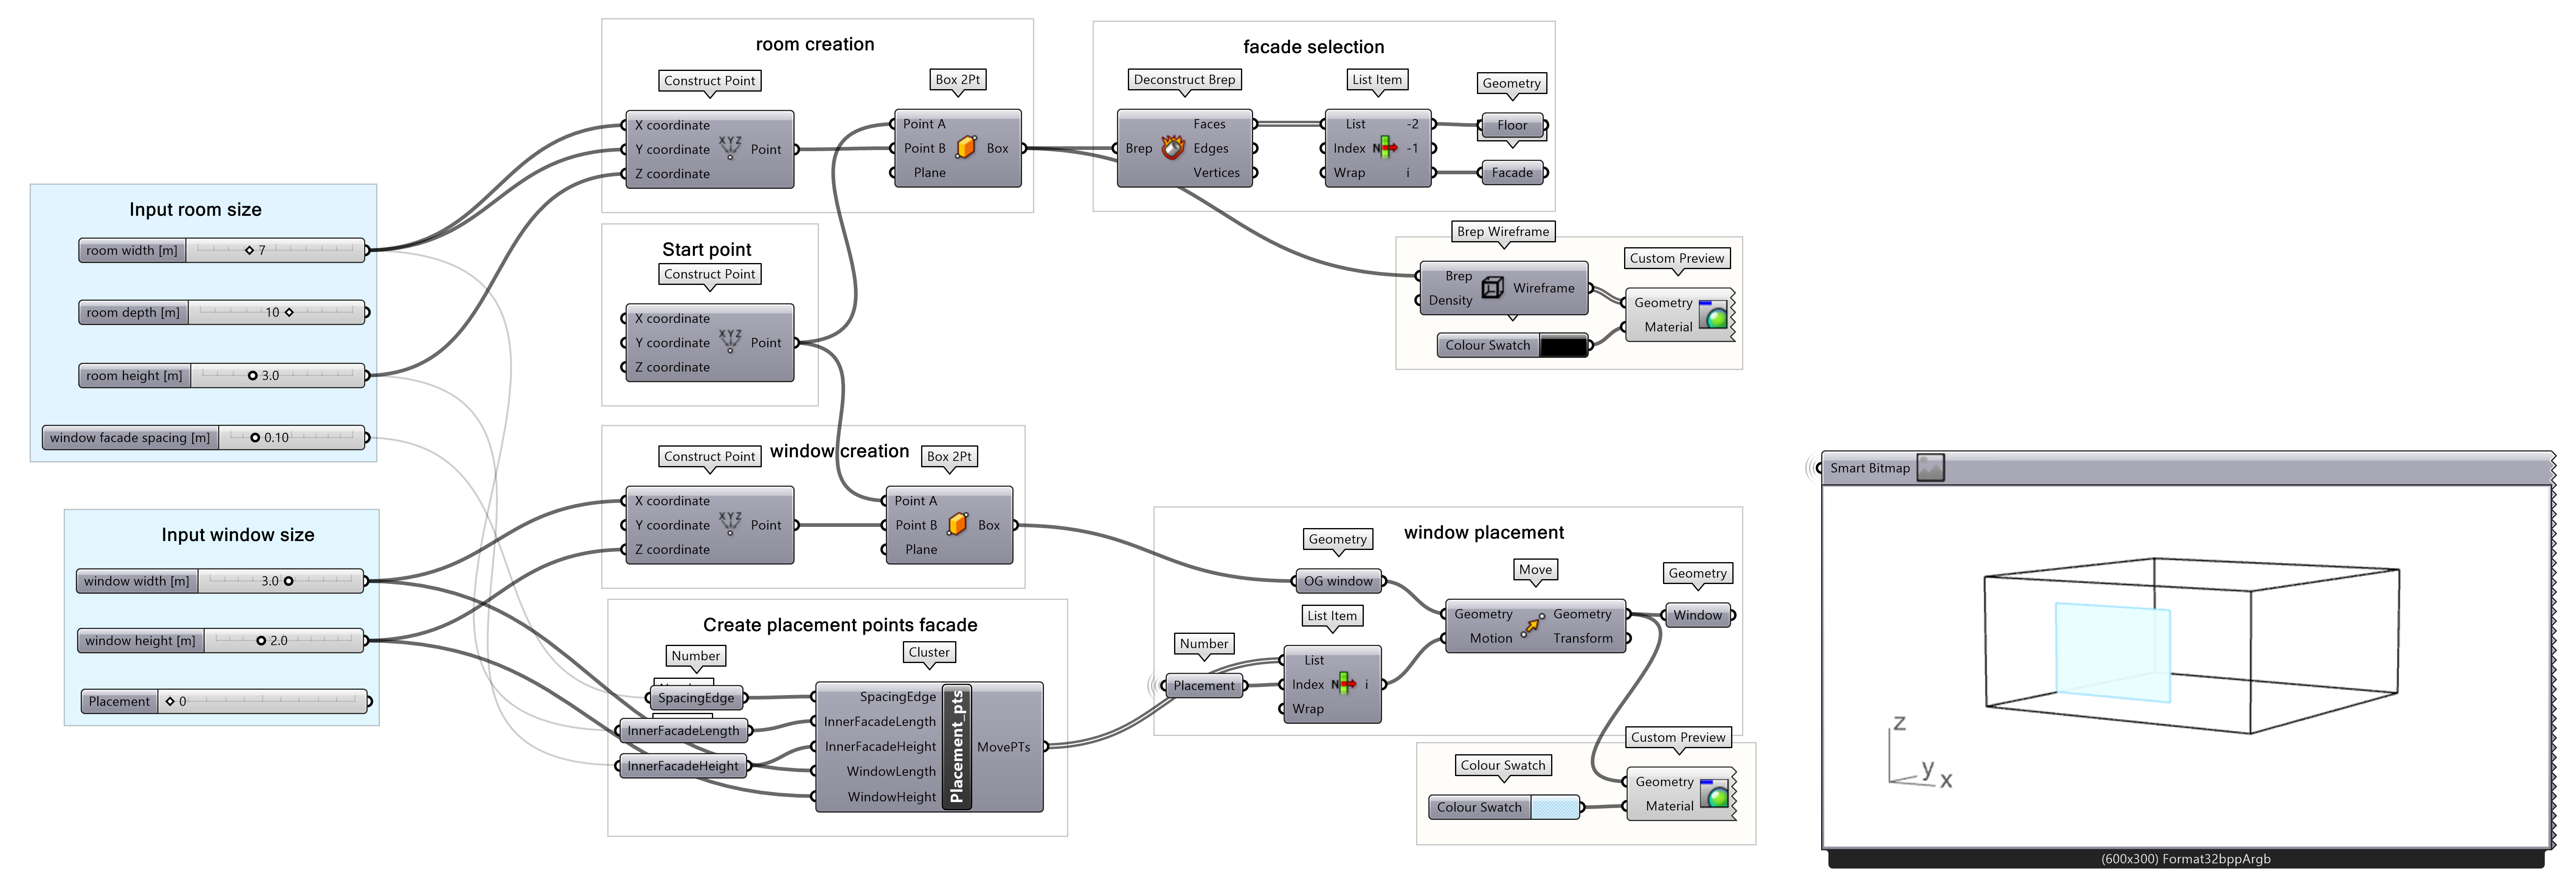
Later the window must be placed on 9 points, imagine a grid of 3×3 which looks like a scaled down version of the wall on which the window is placed on, keeping the ratio of the wall height and width the same. Also, the window should not touch any of the edges of the wall, being distanced from the edges by some margin defined by us. This is being done by a cluster of components made for that purpose only. We are not going to go into detail with this one, but please check it out if you want to understand more clearly.

Then the only thing left is to move the original window to its new location on the wall, defined by points just created with the custom cluster. Up until this point, we have this setup:
Façade Panelization Geometry 3/7
Façade Panelizationlink copied
In the second part of this tutorial, we’ll create the panels for the façade. We’ll start by defining the façade and window, which will allow us to make an initial division of the surface. Then, we’ll divide each section into our chosen pattern. Throughout this section, you’ll notice several clusters. To explore the details within a specific cluster, just double-click its centre; this will open the script for that cluster’s function, letting you see and edit how it works.
Dividing Façade for Panels
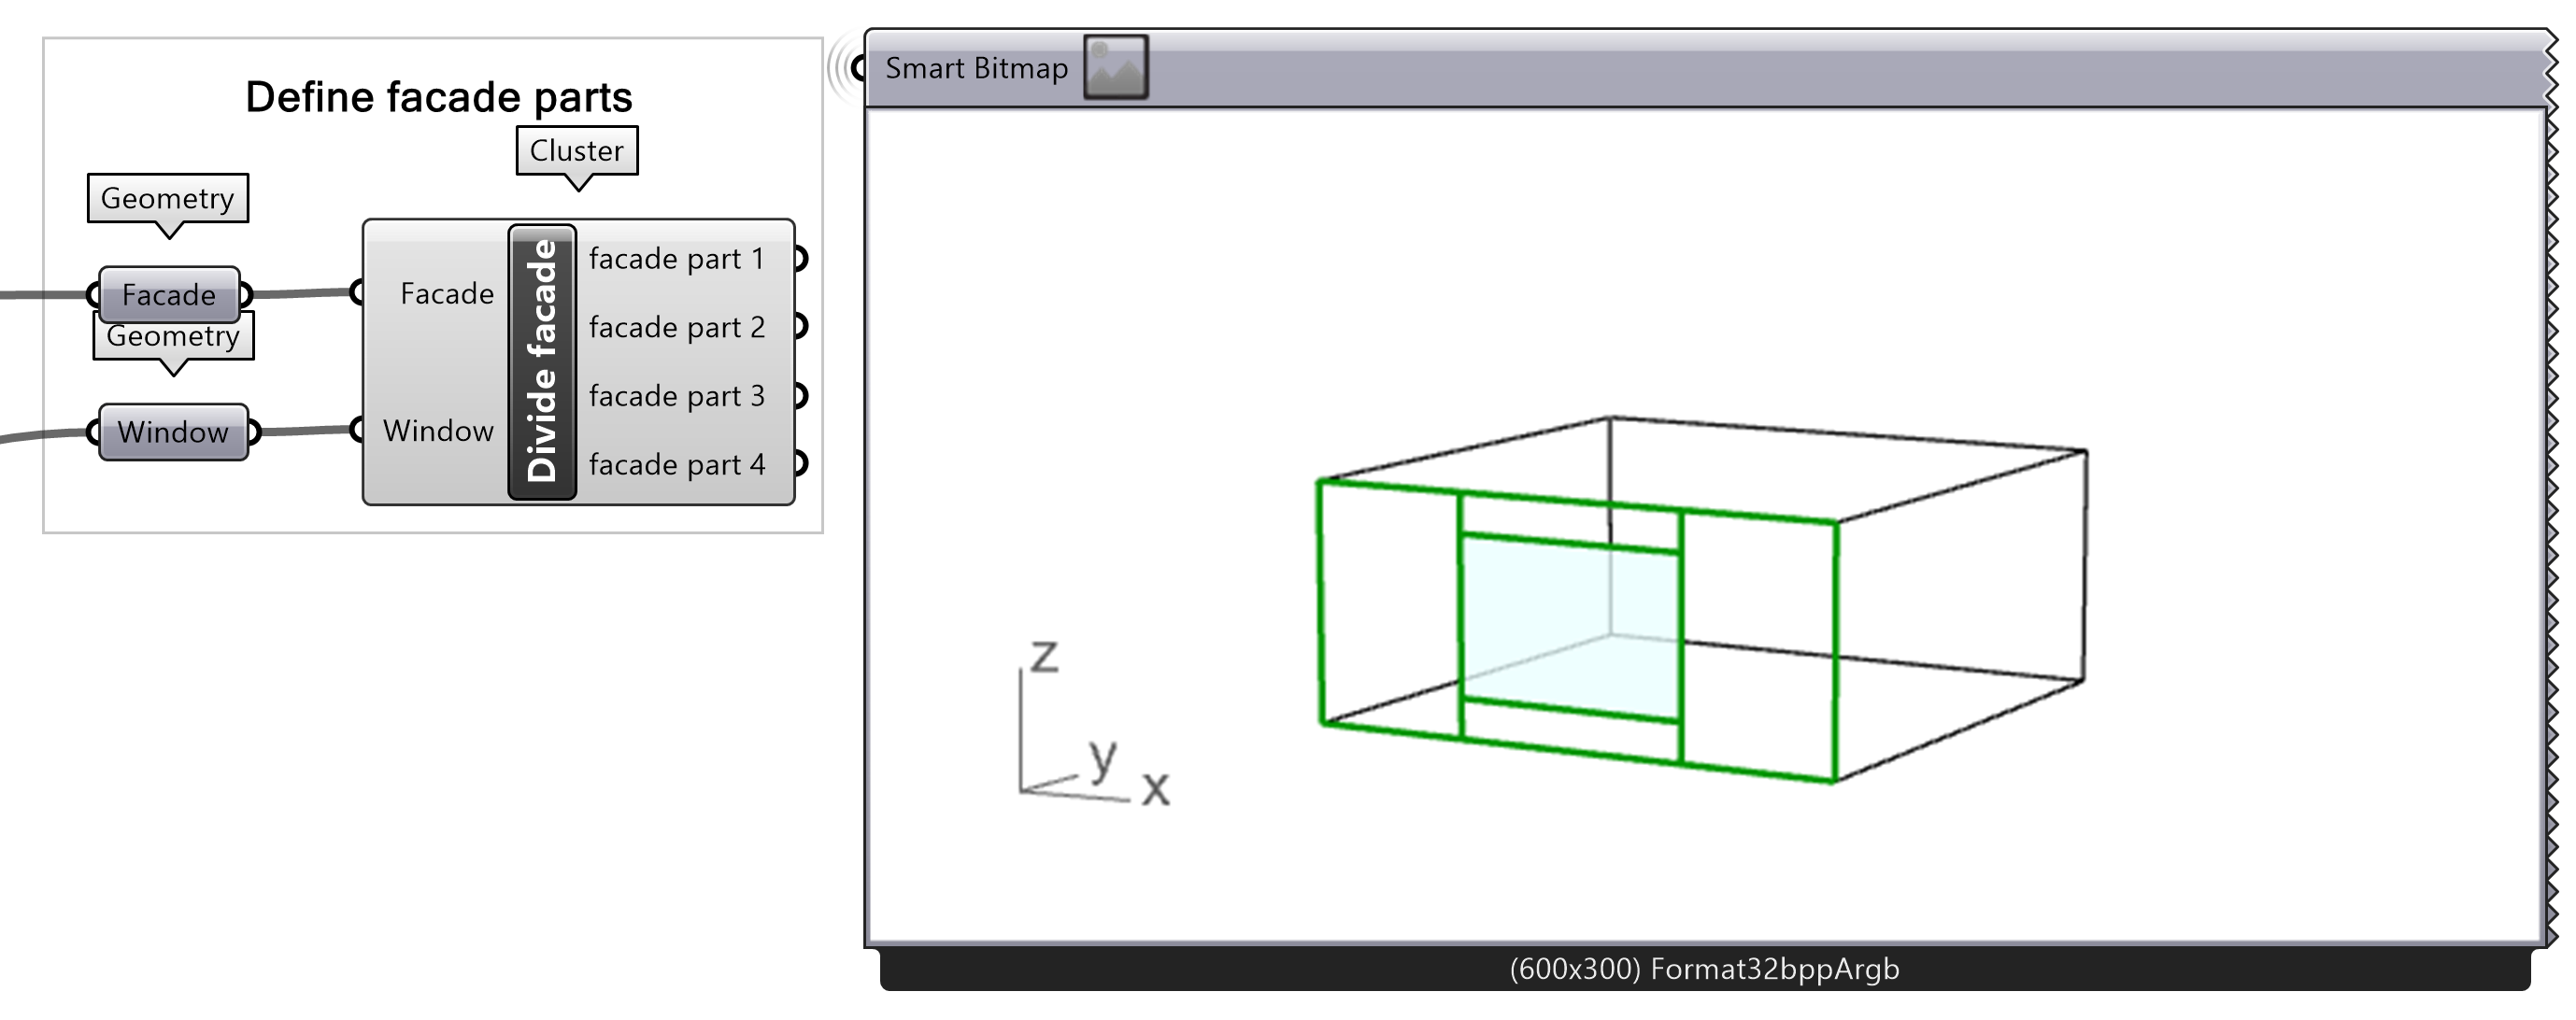
First, the whole façade – which is the resulting surface after subtracting the window surface from the wall surface – will be divided into 4 surfaces. 2 vertical surfaces on the sides of the window, and 2 horizontal surfaces above and below the window.
This is being done by a cluster of components which takes the façade and window surfaces as inputs, and outputs beforementioned 4 surfaces. If you double click on the cluster component you will find this script for the division. You are invited to examine it in detail, but in this tutorial, we are going to move further.

Creating Panels
After that, each surface is taken by another cluster to further divide into standardized panels. The cluster inputs are also: fixed panel (maximum) width, and height (two different values depending on the main panel placement). The cluster outputs a collection of small panels. Everything is merged before further processing.

This cluster is organized into four main steps to refine the divisions of the façade panels. First, we divide the panel into vertical sections. Next, we select specific vertical lines on one side of the panel. Then, in the third step, we sort these lines by distance for precise positioning. Finally, we add horizontal divisions to complete the setup. Feel free to dive into the cluster and explore each step in detail—you’ll get a deeper understanding of how each division builds on the next to create the final pattern.

Panel Unique Grouping
Now that we have the panels, it should be possible to group them, so that we have the same panels (dimensions and area) in their own respective groups. This can be done in many ways, let’s explore the one we took in this example.
First, we calculate the area of panels using the “area” component. Then, after reconstructing the surfaces (panels), their dimensions and area, are added together. We will refer to that sum as the panel’s “feature”. This assures assigning one number (feature) to each unique panel type.
Later, using “Create Set” and “Member Index” components, we can get information about occurrences of unique panel types, i.e. what are unique features and how many of those there are (Create Set >> Set), what is the group index for each panel (Create Set >> Map), and how many panels are in each unique group (Member Index >> Count). Those will be very useful later.

Façade Panelization Geometry 4/7
Calculation Design Fitness Valueslink copied
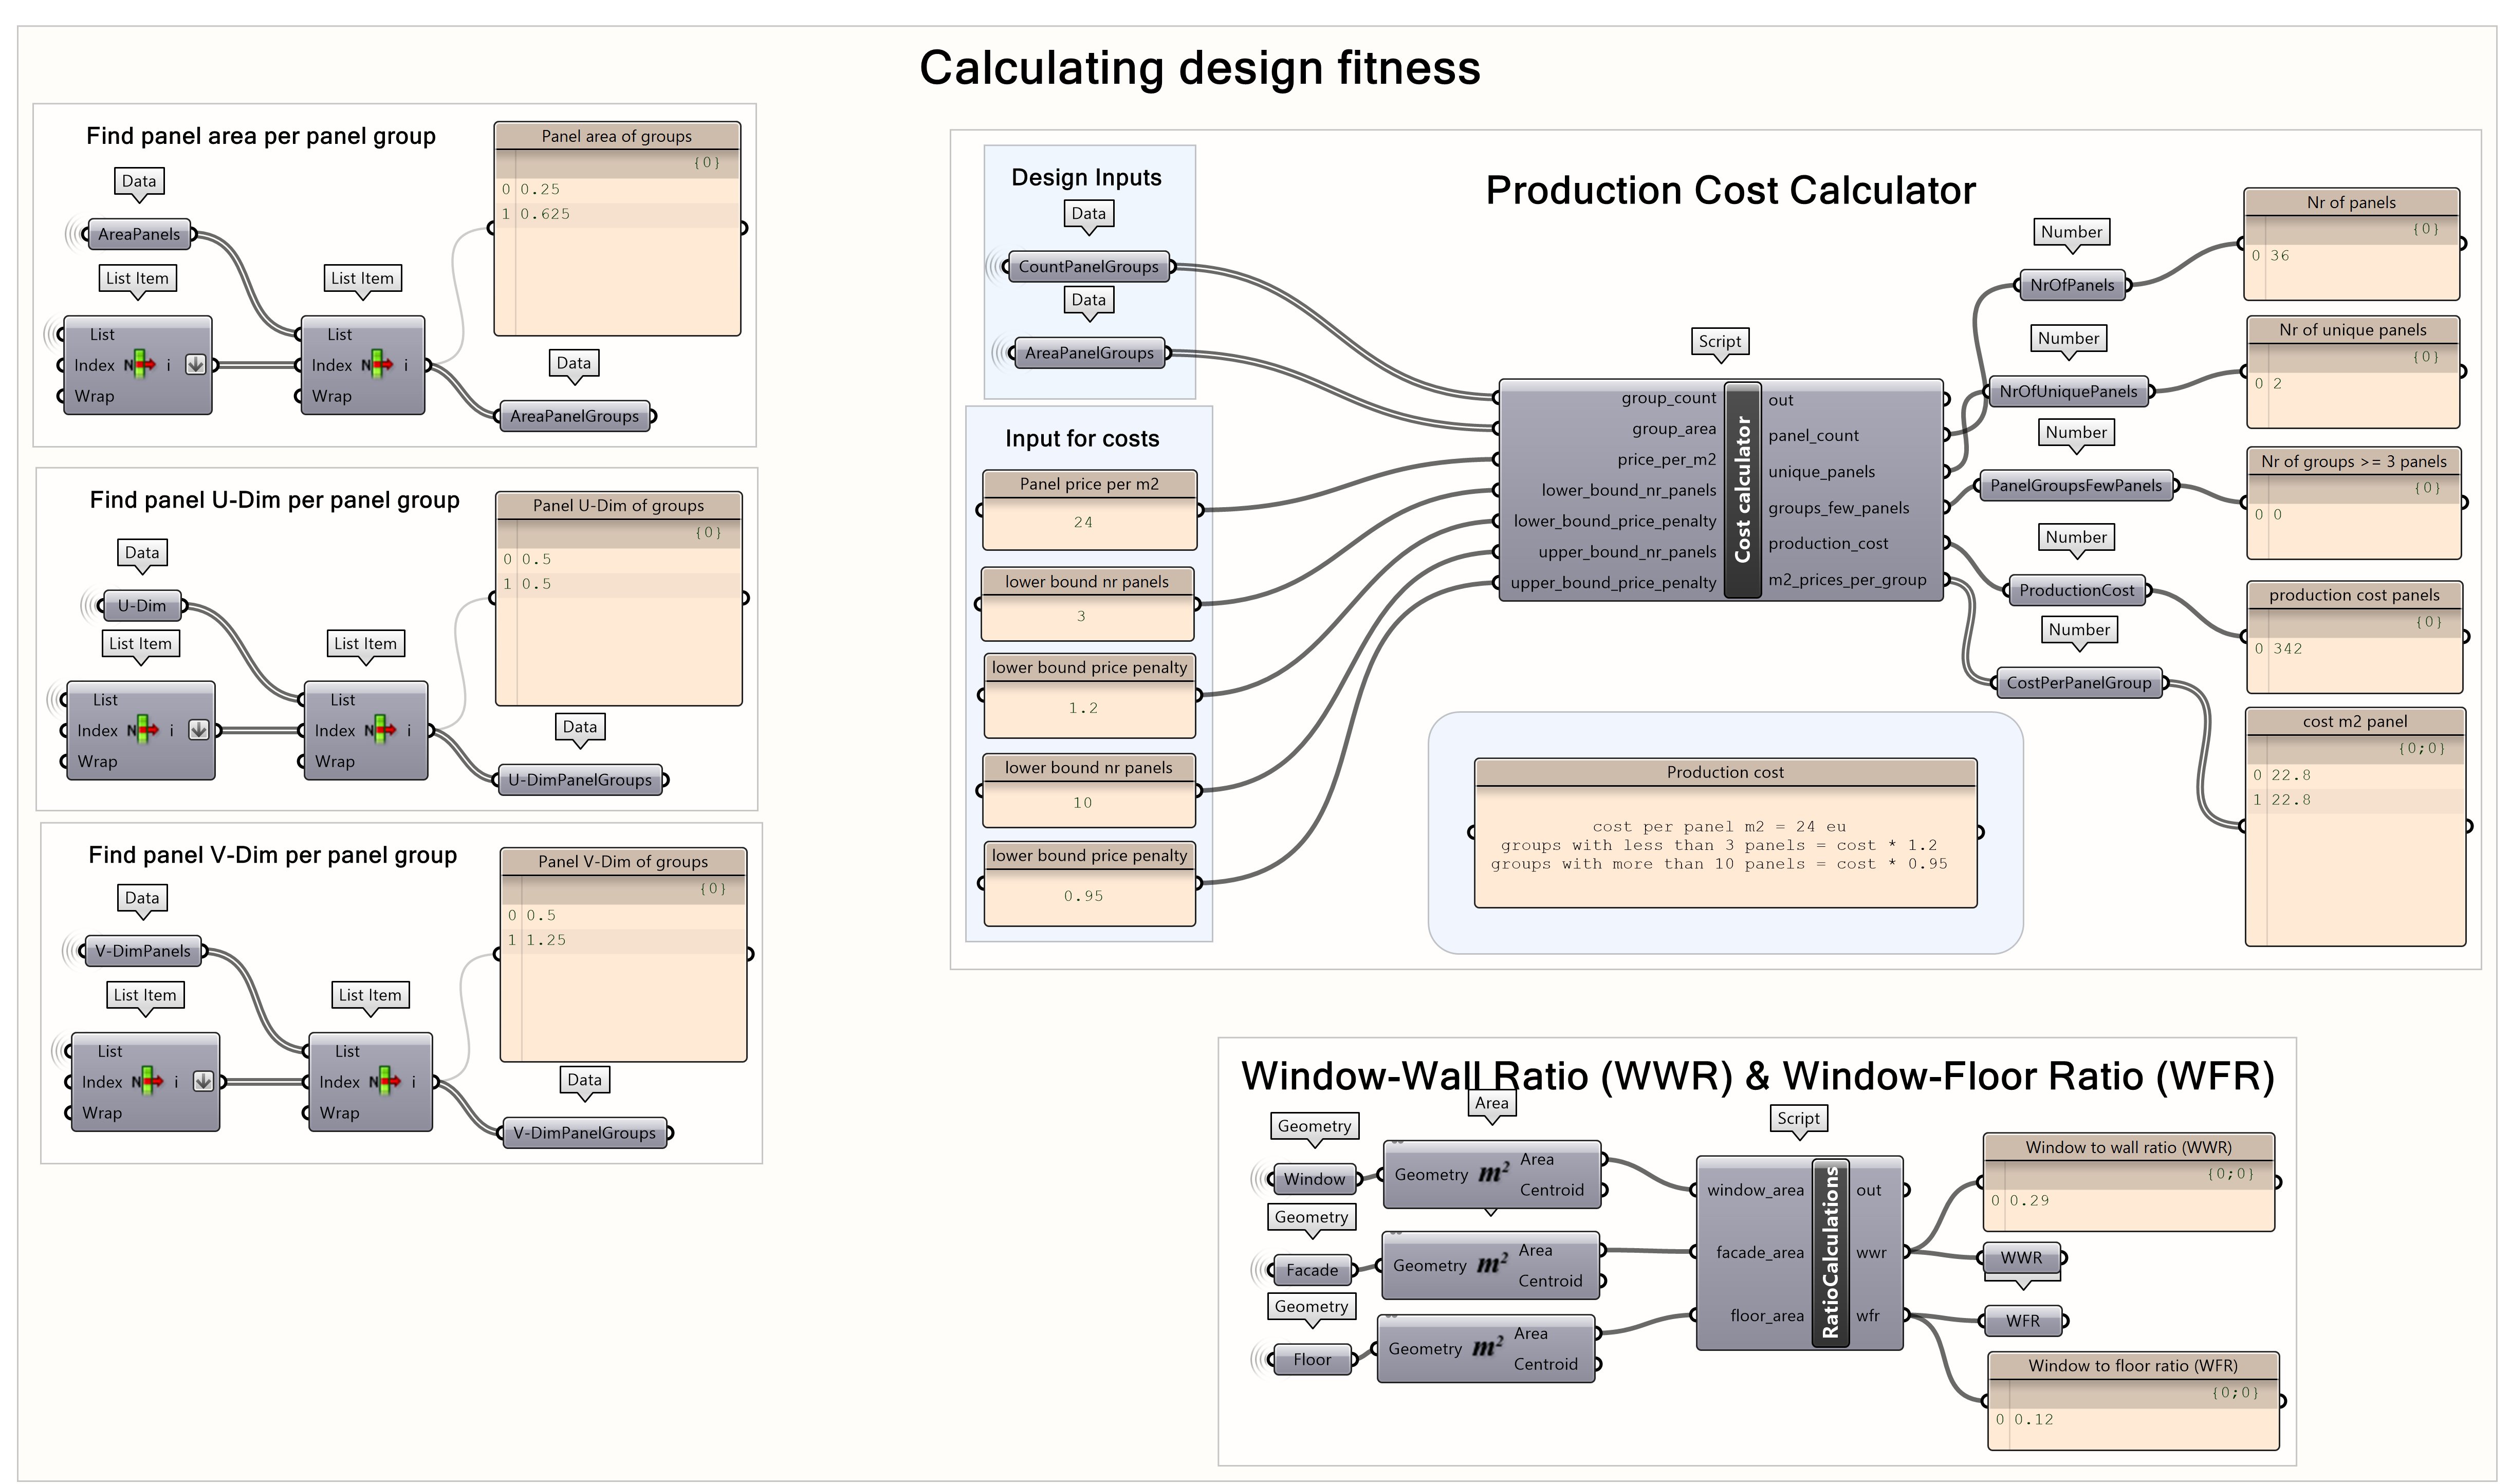
You might notice, at the end of the grasshopper definition there is a section with a cost calculator, and a section calculating the window-to-wall ratio. In the script we created a calculation section for possible objectives. In the next steps we will start selecting specific objectives for this example, but you could try and mix up objectives to see how the outcome changes. This section quickly describes how the possible objectives are calculated. (Of course there are many other possible objectives to add)
Final Panel Area per panel group
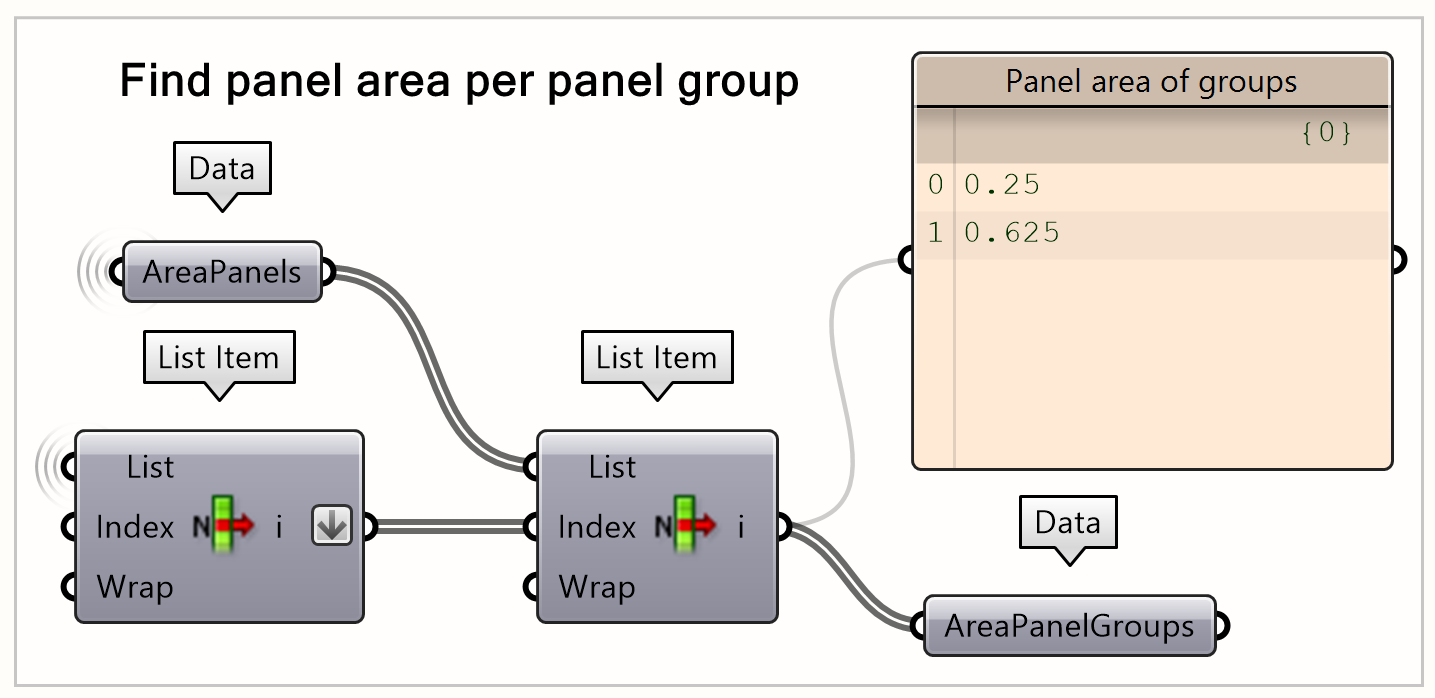
Calculating the area is one of the first steps needed for any analysis, so we’ll start by finding the area for each panel group. First, we’ll create a “List Item” component and connect the “Index Panel Groups” output to its list input. Then, we’ll add a second “List Item” component and connect the area output from the grouping to the “Area Panels Data” component and connect that to the “List” input. Next, flatten and connect the “I” output from the first List Item to the index input of the second List Item component. To view the areas, simply connect a “Panel” to the “I” output.
Final Panel U-Dim per panel group
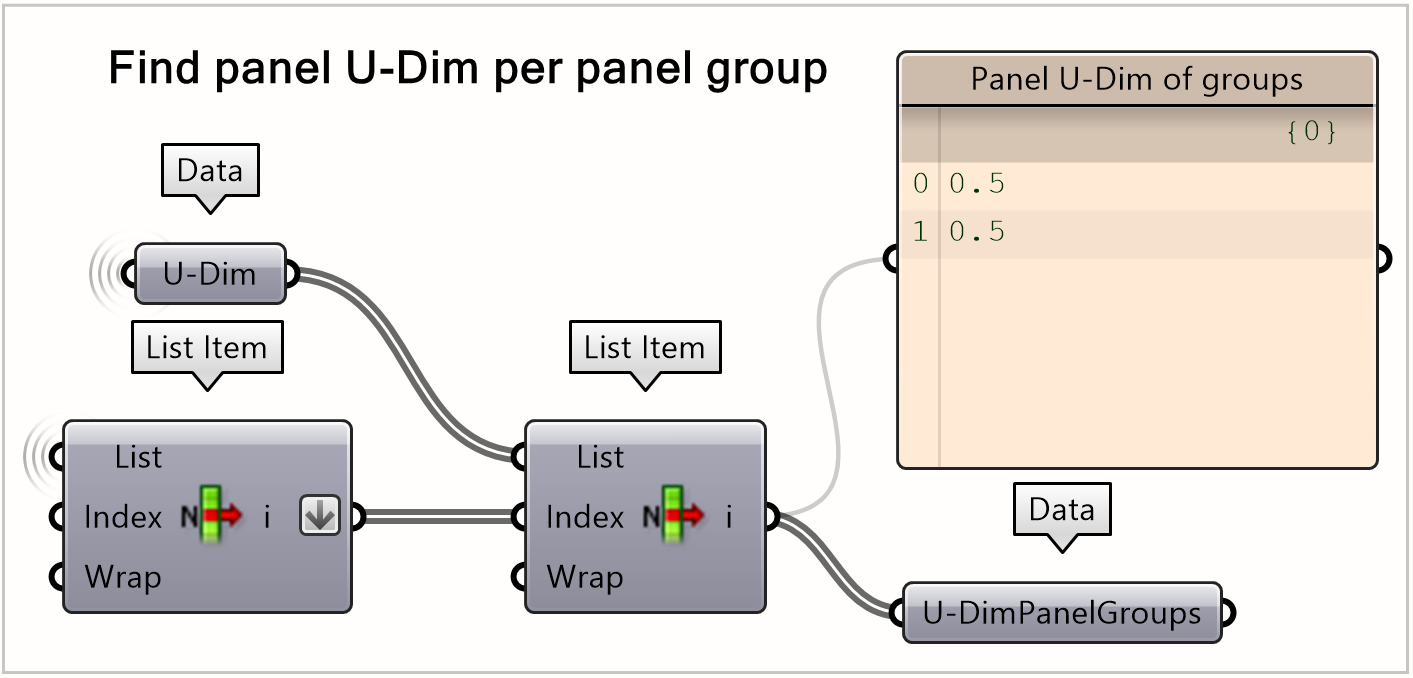
Another important calculation for our objectives is finding the U dimension of the panels. We’ve already calculated this during the grouping step. To retrieve the U dimension, we’ll connect to the “Dimension” component, just as we did with the area. We’ll follow similar steps by creating two “List Item” components: the first List Item will use “Index Panel Groups” as the “List” input, and the second “List Item” will use “U Dimension” as its “List” input. Then, connect the flattened “I” output from the first “List Item” to the “index” input of the second “List Item” component.
Final Panel V-Dim per panel group
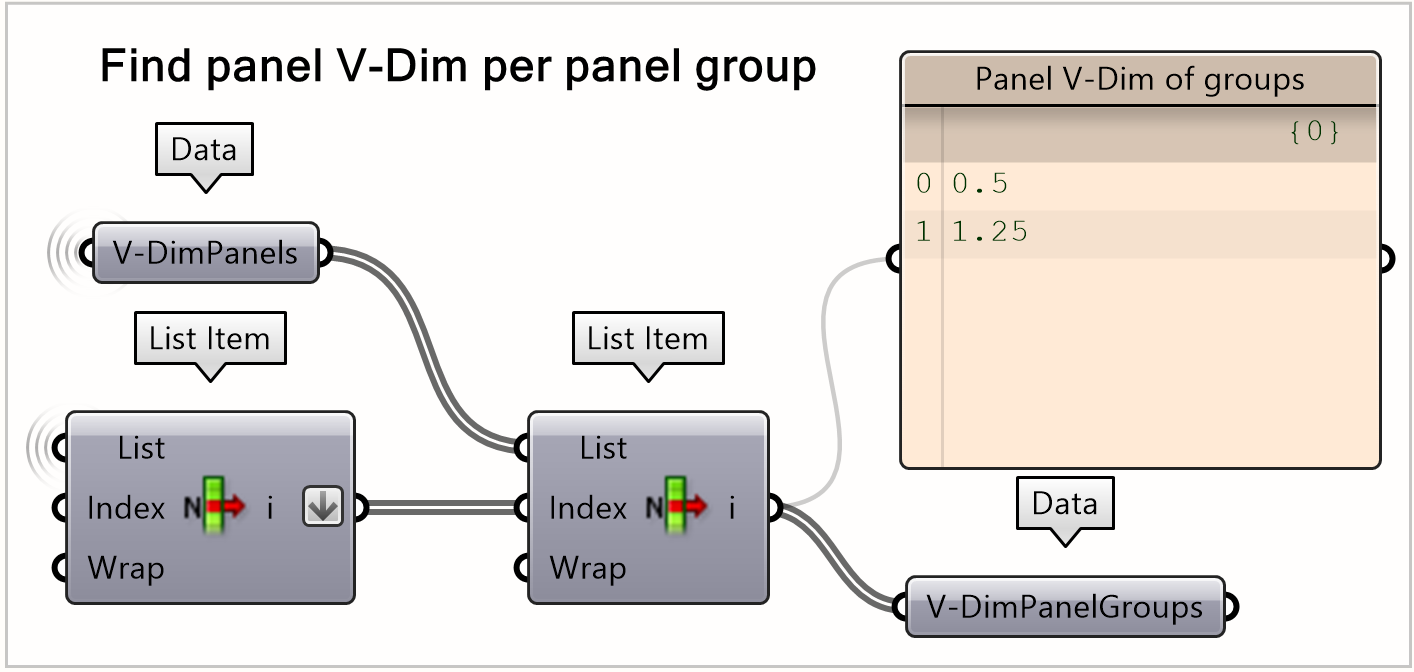
Now let’s calculate the V dimension for the panels, following a similar approach. Since we already obtained the V dimension in the grouping step, we’ll access it using the Dimension component. Begin by adding two “List Item” components: the first one will take the Index Panel Groups as its list input, while the second one will connect to the V Dimension as its list. Then, connect the flattened “I” output from the first List Item to the index input of the second List Item. This setup will retrieve the specific V dimension values for each panel group.
Window-Wall Ratio
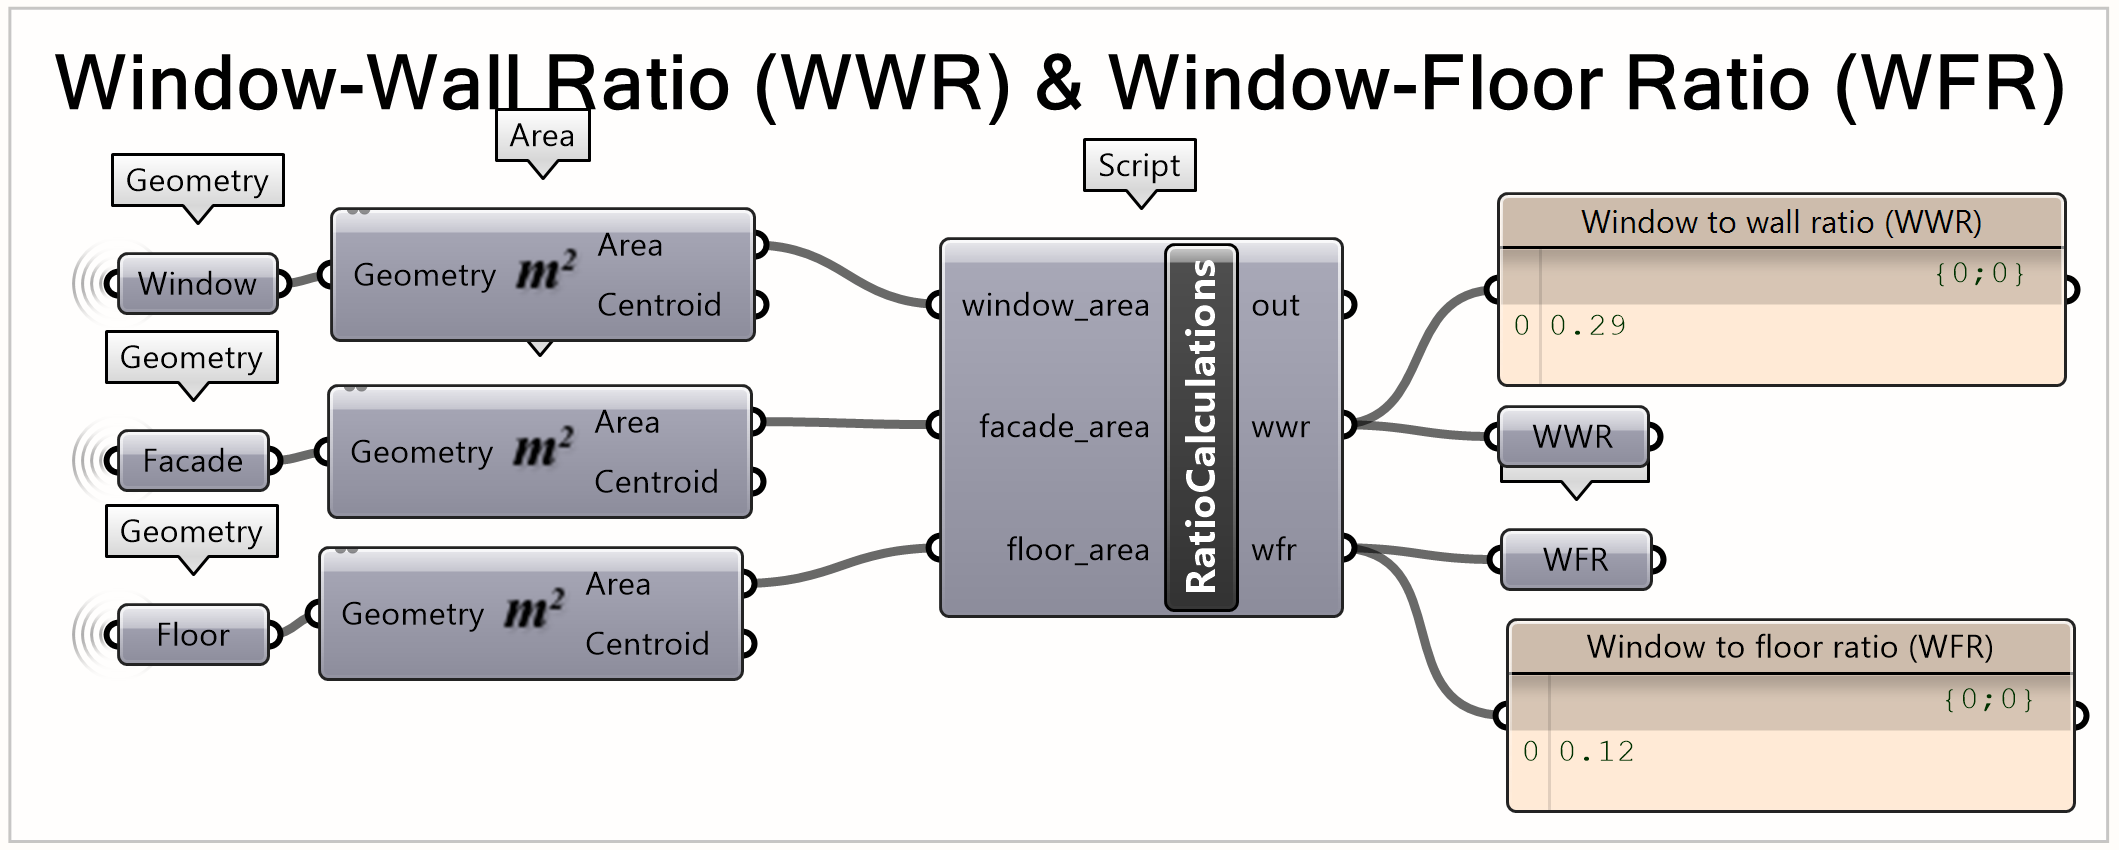
At this point, we can already calculate the Window to Wall ratio, which will be later useful for any optimisations coming in next tutorials.
It can be done simply by getting the façade and window areas and dividing the window area by façade area.
Cost Calculator
The last step of the grasshopper definition is to prepare calculated values to be used further in optimisation exercises (upcoming tutorials from this series).
Those calculations are being done by “Cost calculator” component custom written in Python. The rules are simple – we assume some price for one square meter of panels, assigning penalty multiplier (1.20) for groups containing less than 3 panels, and beneficial multiplier (0.95) for groups with more than 10 panels.
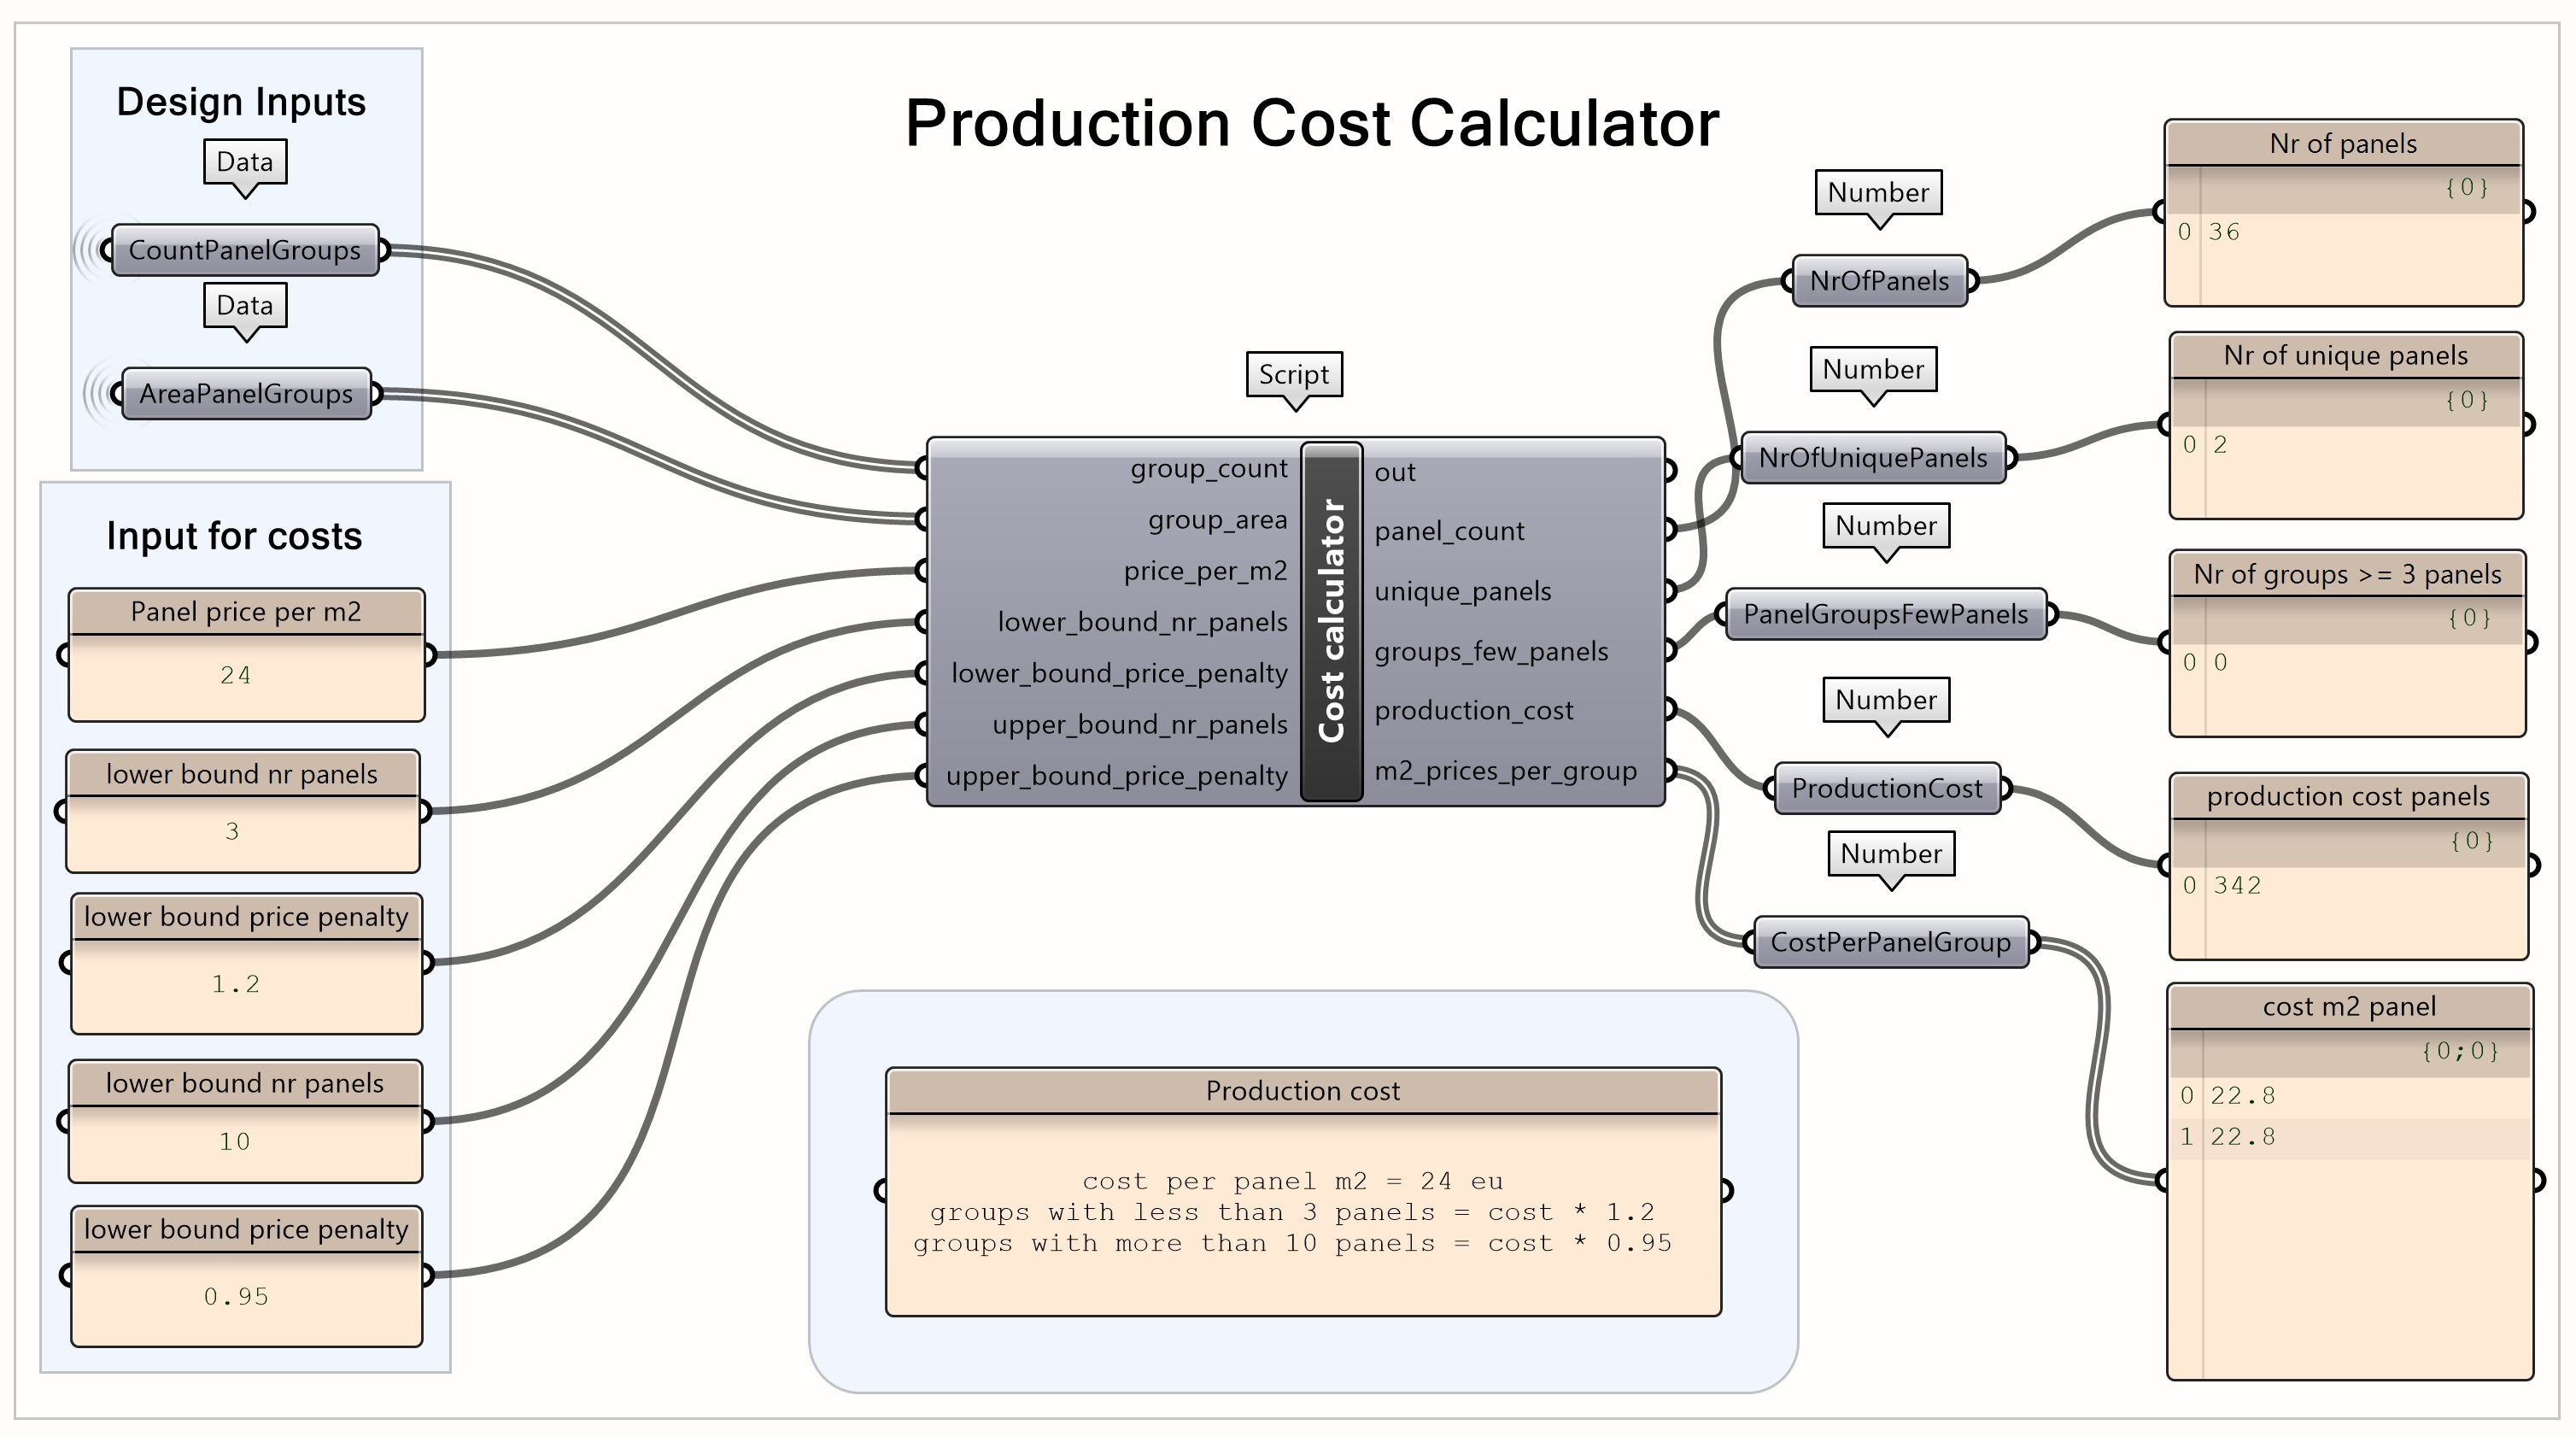
It takes as inputs: panel count per group, panel area per group, and other settings specific to group count penalty or benefit. The “panel area per group can be obtained by taking the original index of the first panel in each group, and with that index taking the corresponding panel area values.
Cost Calculator Python script
# Assuming group_count and group_area are lists of counts and areas for each group respectively
unique_panels = len(group_count)
panel_count = sum(group_count)

total_production_cost = 0
m2_prices_per_group = []
groups_few_panels = 0

for group_nr in range(unique_panels):
    group_count_current = group_count[group_nr]
    group_area_current = group_area[group_nr]

    if group_count_current <= lower_bound_nr_panels:
        m2_price = round(price_per_m2 * lower_bound_price_penalty, 2)
        groups_few_panels += 1
    elif group_count_current >= upper_bound_nr_panels:
        m2_price = round(price_per_m2 * upper_bound_price_penalty, 2)
    else:
        m2_price = price_per_m2

    group_price = round(m2_price * group_area_current * group_count_current, 2)
    total_production_cost += group_price
    m2_prices_per_group.append(m2_price)

production_cost = round(total_production_cost,2)

print ("Total production cost:", production_cost)
print ("m2 price per panel group:", m2_prices_per_group)
print ("Number of groups with 3 or fewer panels:", groups_few_panels)
After completing these steps, we can output useful information, like overall cost of panels, cost of individual groups, etc. The cost calculator component is a Python code that was developed, if you want more advanced details on the cost calculator and how these calculations work, you are more than welcome to double-click on the centre of the component to view the python script.
Façade Panelization Geometry 5/7
Visualizationlink copied
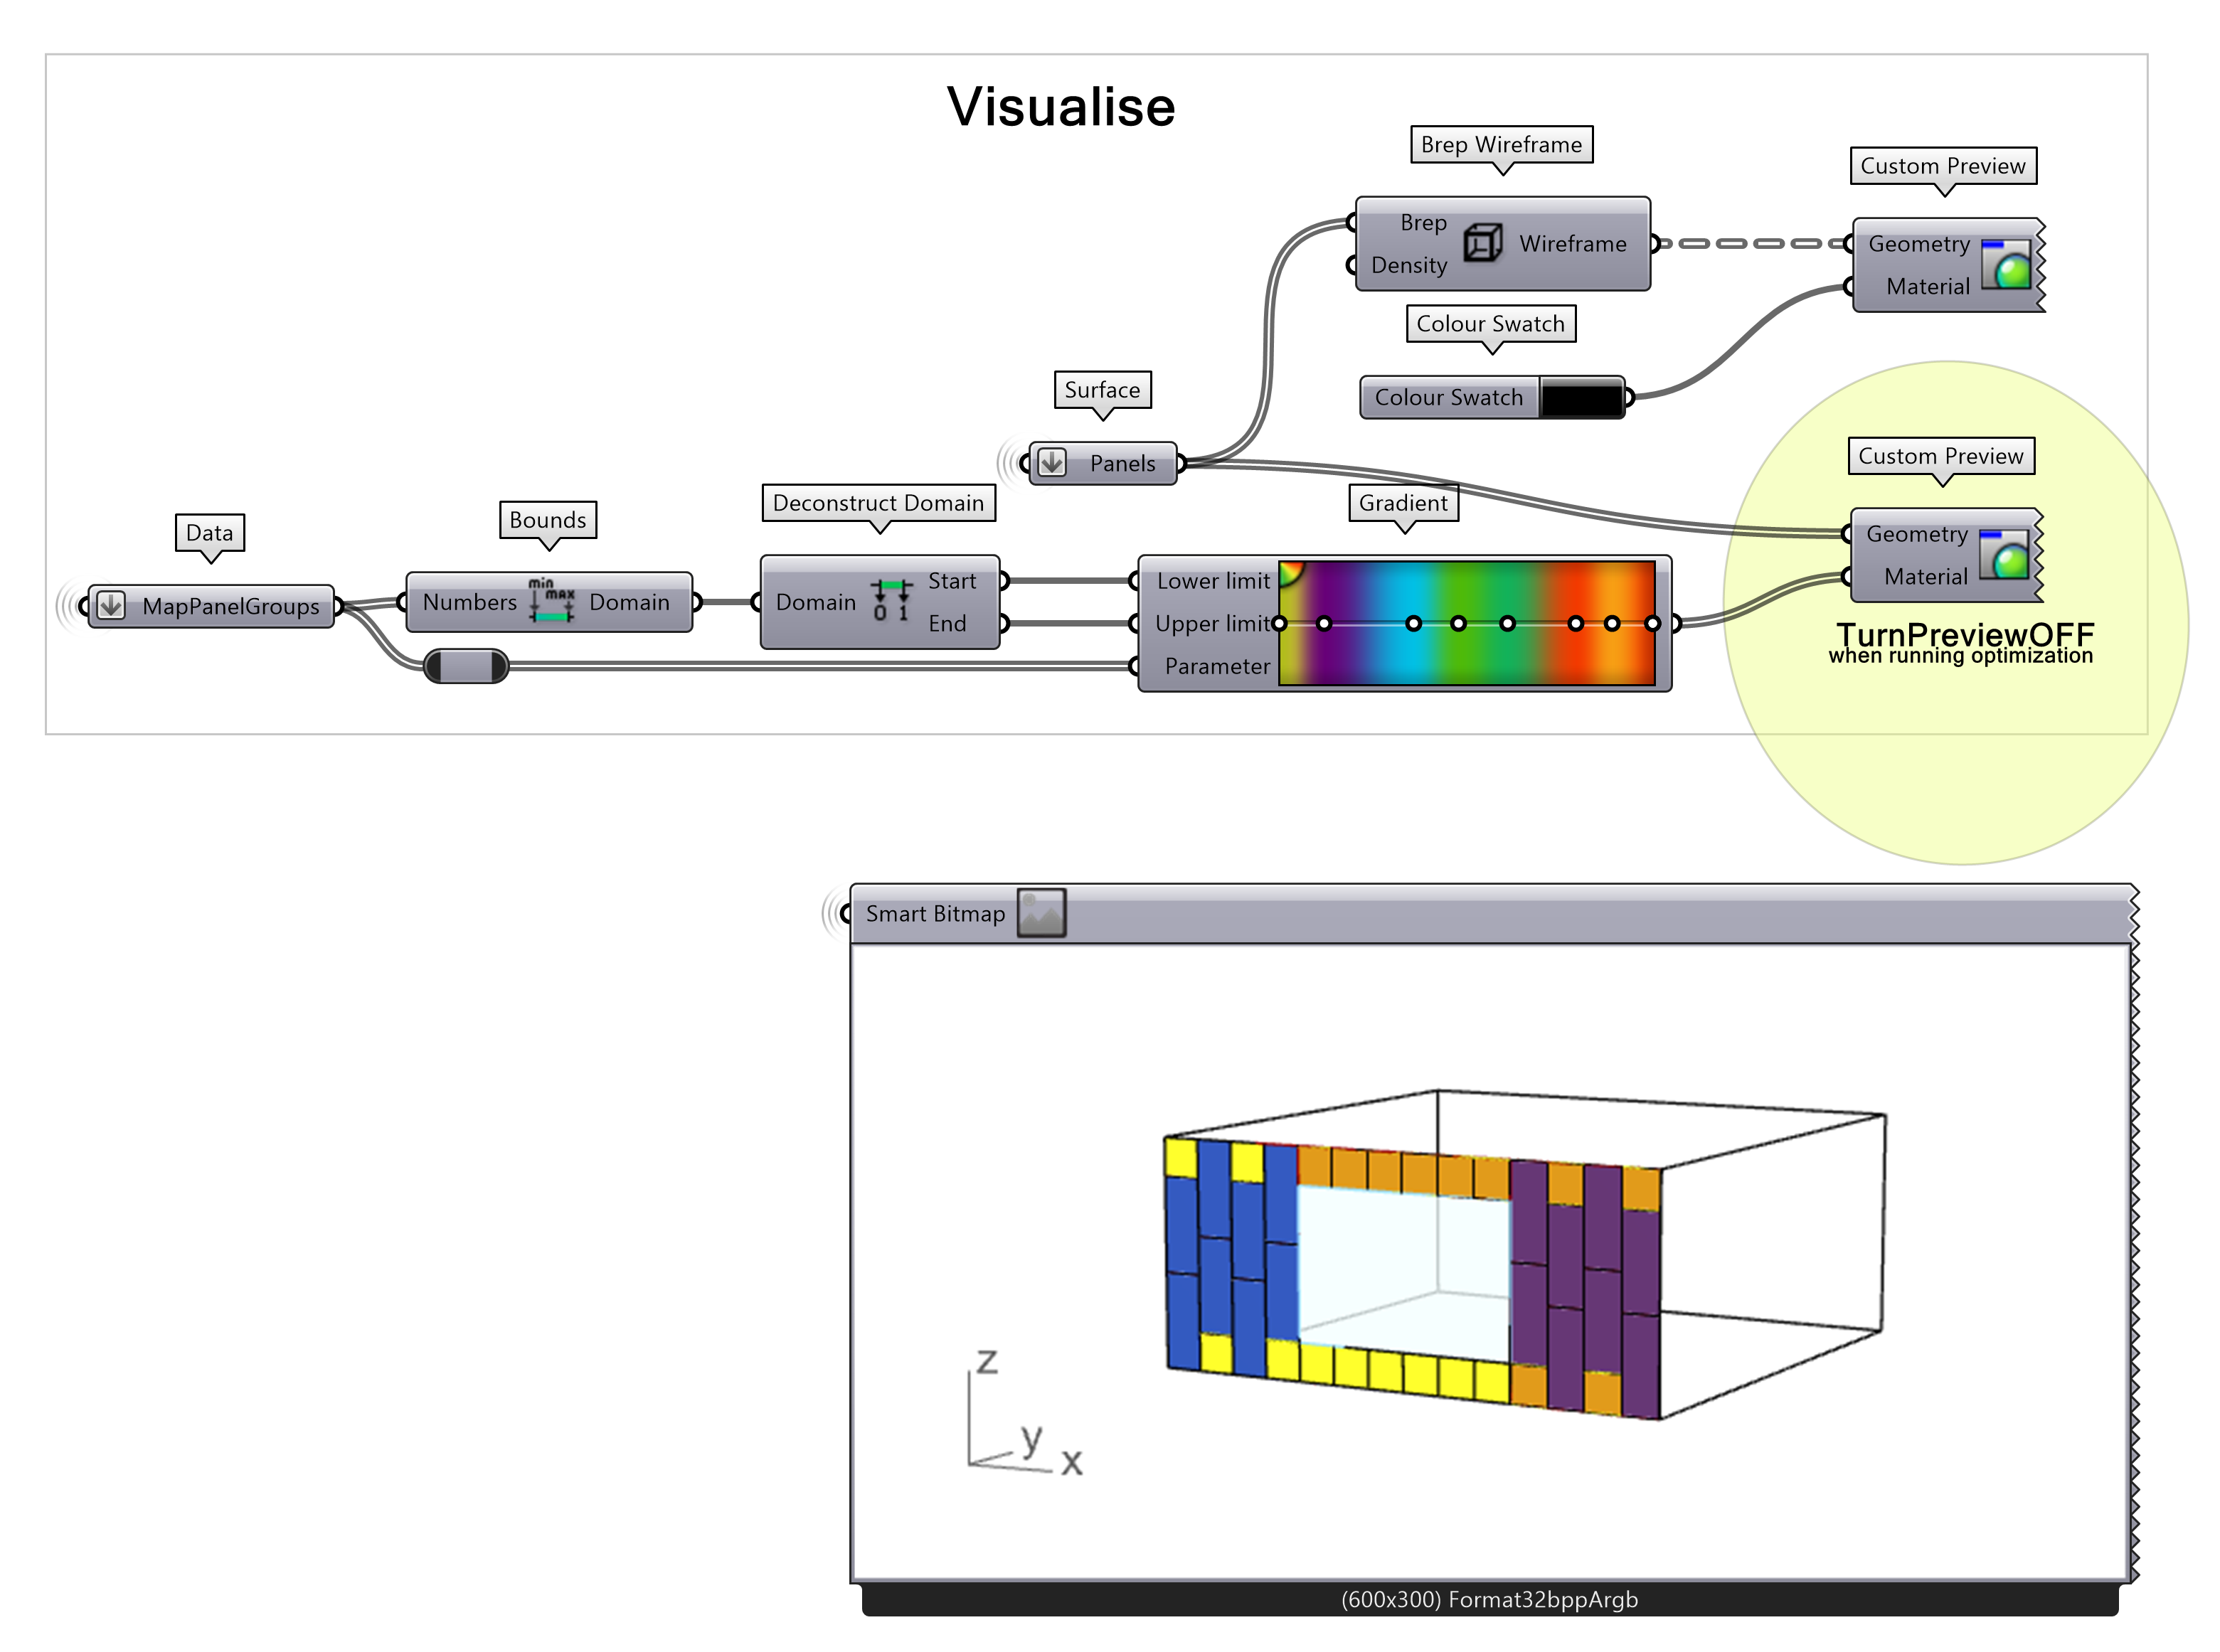
Alright, but how does it look like? Let’s visualize the façade with panels, colouring them by their unique group type.
For this we need the panels (surfaces), and their respective feature values (area + dimension sum). Further, by using a “Gradient” and “Custom Preview” components we can see the coloured panels in the Rhino viewport. Remember to turn off the preview of all other components. You can now see that panel falling into the same group are also coloured the same.
Façade Panelization Geometry 6/7
Conclusionlink copied
Congratulations on completing the first step toward optimization! You’ve successfully created a basic room with an opening, and you’ve learned how to design, customize, and visualize façade panels. Along the way, you grouped panels and obtained precise measurements, which you used to run essential calculations like window-to-wall ratio, panel areas, and cost. These skills are key for moving forward with optimization, as you now understand the foundational geometry of façade panels and have identified features we’ll optimize in upcoming tutorials. Great work! You’re also one step closer to mastering the art of panel design!

Façade Panelization Geometry 7/7
Useful Linkslink copied
Follow up tutorials
Write your feedback.
Write your feedback on "Façade Panelization Geometry"".
If you're providing a specific feedback to a part of the chapter, mention which part (text, image, or video) that you have specific feedback for."Thank your for your feedback.
Your feedback has been submitted successfully and is now awaiting review. We appreciate your input and will ensure it aligns with our guidelines before it’s published.
