Spacechase Sculpture Garden Graph
-
Intro
-
Design
-
Building the Graph
-
Analysing the Graph
-
Changing the Graph
-
Justified Tree Graph
-
Layout the spaces/functions in the location
-
Conclusion
Information
| Primary software used | Grasshopper |
| Course | Spacechase Sculpture Garden Graph |
| Primary subject | Parametric Modeling |
| Secondary subject | General |
| Level | Intermediate |
| Last updated | November 27, 2024 |
| Keywords |
Responsible
| Teacher | |
| Faculty |
Spacechase Sculpture Garden Graph 0/7
Spacechase Sculpture Garden Graph
In this tutorial you will learn how to setup and analyse a spatial/functional Graph in order to enhance the insight in the spatial and functional configuration in the early stages of design.

In this tutorial we will explore the capabilities of the Spacechase plugin which is based on the theory of Space Syntax. Methods using space syntax analyze spatial relationships within Architecture and allow for an analytical approach of spatial organization and exploration of spatial configurations.
Spacechase Sculpture Garden Graph 1/7
Designlink copied
For this tutorial we going to explore the spatial/functional configuration and organization of a sculpture garden. With a simple brief: Spaces/functions = Entrance Museum, Entrance Garden, Terrace, Information point, 7+ sculptures.
The sculpture garden is 40m by 20m and has a hight difference between the Garden entrance and the Museum entrance of 4,8m. Where the Museum entrance sits at -4,8m. The Terrace is at level -4,80 m.
Spacechase Sculpture Garden Graph 2/7
Building the Graphlink copied
When creating a new file to create the Graph for this tutorial make sure the units are set to centimeters.
Make sure when you start to build your first Graph you work in a file with a centimeter unit. This is important because the Plugin Spacechase uses this unit for its calculations. A mm scale might lead to inaccurate size of text for example.
Defining the functions:
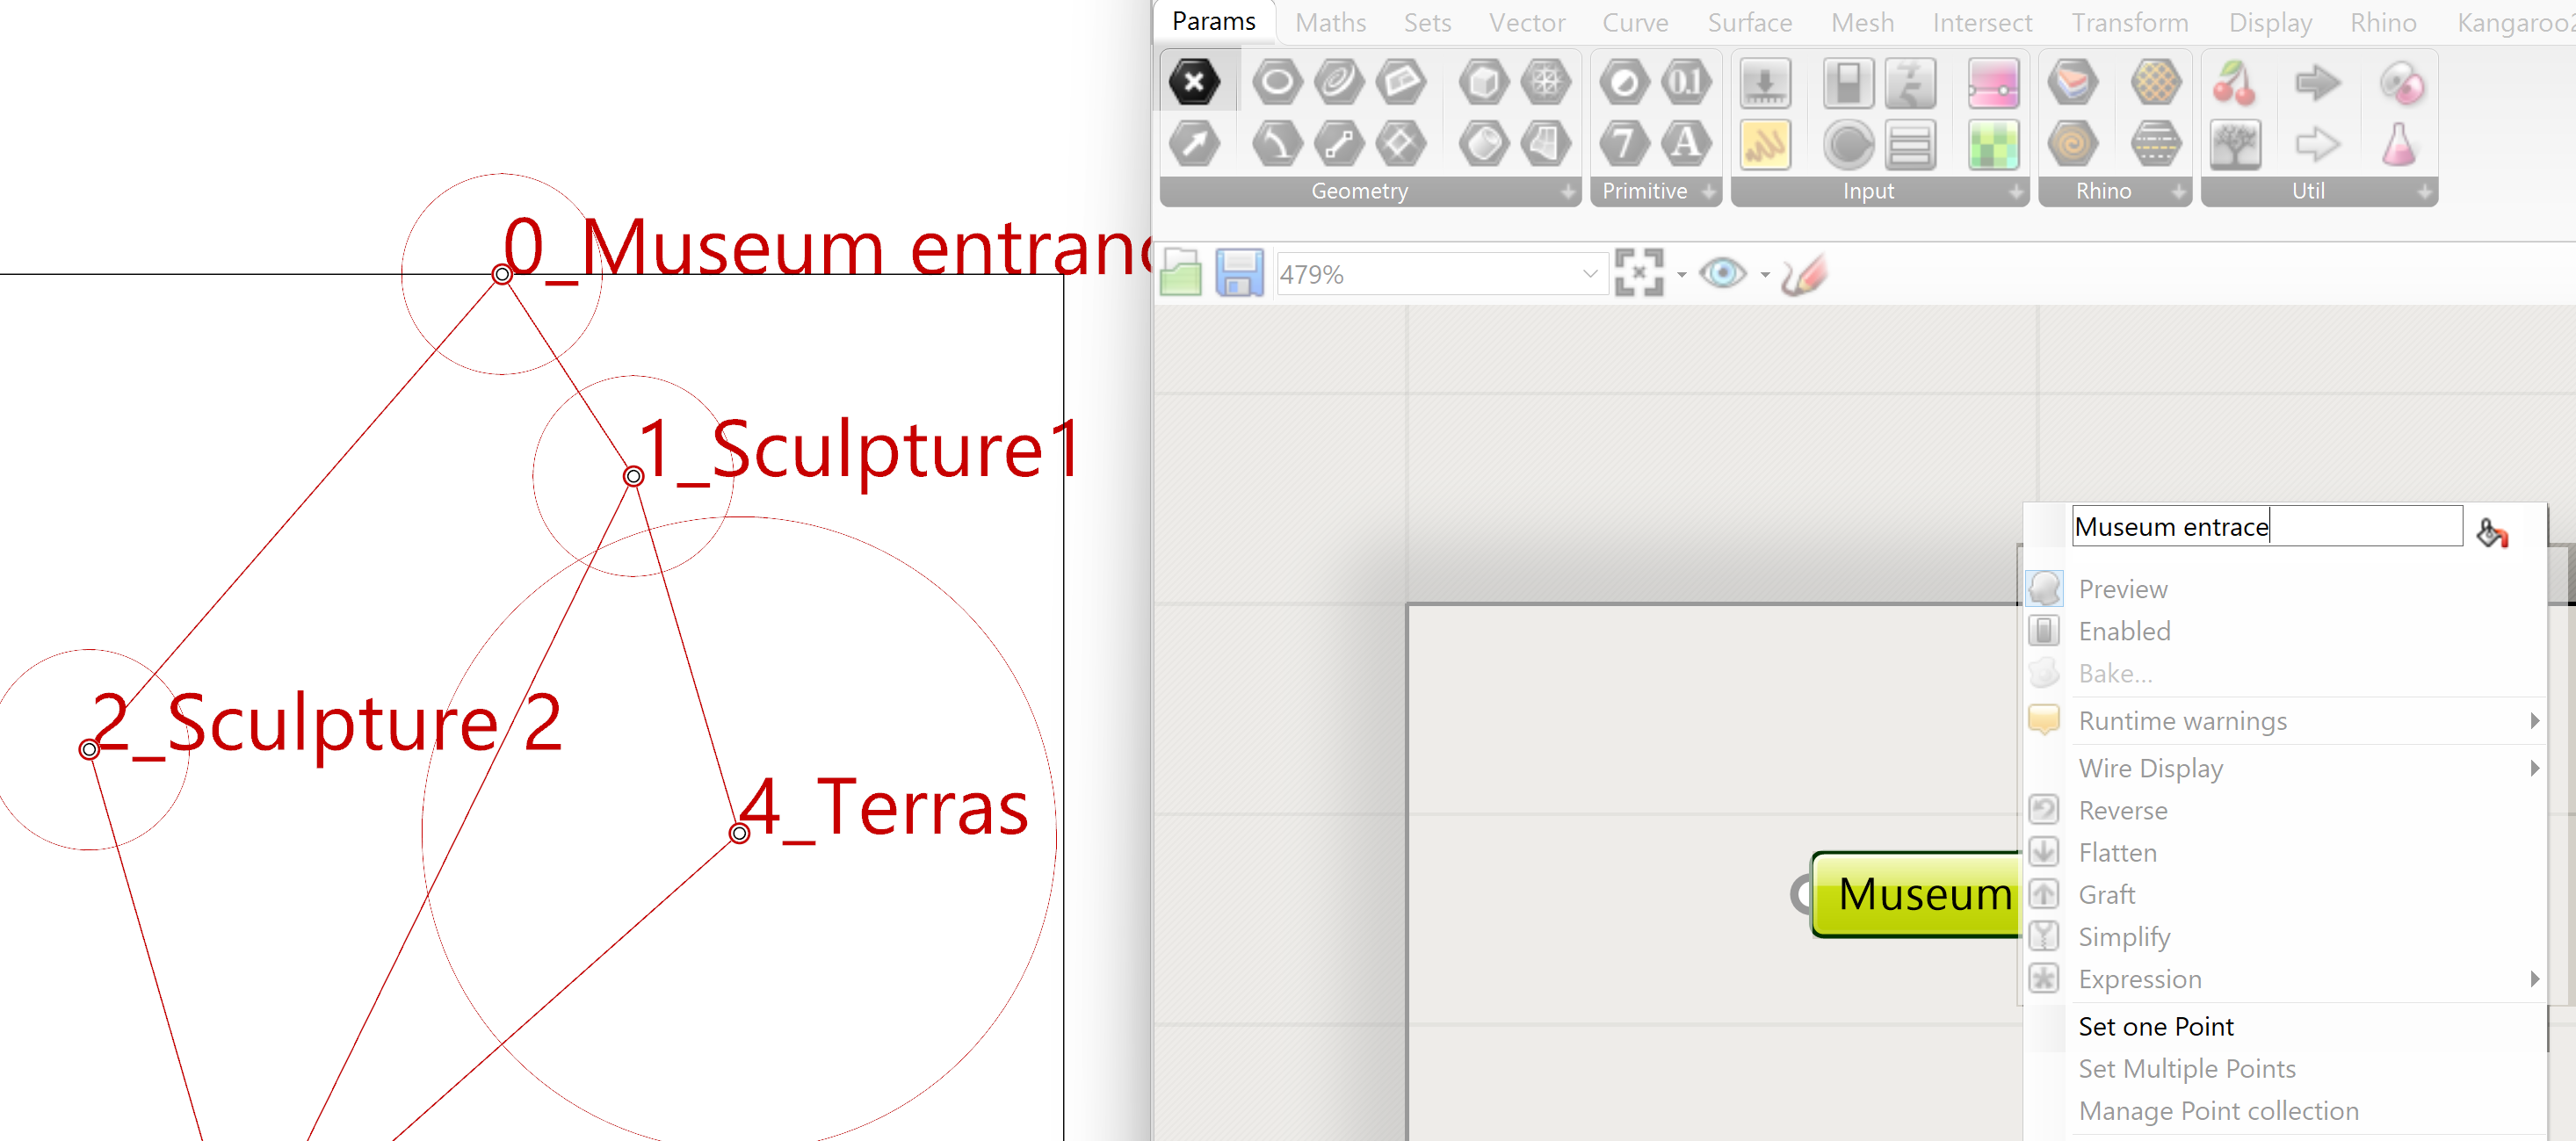
To make a Graph representing the spatial / functional relationships we need the spaces/functions defined. The spaces/functions are defined by points. These have to be created in Rhino not Grasshopper. Each point will in this case represent a function within the sculpture garden. To create the points use the toolbar and select the points icon. Create the amount of points ( functions) you need for your design. The location of the points are not relevant yet. It is about the connection between the points.
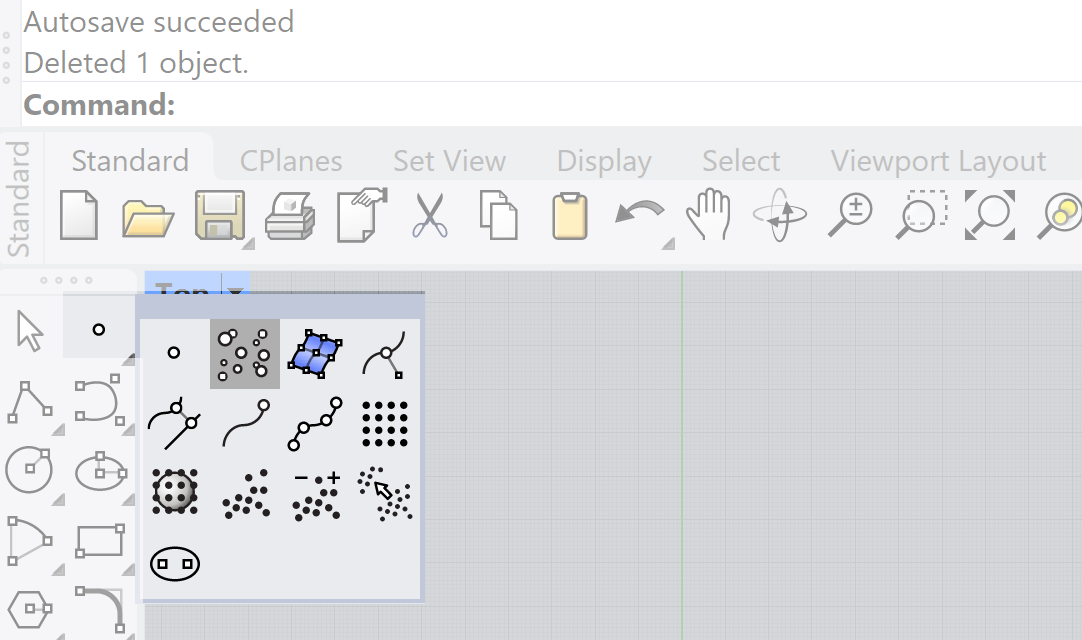

Name each point with its corresponding function like “garden entrance or sculpture” To name the point select the properties icon and add the name. To also have an indication of area used by the function you can add * value in m2 : Garden entrance* 25
Go to Grasshopper and open the Spacechase tab.
In the Node tab we have the option of Construct Point Node. This node allows us to define the points as input for analysis.
To make them visible use the Display tab and select Node Display. The points will be displayed with their names representing their function.
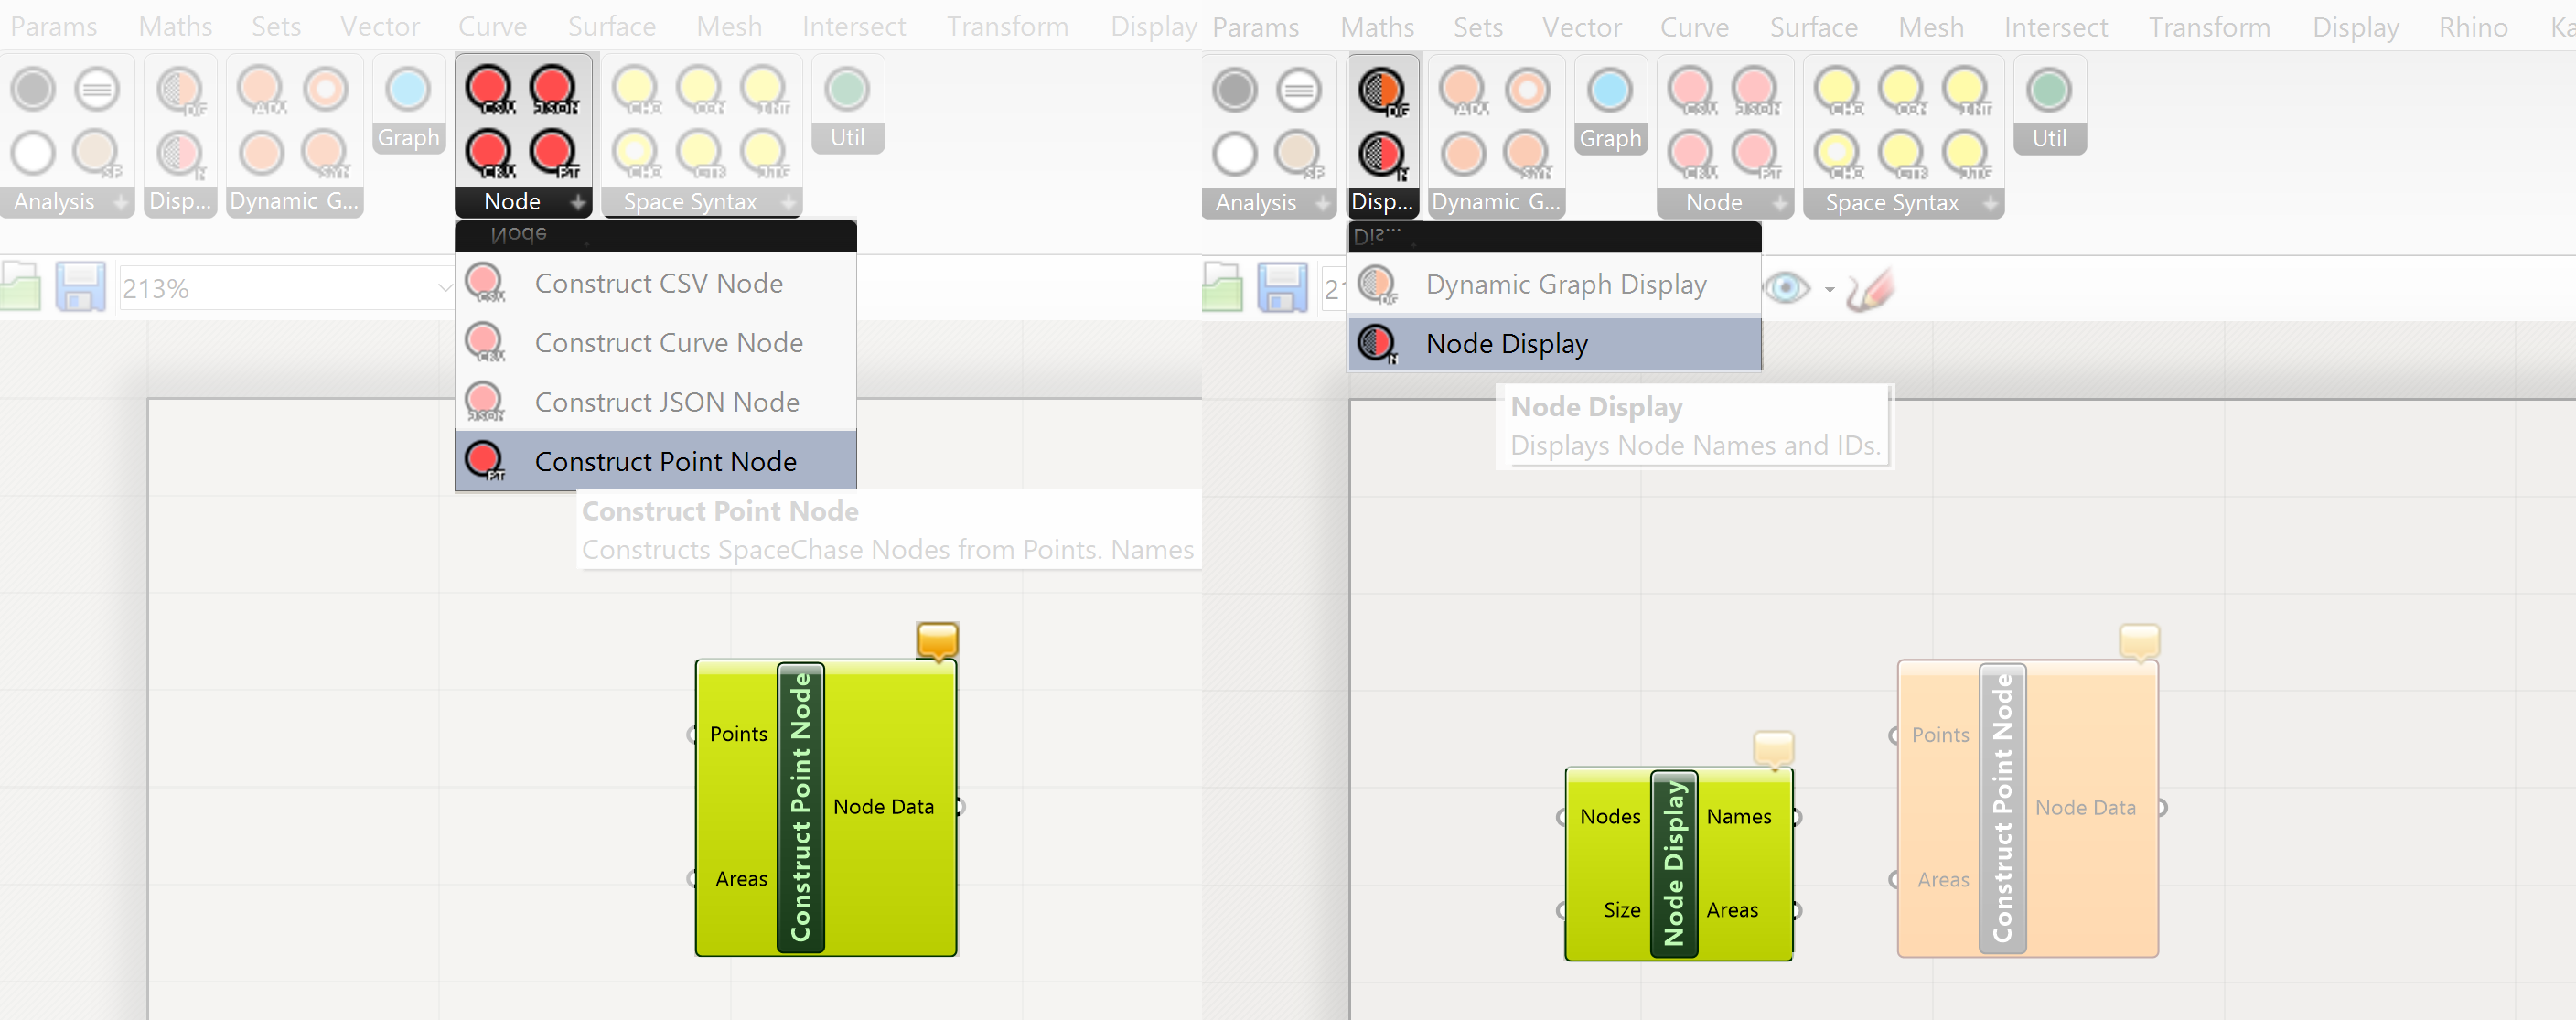
Now the basic network can be finished
The Construct Point Node component has two inputs. A points input, these are the points we have defined and named in Rhino and an area input. The last one we won’t use because we already have defined the area in the name of the points (Garden entrance* 25)
We connect the Rhino points to Grasshopper by using the Parameter tab and select the Point parameter
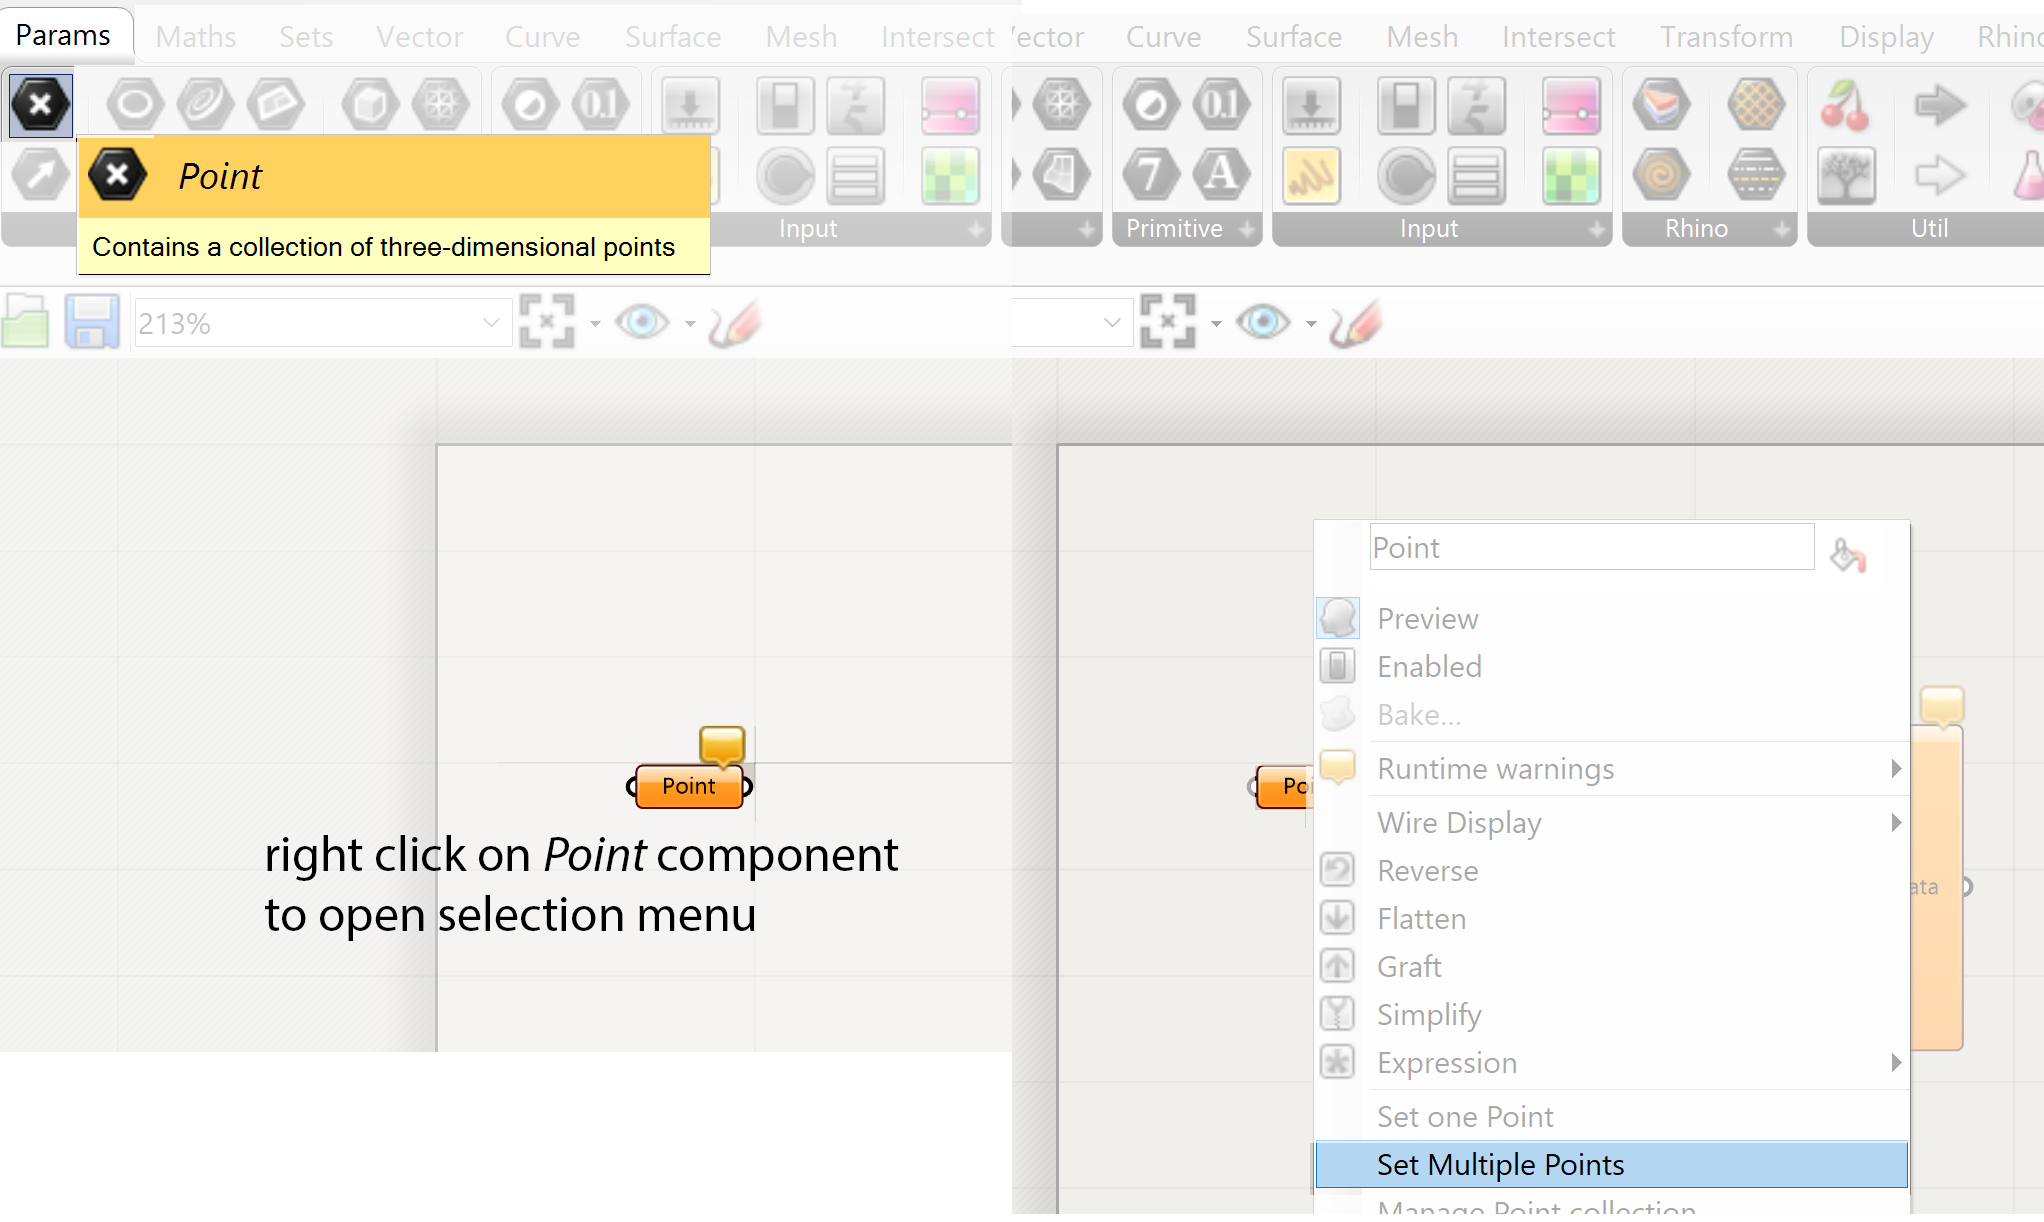
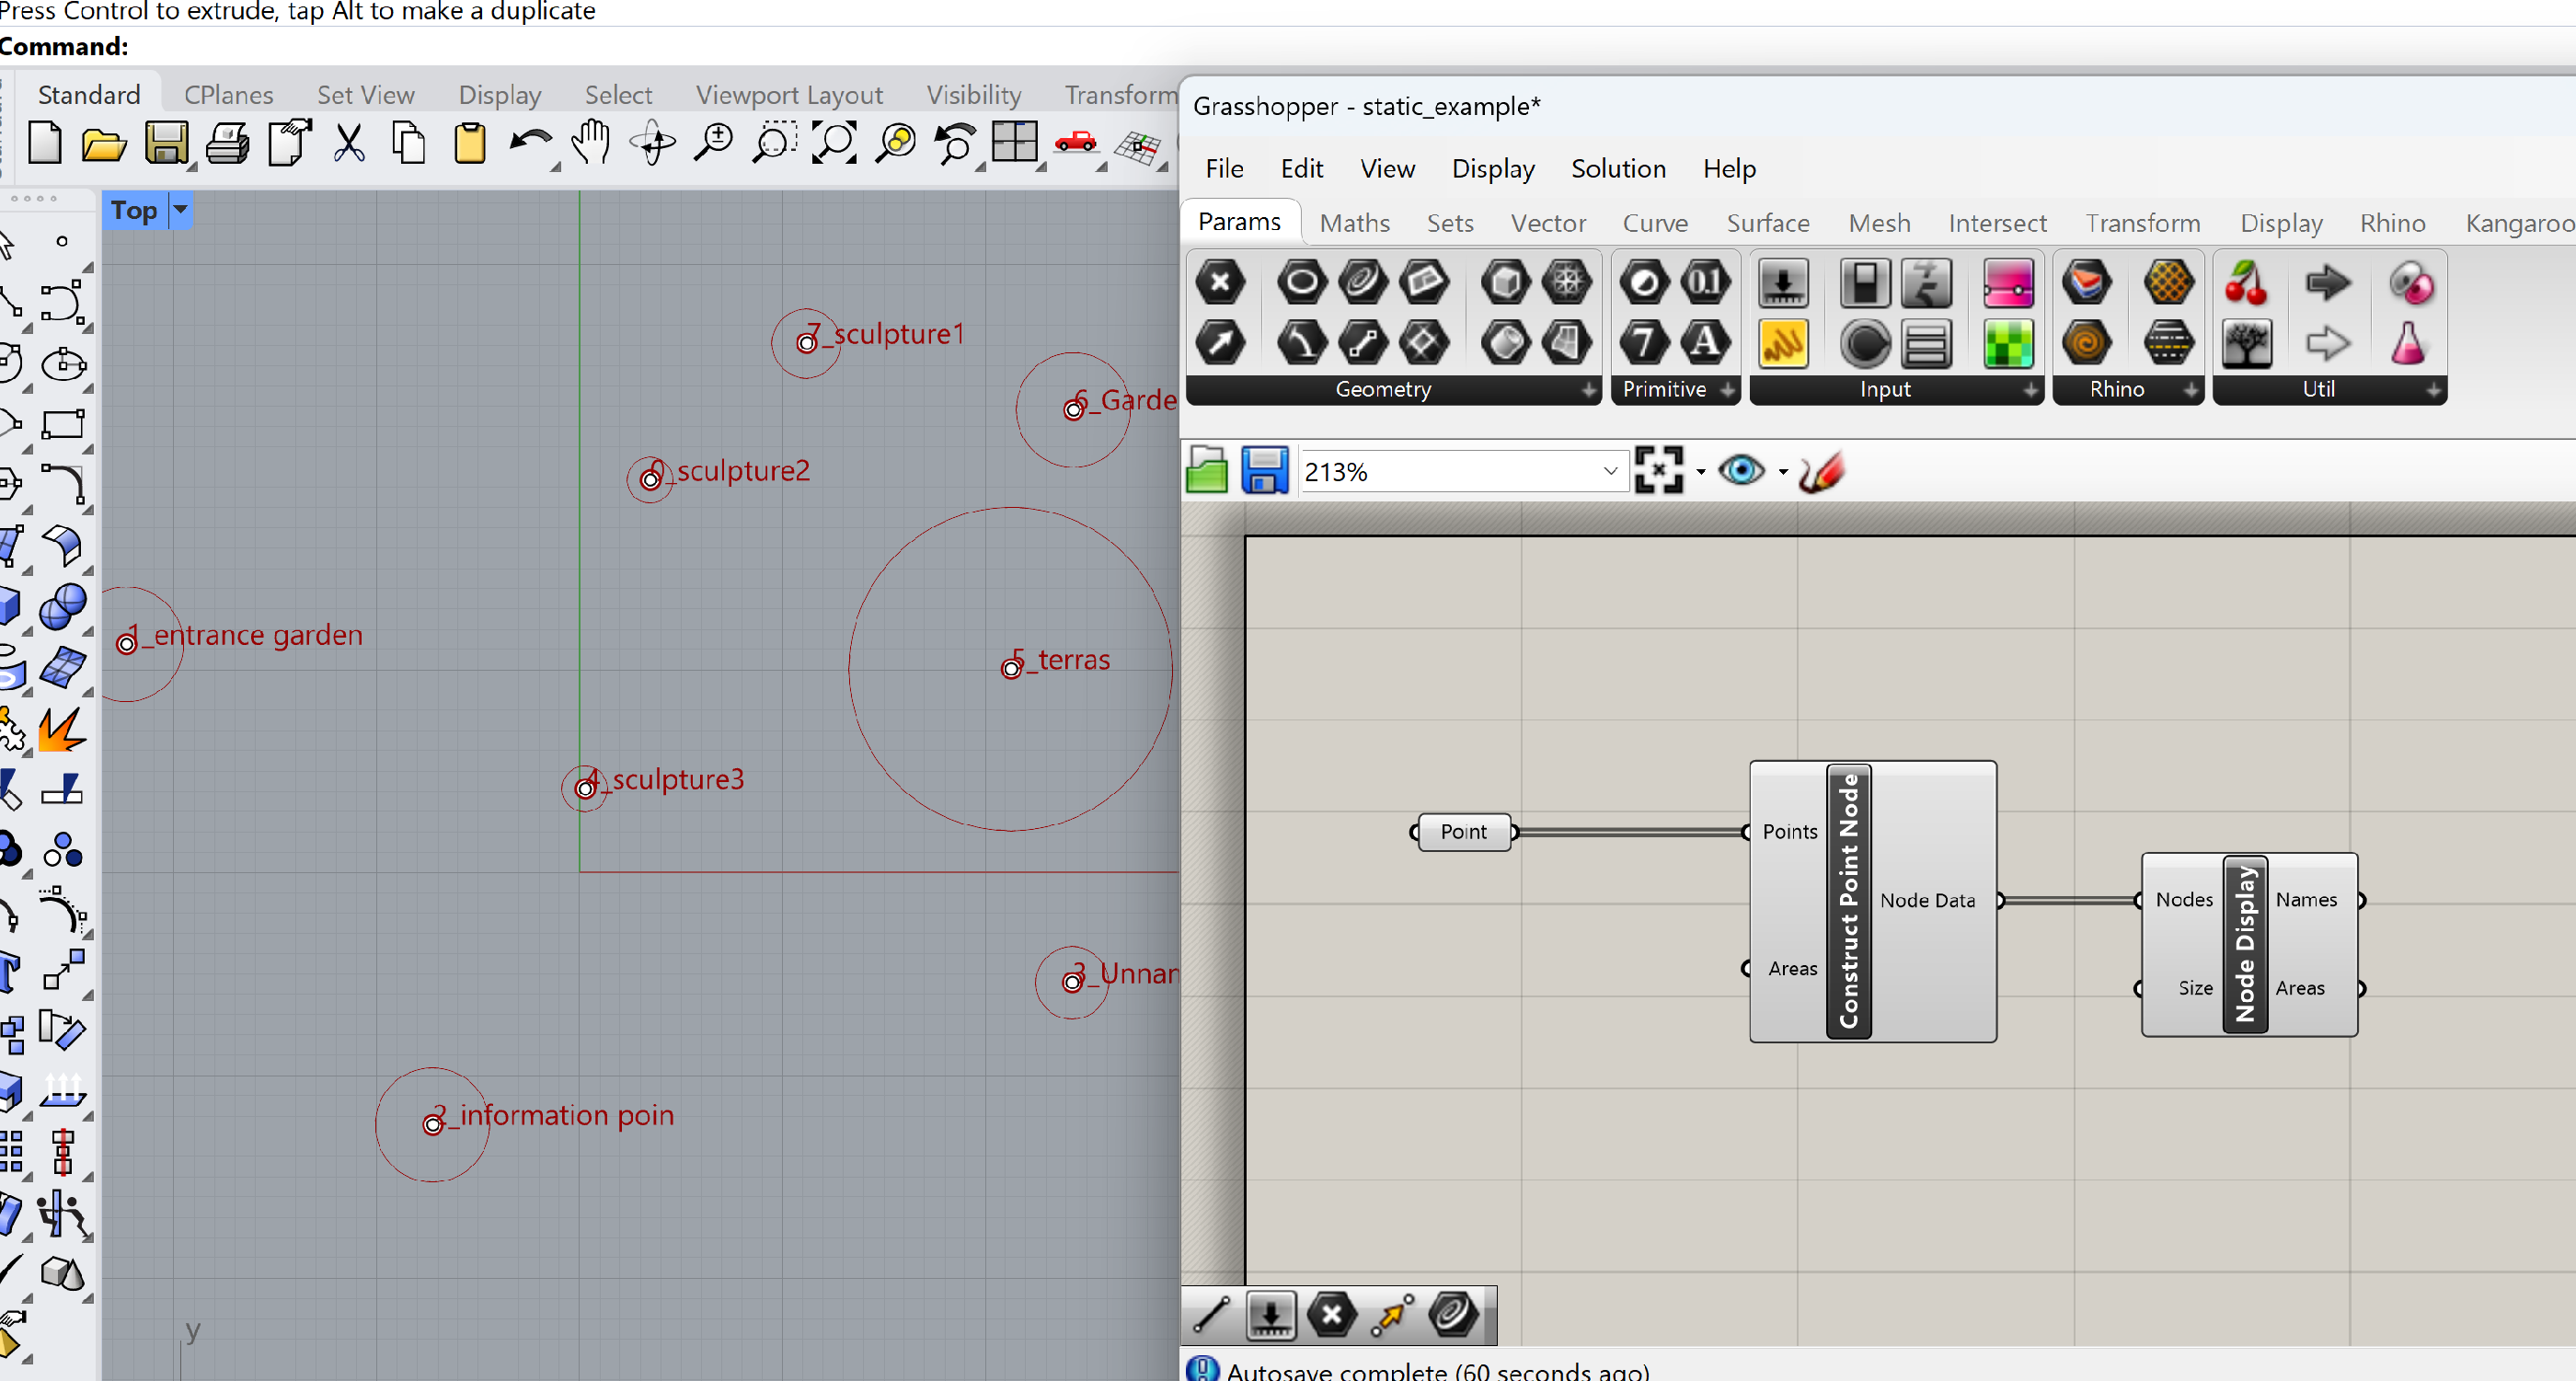
Select the points in Rhino and connect the Points parameter to the points input of the Construct Point Node component
To see the names of the points we have to connect the Construct Point Node to the Node Display component.
Creating the connections
As mentioned earlier the definition of the functional connection of spaces is an essential part of the early stages of the architectural design process. It will dictate the way how people will move through the design and how the different spaces are related to each other.
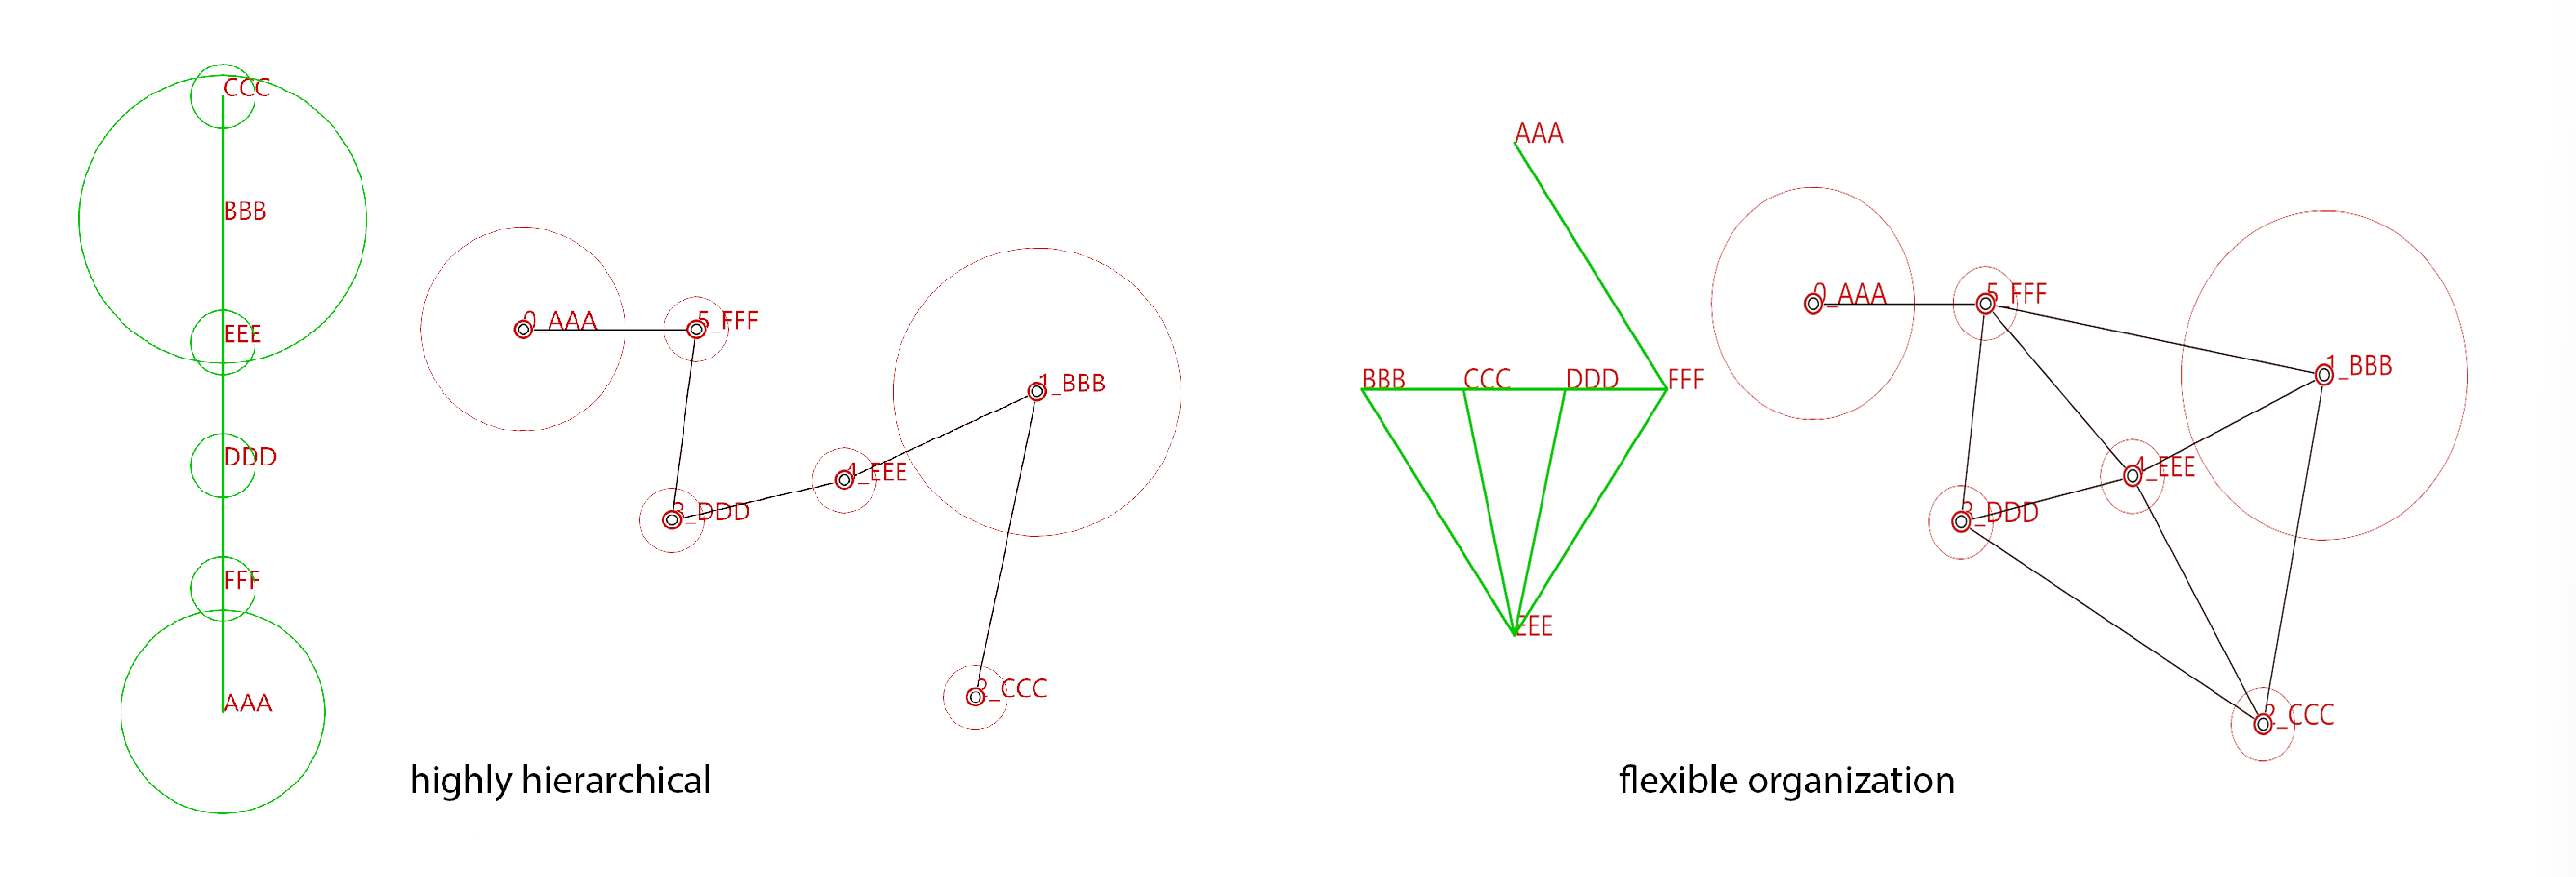
The setup of the connections is not a random process, it has to be defined how one space (function) is related to another. Connecting the different points can lead to a highly hierarchical organization of the spaces, moving from space to space without much choice or a highly flexible organization of spaces with options to choose between more options to move to the different spaces. How you will move through the design is fundamentally different in these cases as well as the functional relations of the spaces (functions).
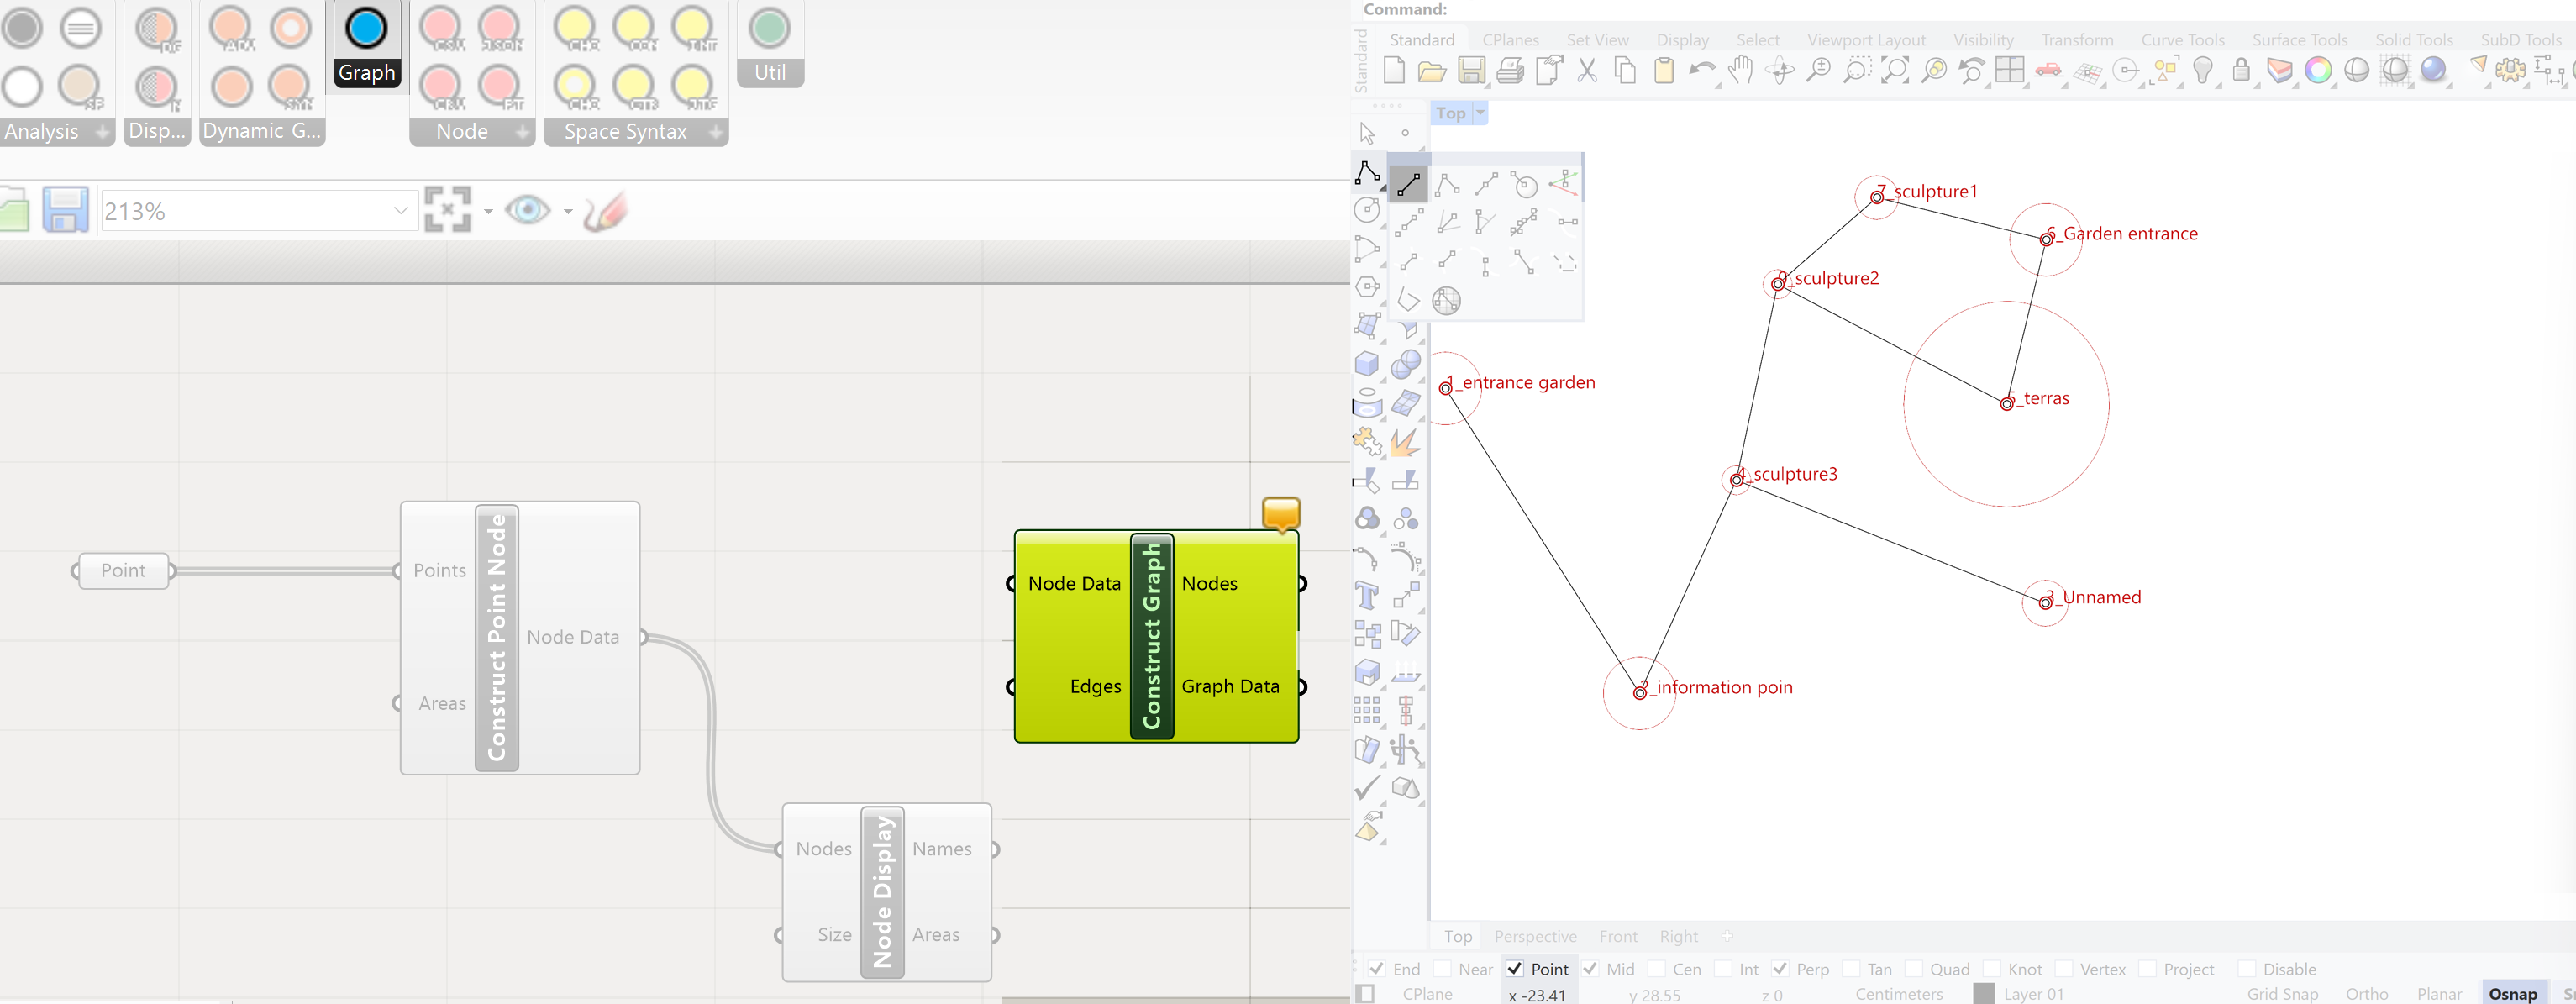
Make the Graph
To make the graph with the spaces(functions) and their connections we need a Construct Graph component. This component has two inputs, the nodes (spaces-functions) and the edges (connections between the nodes)
The node information is already available from the Construct Point Node. The edges have to be drawn in Rhino. Which nodes to connect and in which order is part of the design process.
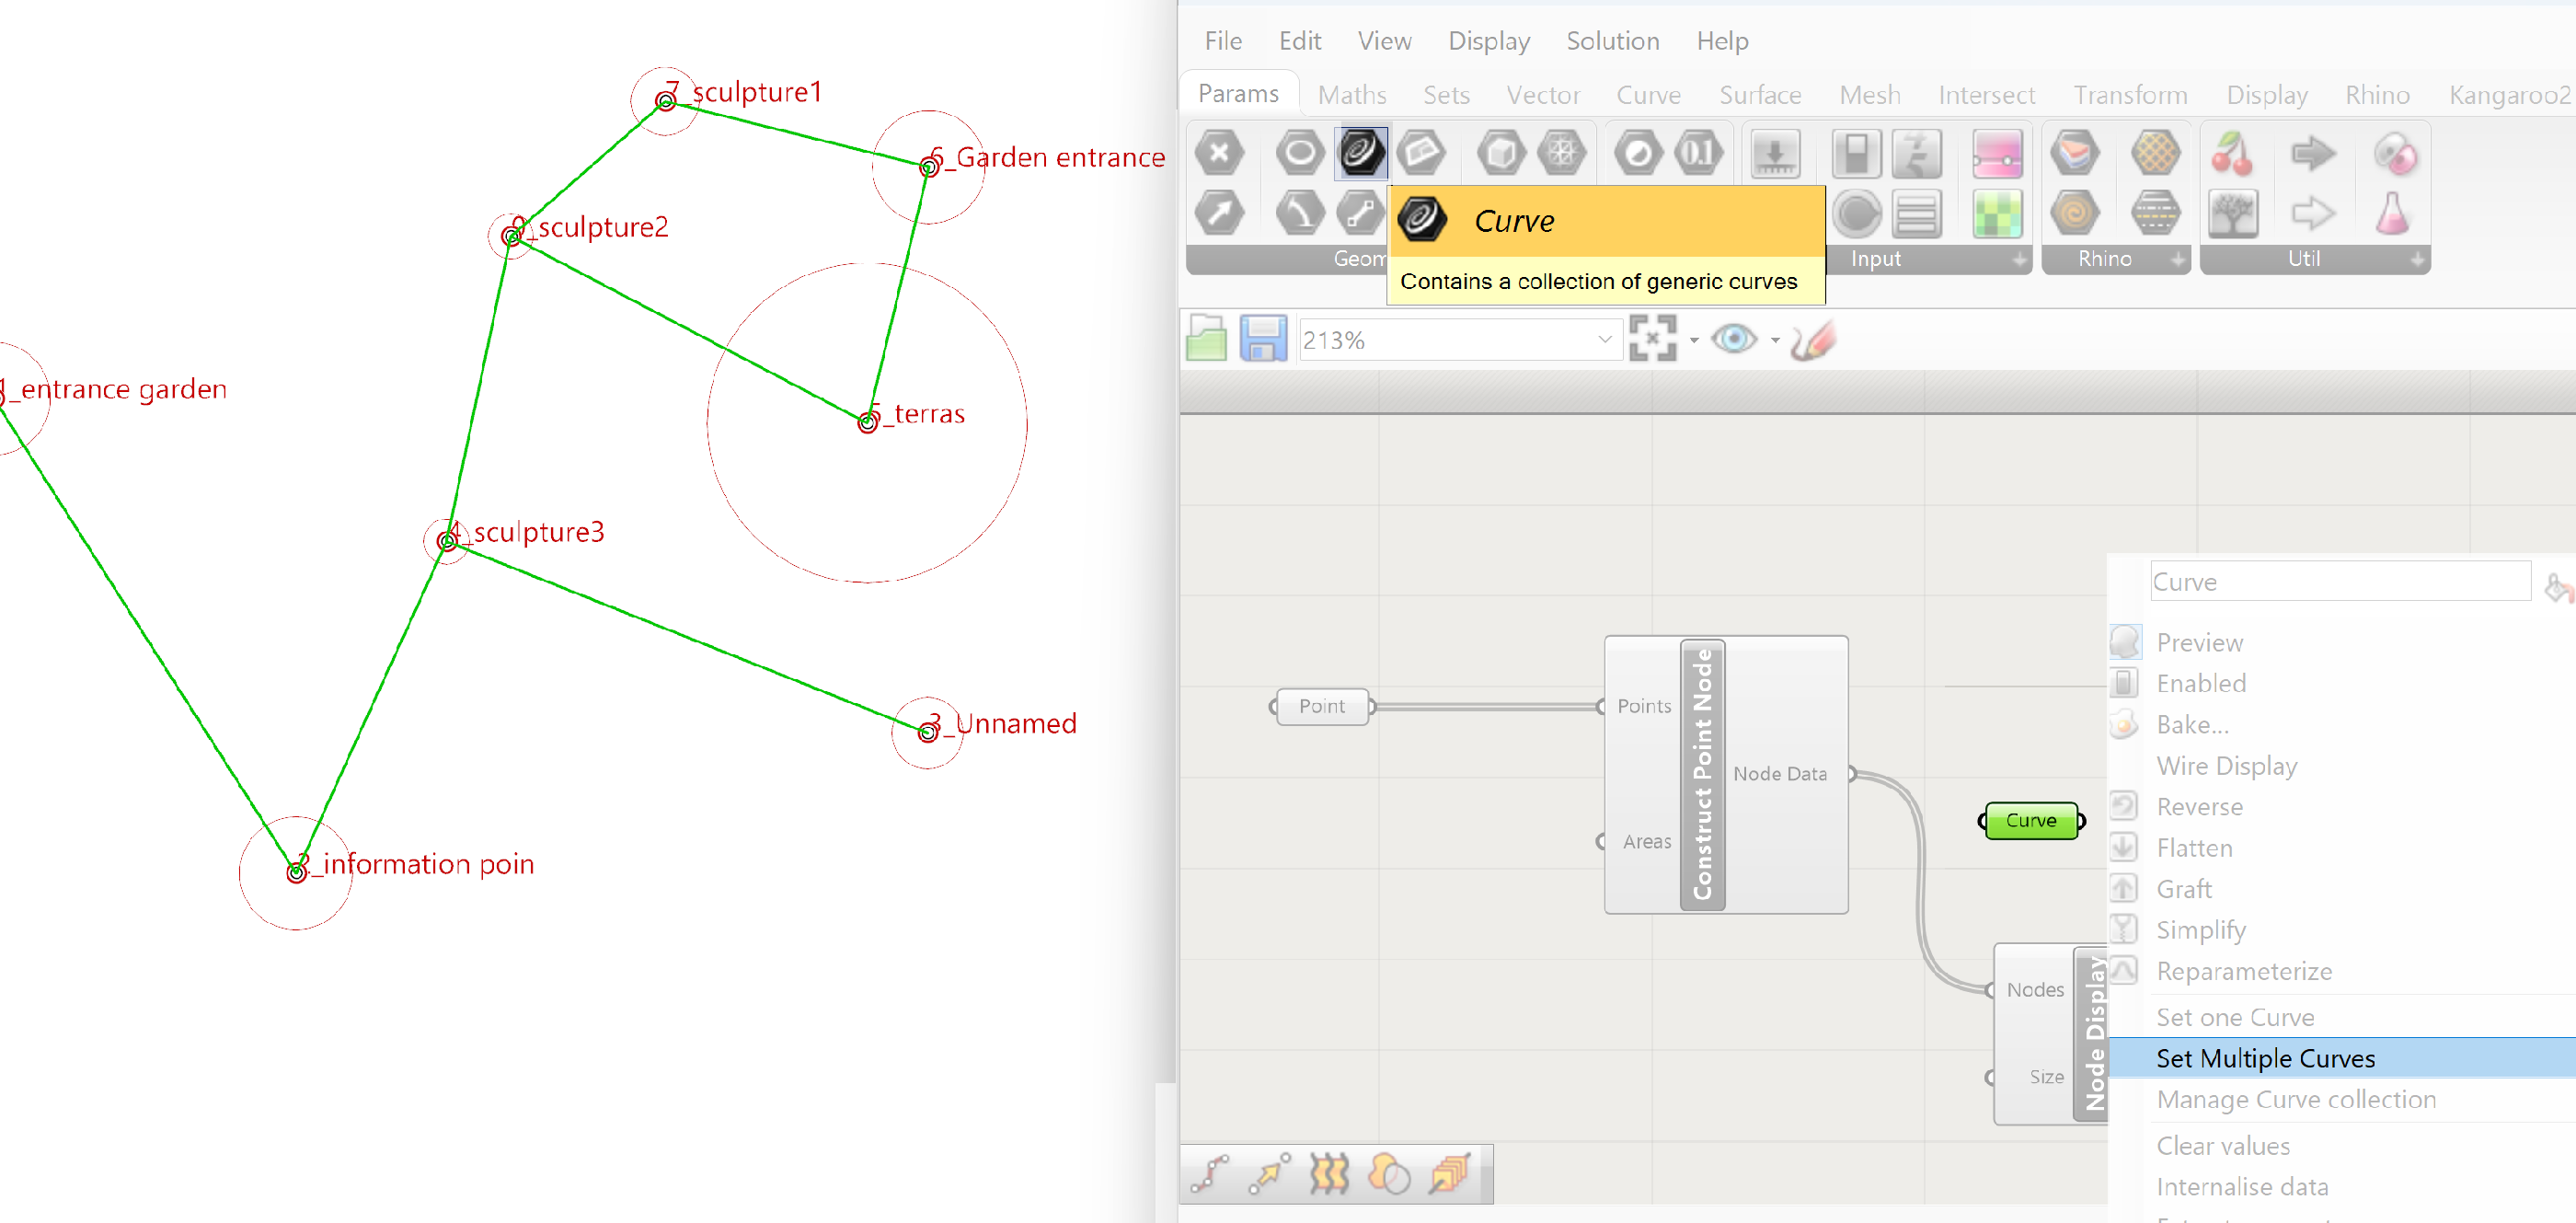
Make the connections with the Line option of the flyout of the Polyline command. The flyout is activated by clicking on the arrow in the lower right corner of the Polyline command in the toolbox.
To make sure you connect the line correctly to the points, use the point snap option!

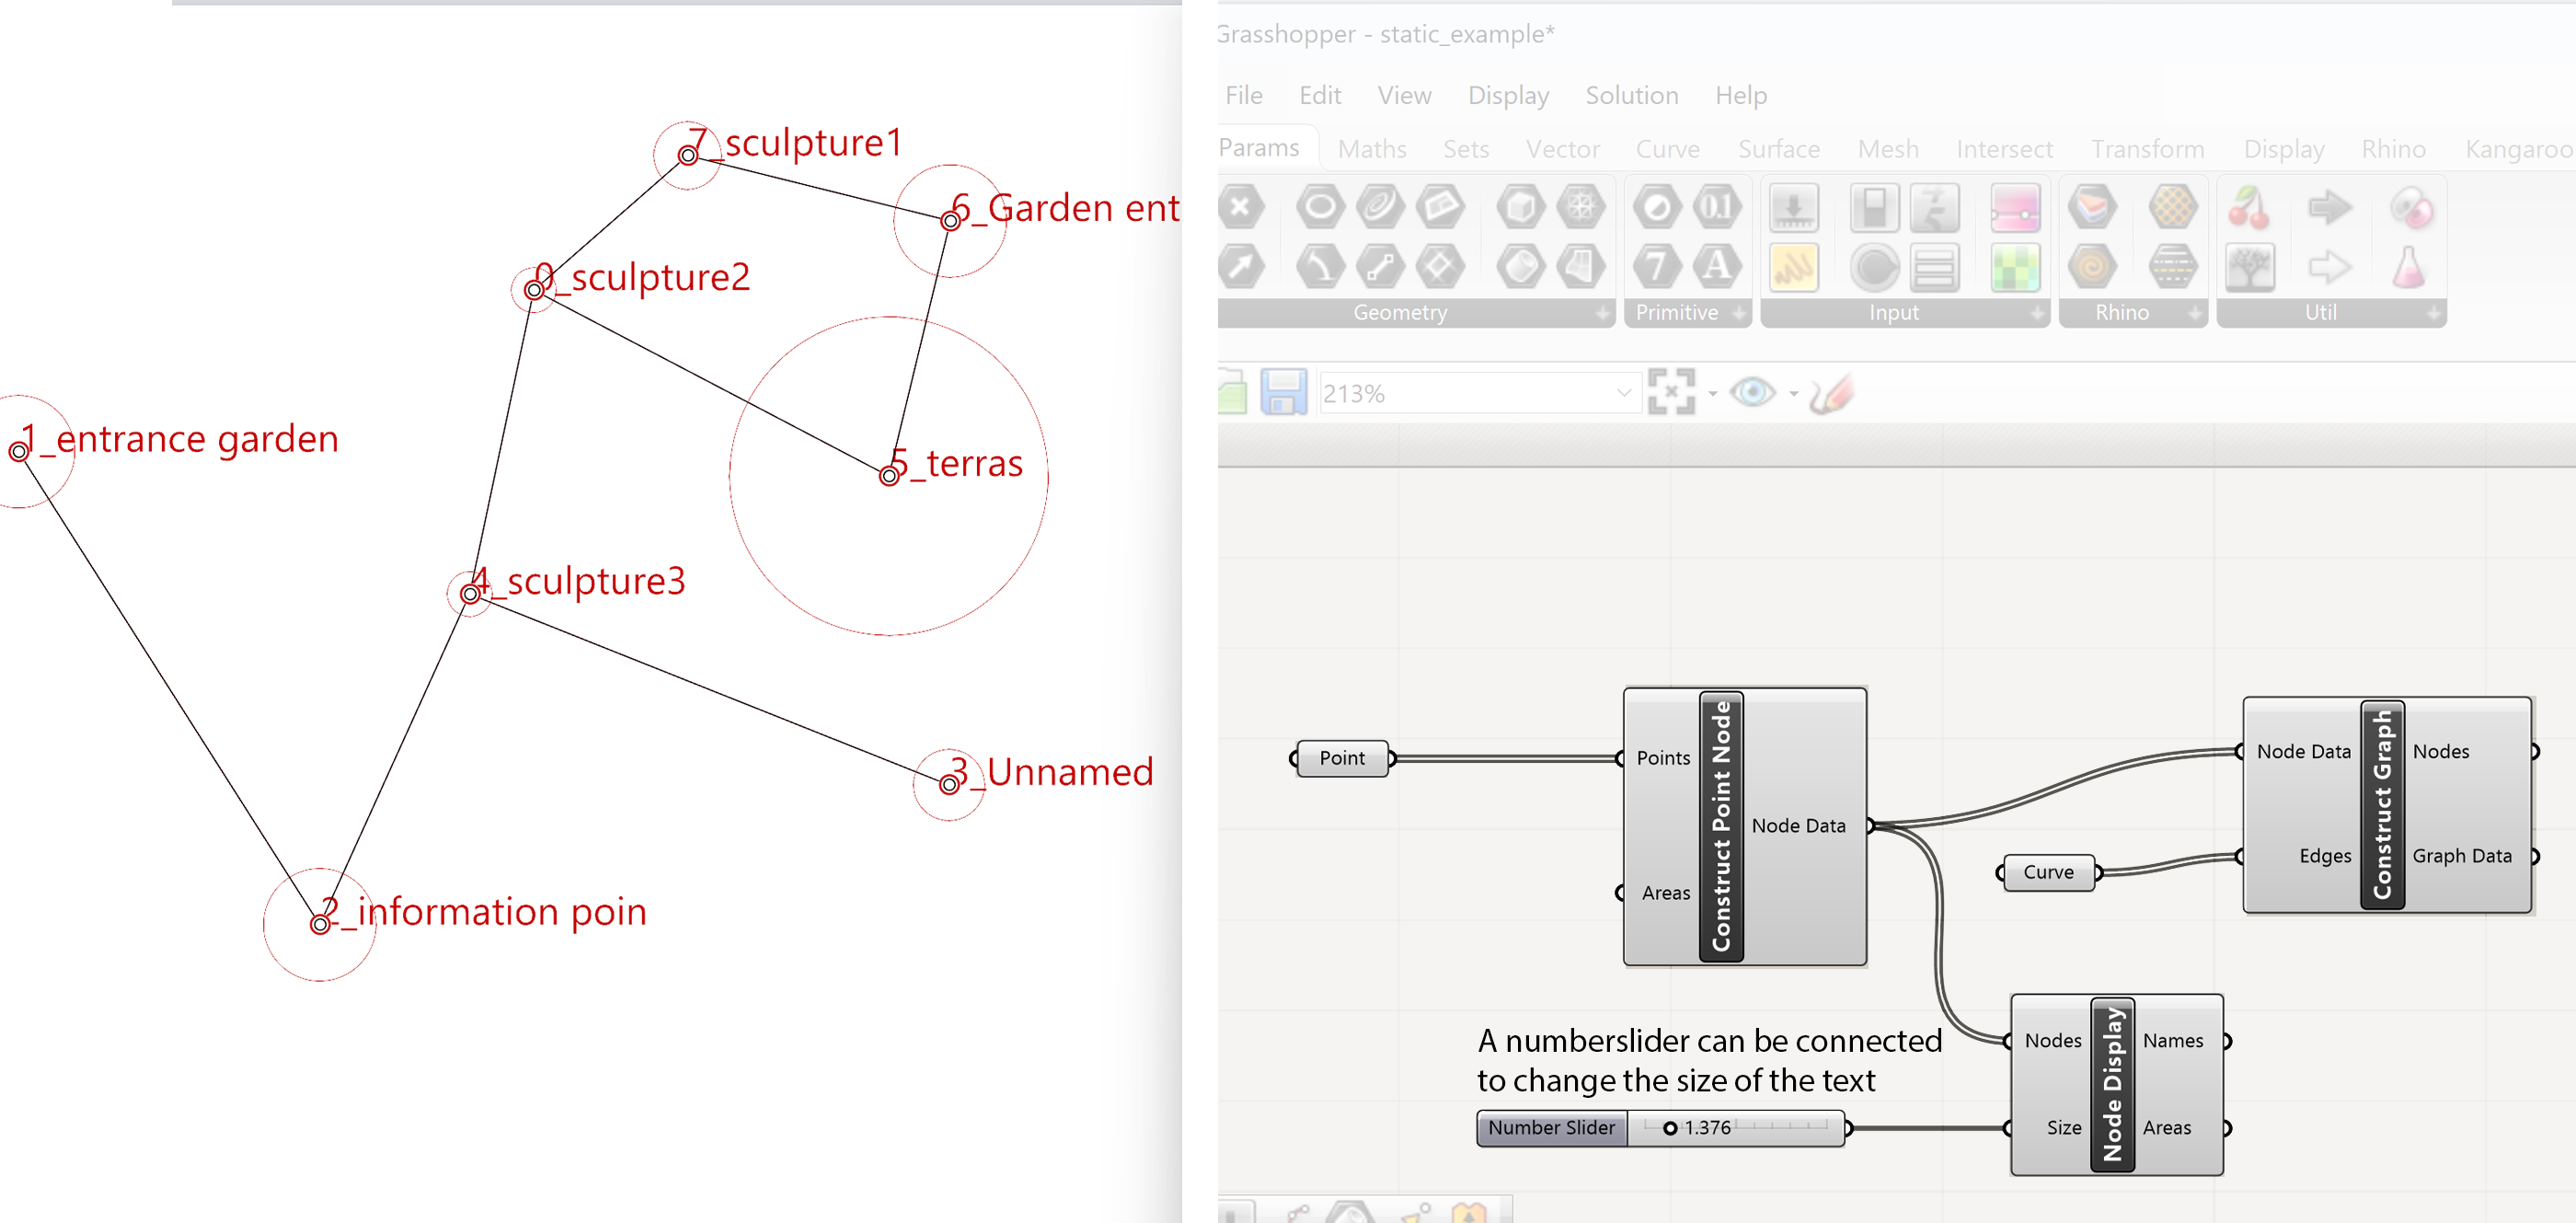
In Grasshopper a Curve parameter is used to import the lines from Rhino into Grasshopper. Select the lines in Rhino and right click on the Curves component, select the Set Multiple Curves option. This Curve parameter is used to the connect to the Edges input of the Construct Graph component.
To construct the Graph, the Node Data from the Construct Point Node is connected to the Node Data input of the Construct Graph component. The Curves parameter is connected to the Edges input.
This Graph can be analyzed to get insight in the connectivity and hierarchy of the spaces (functions
Spacechase Sculpture Garden Graph 3/7
Analysing the Graphlink copied
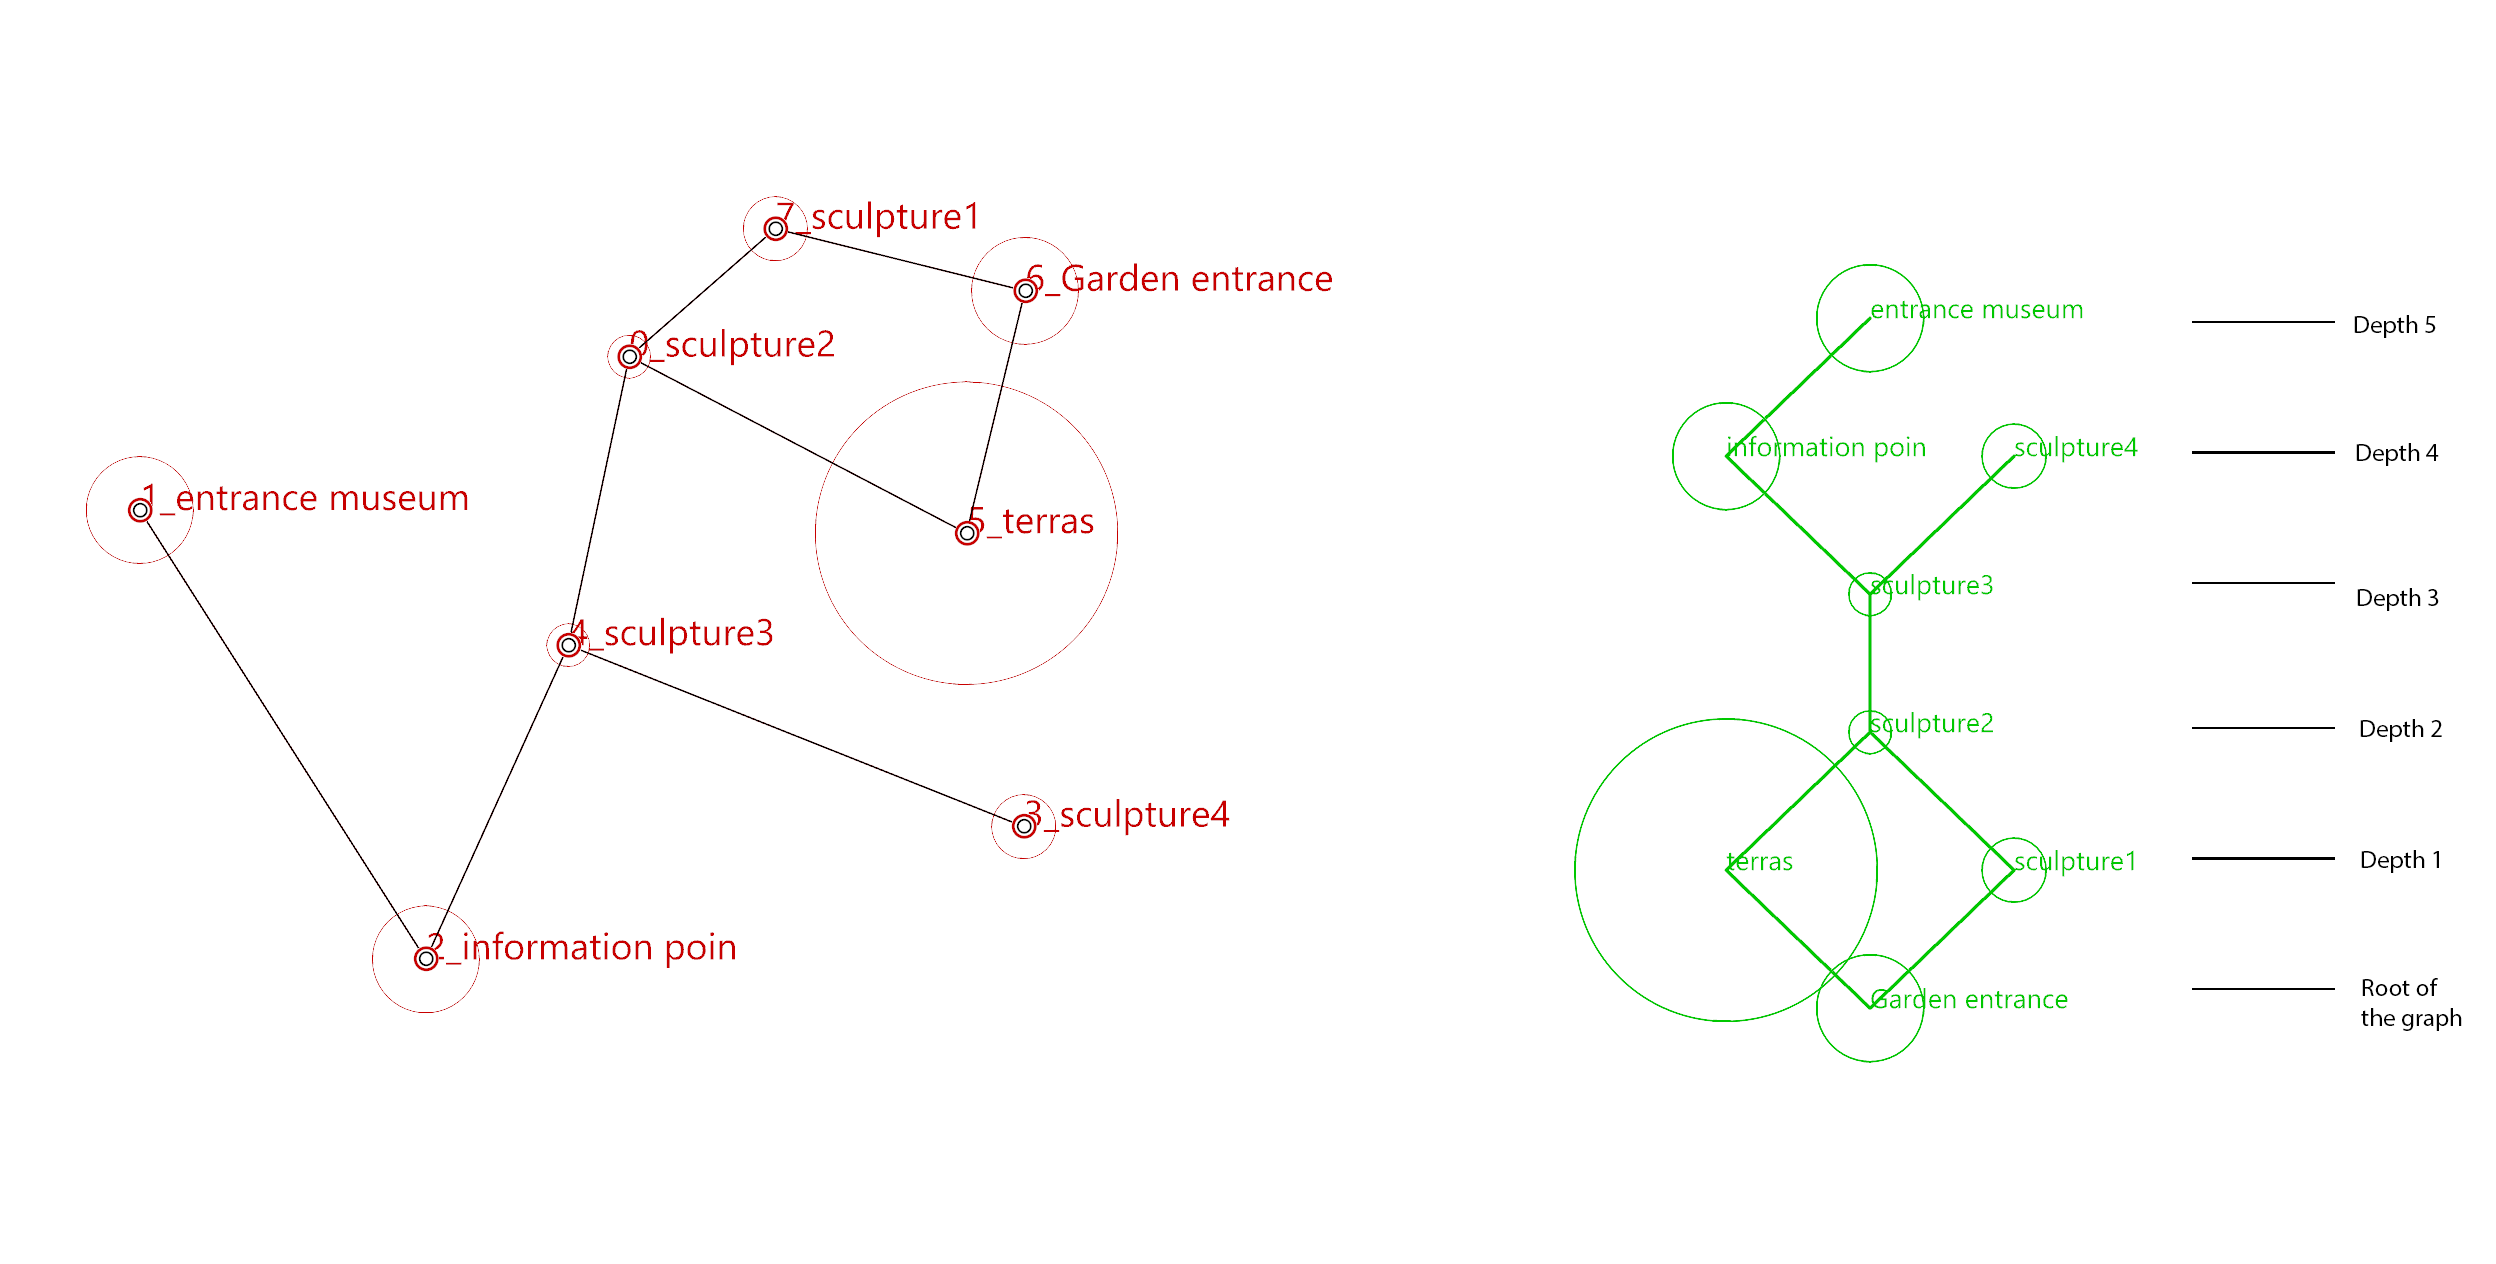
There are a wide range of options to analyze the position of the spaces (functions) in relation to each other. This can be the depth (number of spaces which have to be crossed to reach the goal) between each of the spaces (functions) in relation to each other or shortest path through the graph from one space to another. All these options of analysis are relevant for the design. In this tutorial we will focus on two options to analyze the graph.
Depth is a term which indicates the amount of spaces(functions) one needs to go through to go from a starting space(function) to a selected space(function) This term is often used in the analysis of the network created by the spaces and their connections.
Integration
Integration Is an analyses which calculates how close (in this case) one point in the graph is to all the other points, and provides therefore a measure of relative depth. Due to the calculation of the analysis, the higher the value to more central the point is in relation to the other points. This centrality can be useful for a point with a common function like the information point. Because it is more central is easier to access from the other points.

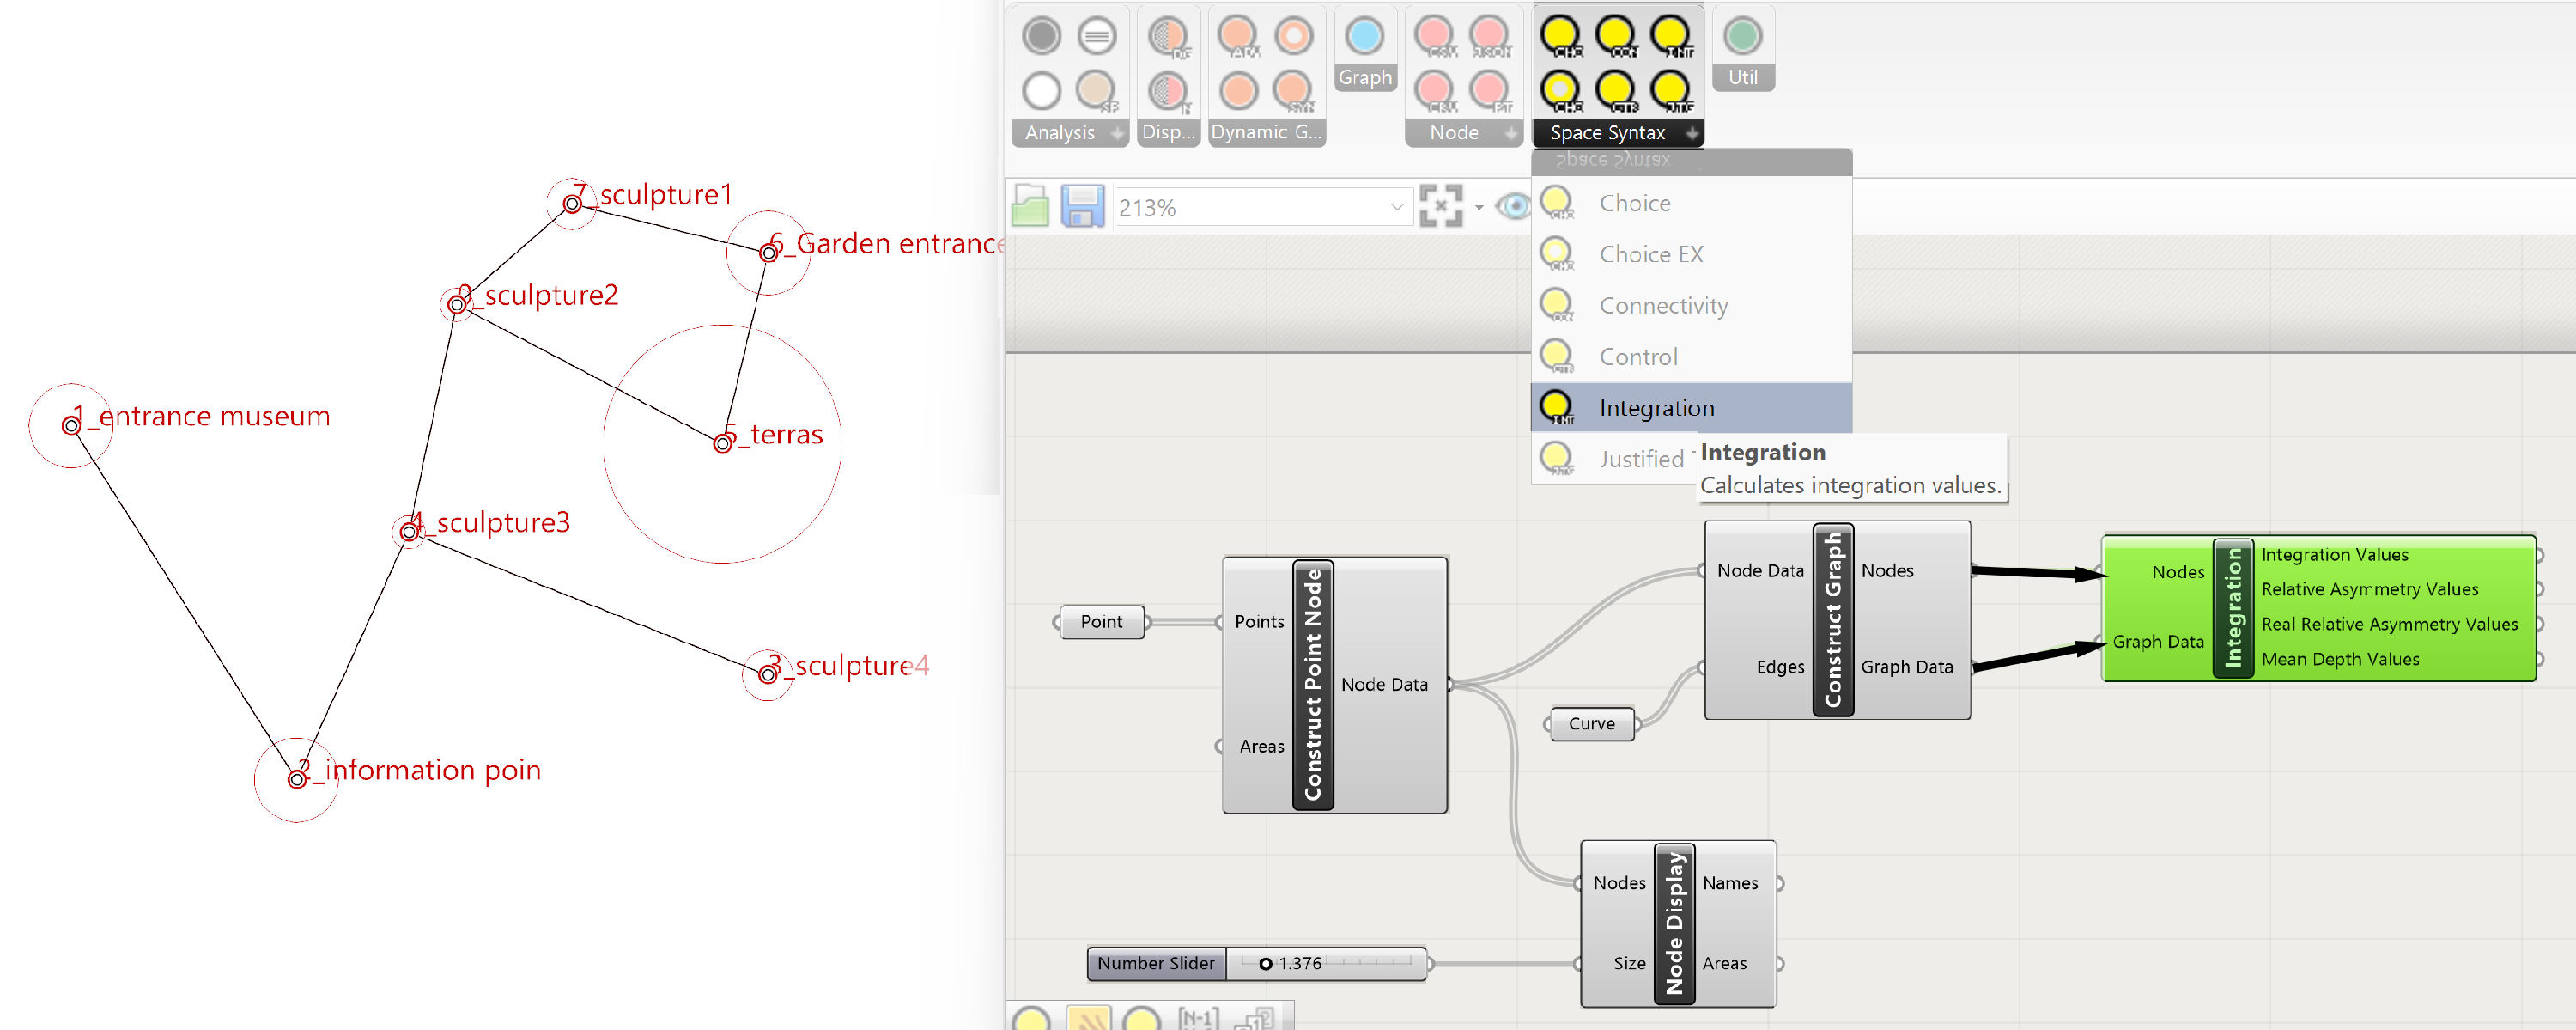
In Spacechase the analysis tools can be accessed by the Space Syntax tab. There are a range of options available. For this tutorial we are going to use the Integration component. Select the Integration component and drag it to the canvas.
The Integration component has two inputs: Nodes and Graph Data. Both are available from our previous constructed graph from the Construct Graph component. Connect the Nodes output to Nodes input and the Graph Data output to the Graph data input.


To read the result of the analysis we need a panel. Double click on the canvas and type in panel. This provides a panel which can read the output of the Integration Values. Create another panel to read the names of the points in the graph. The Nodes Display component can be used for this. Connect the names output to the panel and move that panel next to the panel of the Integration values. Now the value can be read from each of the points of the graph.
Connectivity
Connectivity investigates the number of direct connections between one point and their directly adjacent points. This tells something about the hierarchy of the points/spaces. Do you want to make all/many of the points directly accessible from one point, say for example the garden entrance, or do you want the visitors to follow a route from one space to another, with maybe some options of changing the route along the way.
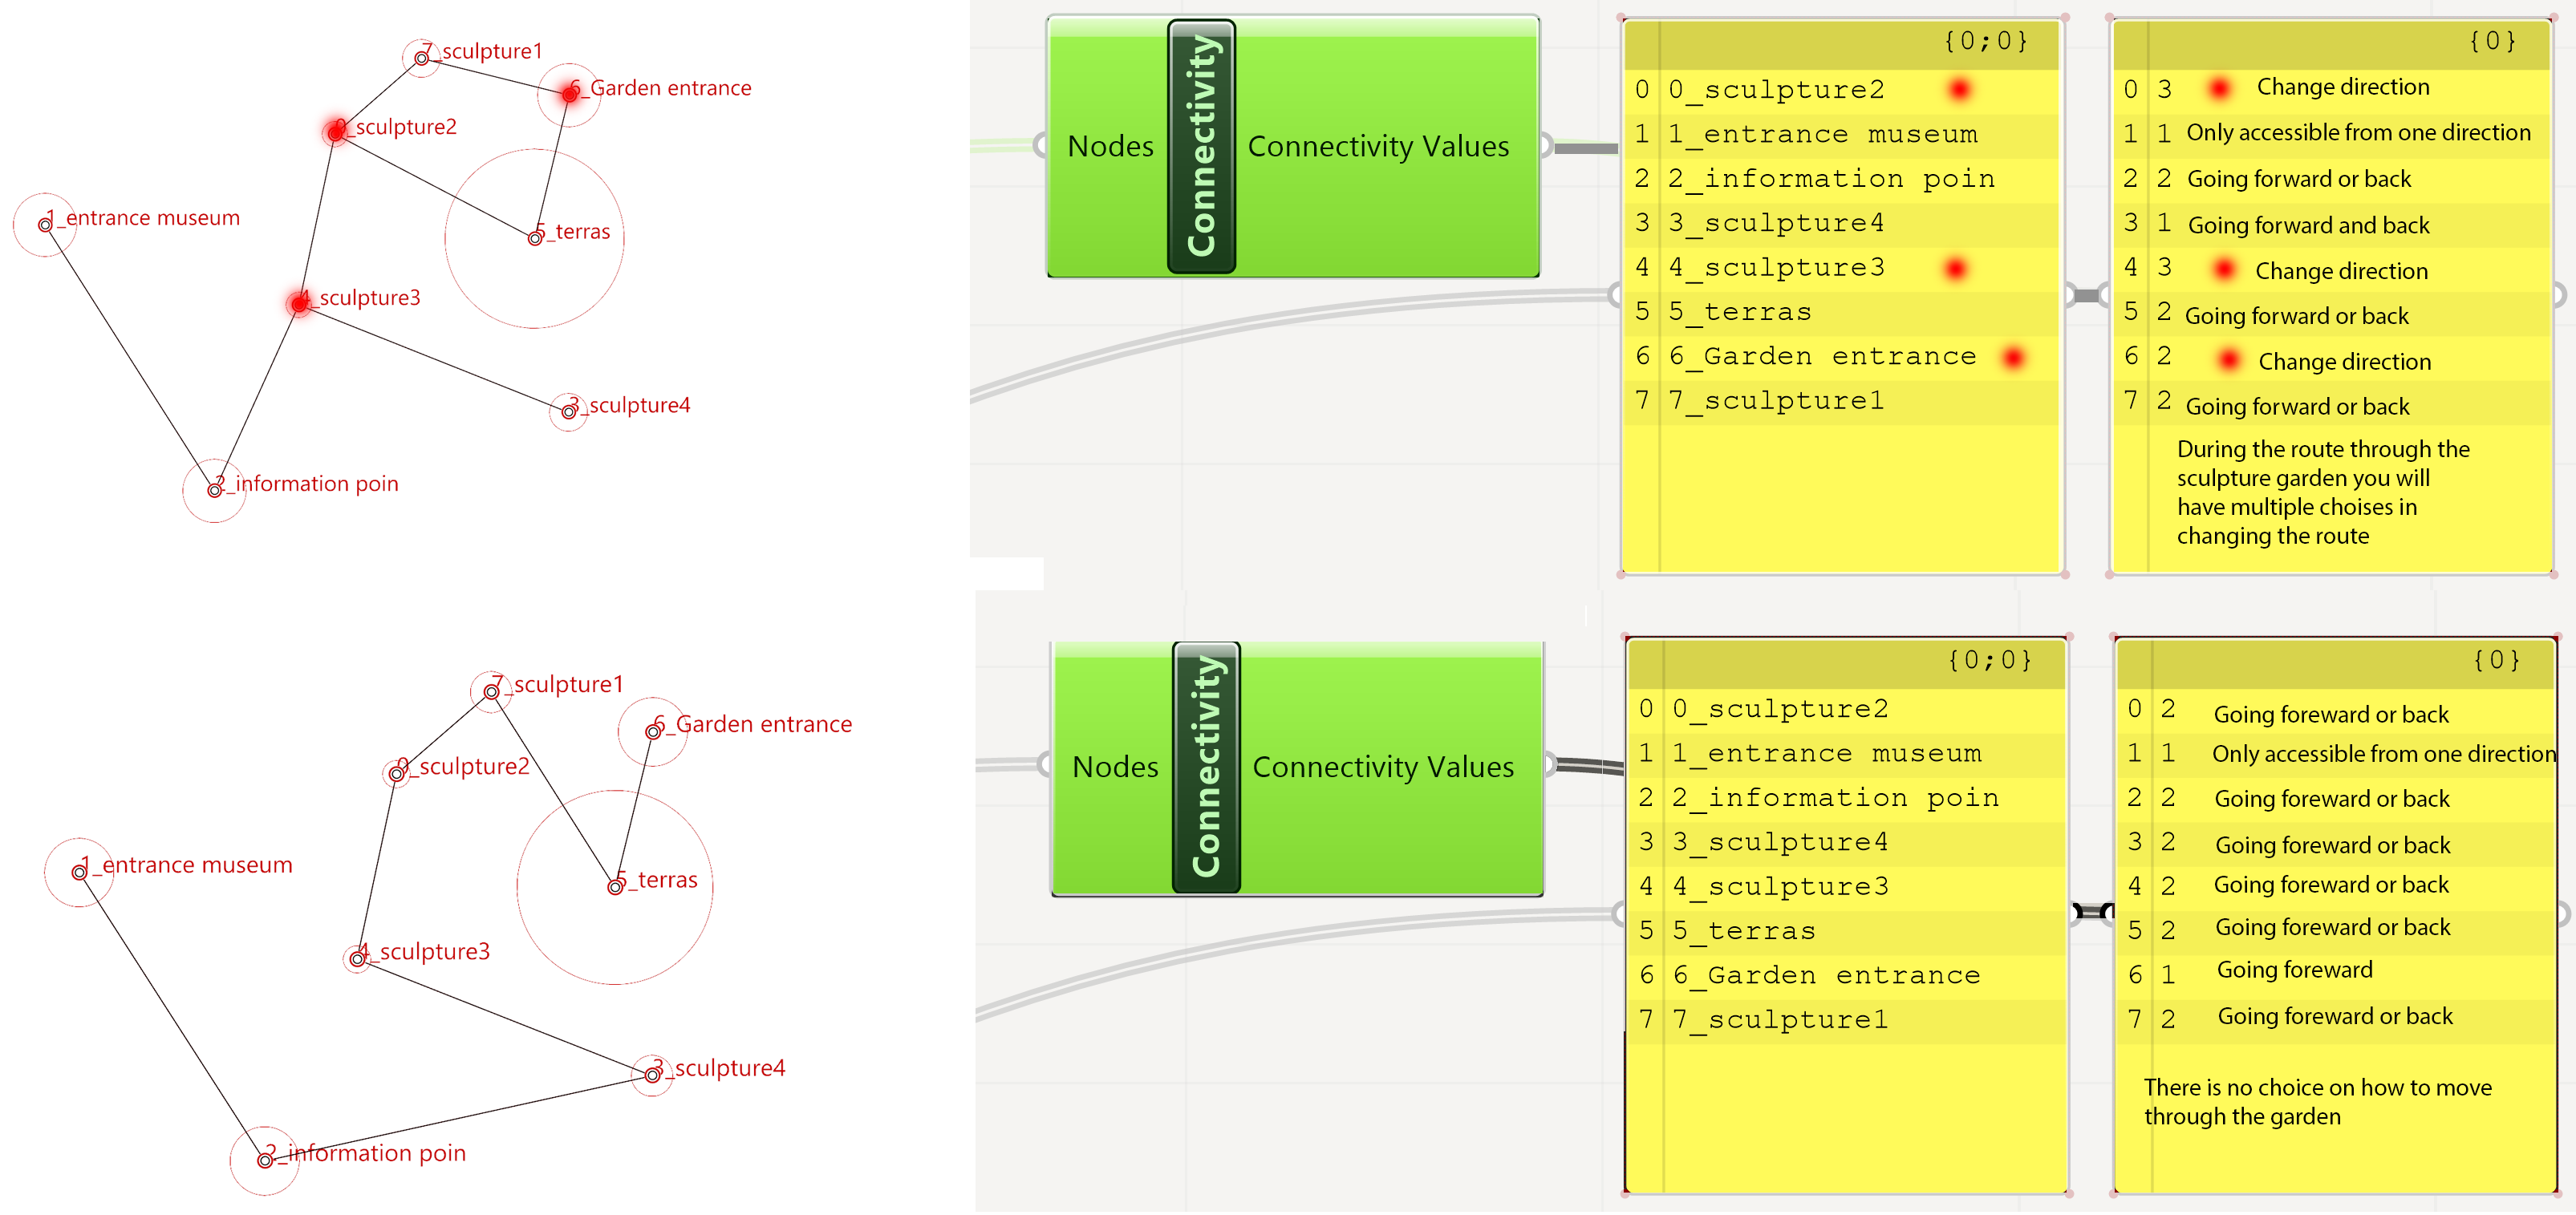
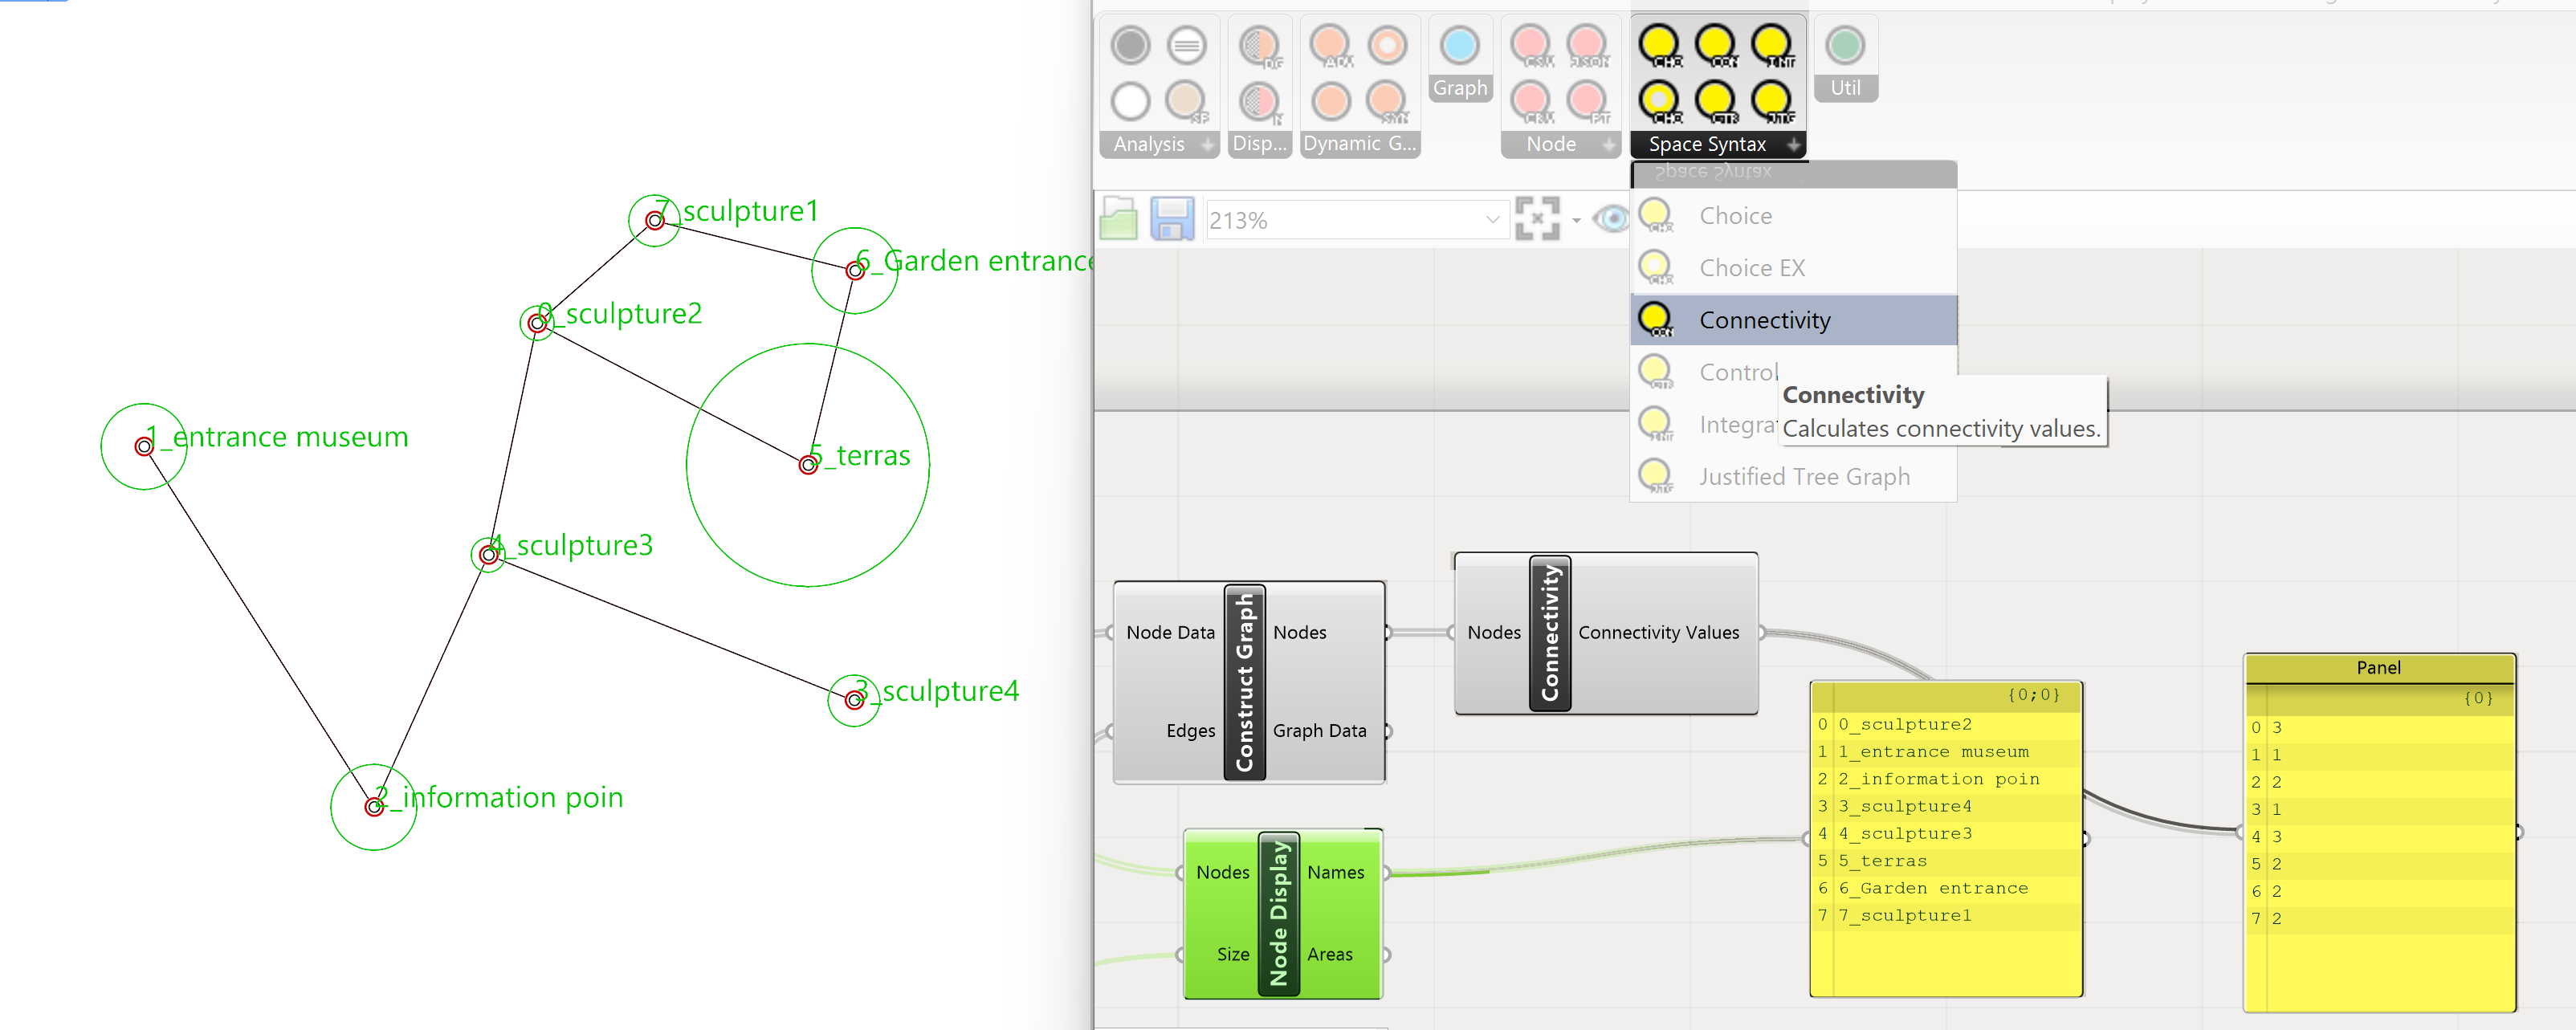
To extract this data from the Graph go to the Space Syntax tab and select Connections. Drag this component onto the canvas. Connect the Nodes output of the Construct Graph component with the Nodes input of the Connectivity component. To access the analysis data connect a panel to the output of the Connectivity component. Make a panel and connect it to the Names output of the Node Display component and place the panels next to each other.
Spacechase Sculpture Garden Graph 4/7
Changing the Graphlink copied
Based on the analysis it might turn out that the connections of the spaces/ functions can be improved. In that case the lines between the points have to be altered and reassigned to Grasshopper.
To change the Graph make new lines between the points, select them and reassign them to the Curve parameter which is connected to the Construct Graph component.
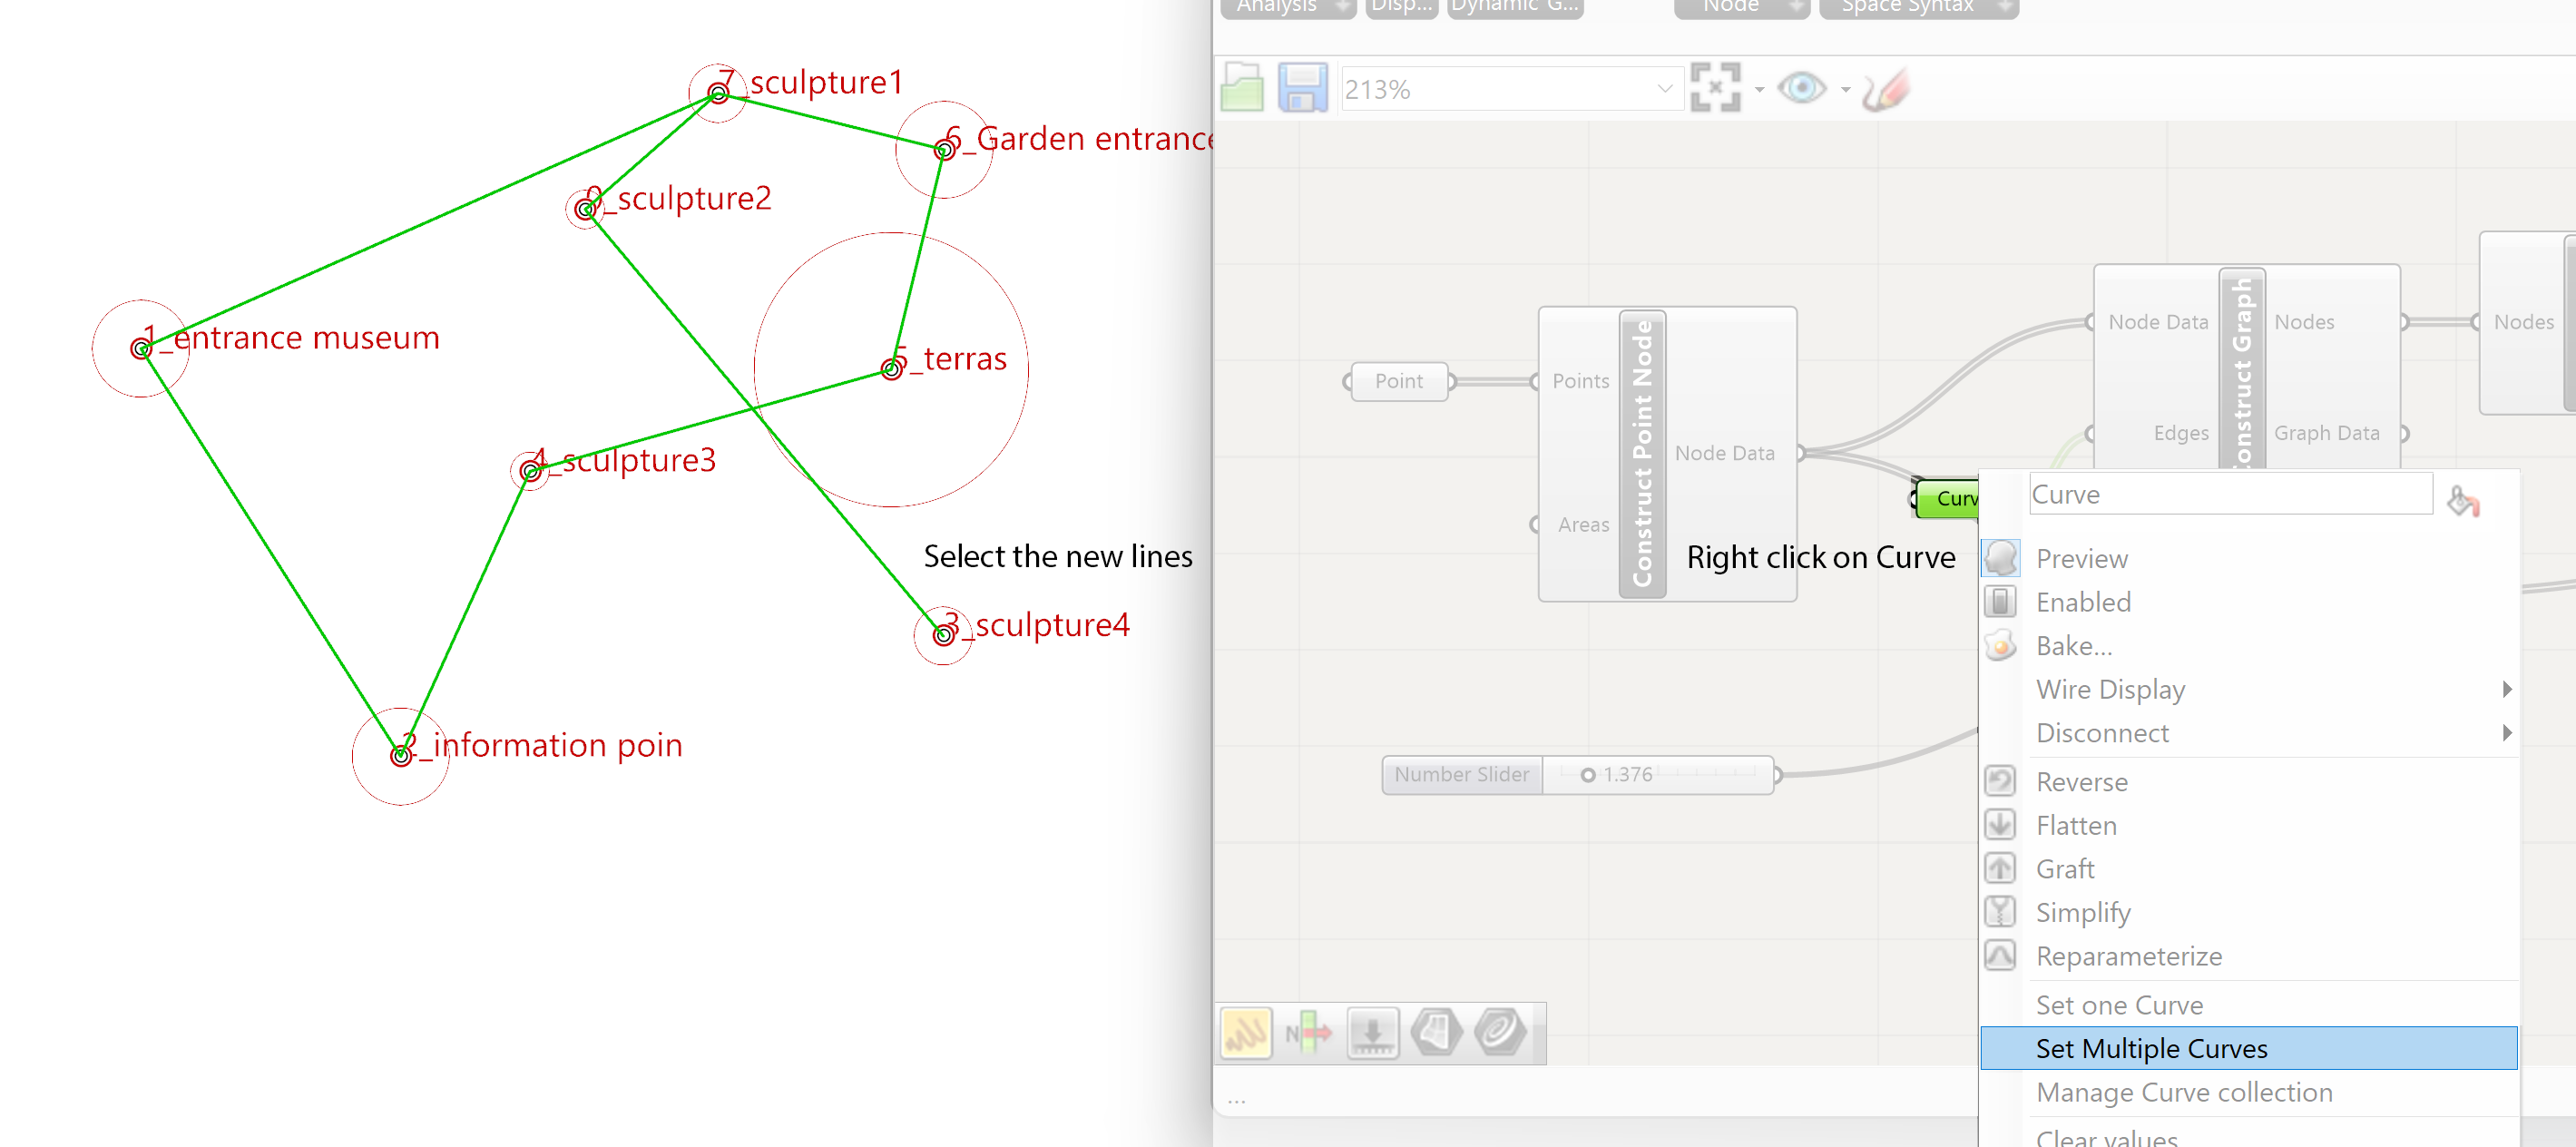

The analysis data will not automatically update to the new graph. To force Spacechase to use the new lines in the graph press F5 on your keyboard or go to Solution of the Grasshopper pulldown menus and select Recompute.
Spacechase Sculpture Garden Graph 5/7
Justified Tree Graphlink copied
Spacechase has the option to generate a Justified Tree Graph. This means that it can create the graph from the perspective of one point in the graph where it shows how the other points are connected and at what depth they are connected. The network of connections remain the same and therefore the functional connections are the same, although the layout of the points can drastically change.
This allows to investigate the connections from a selected point with the other points in a graphical way.


To construct a Justified Tree Graph go to the Spacechase tab and select Justified Tree Graph. Drag this component onto the canvas. We have 4 inputs Nodes, Graph Data, Frame and Index.
The Nodes as well as the Graph data information is available from the output of the Construct Graph component. Connect these to the input of the Justified Tree Graph.

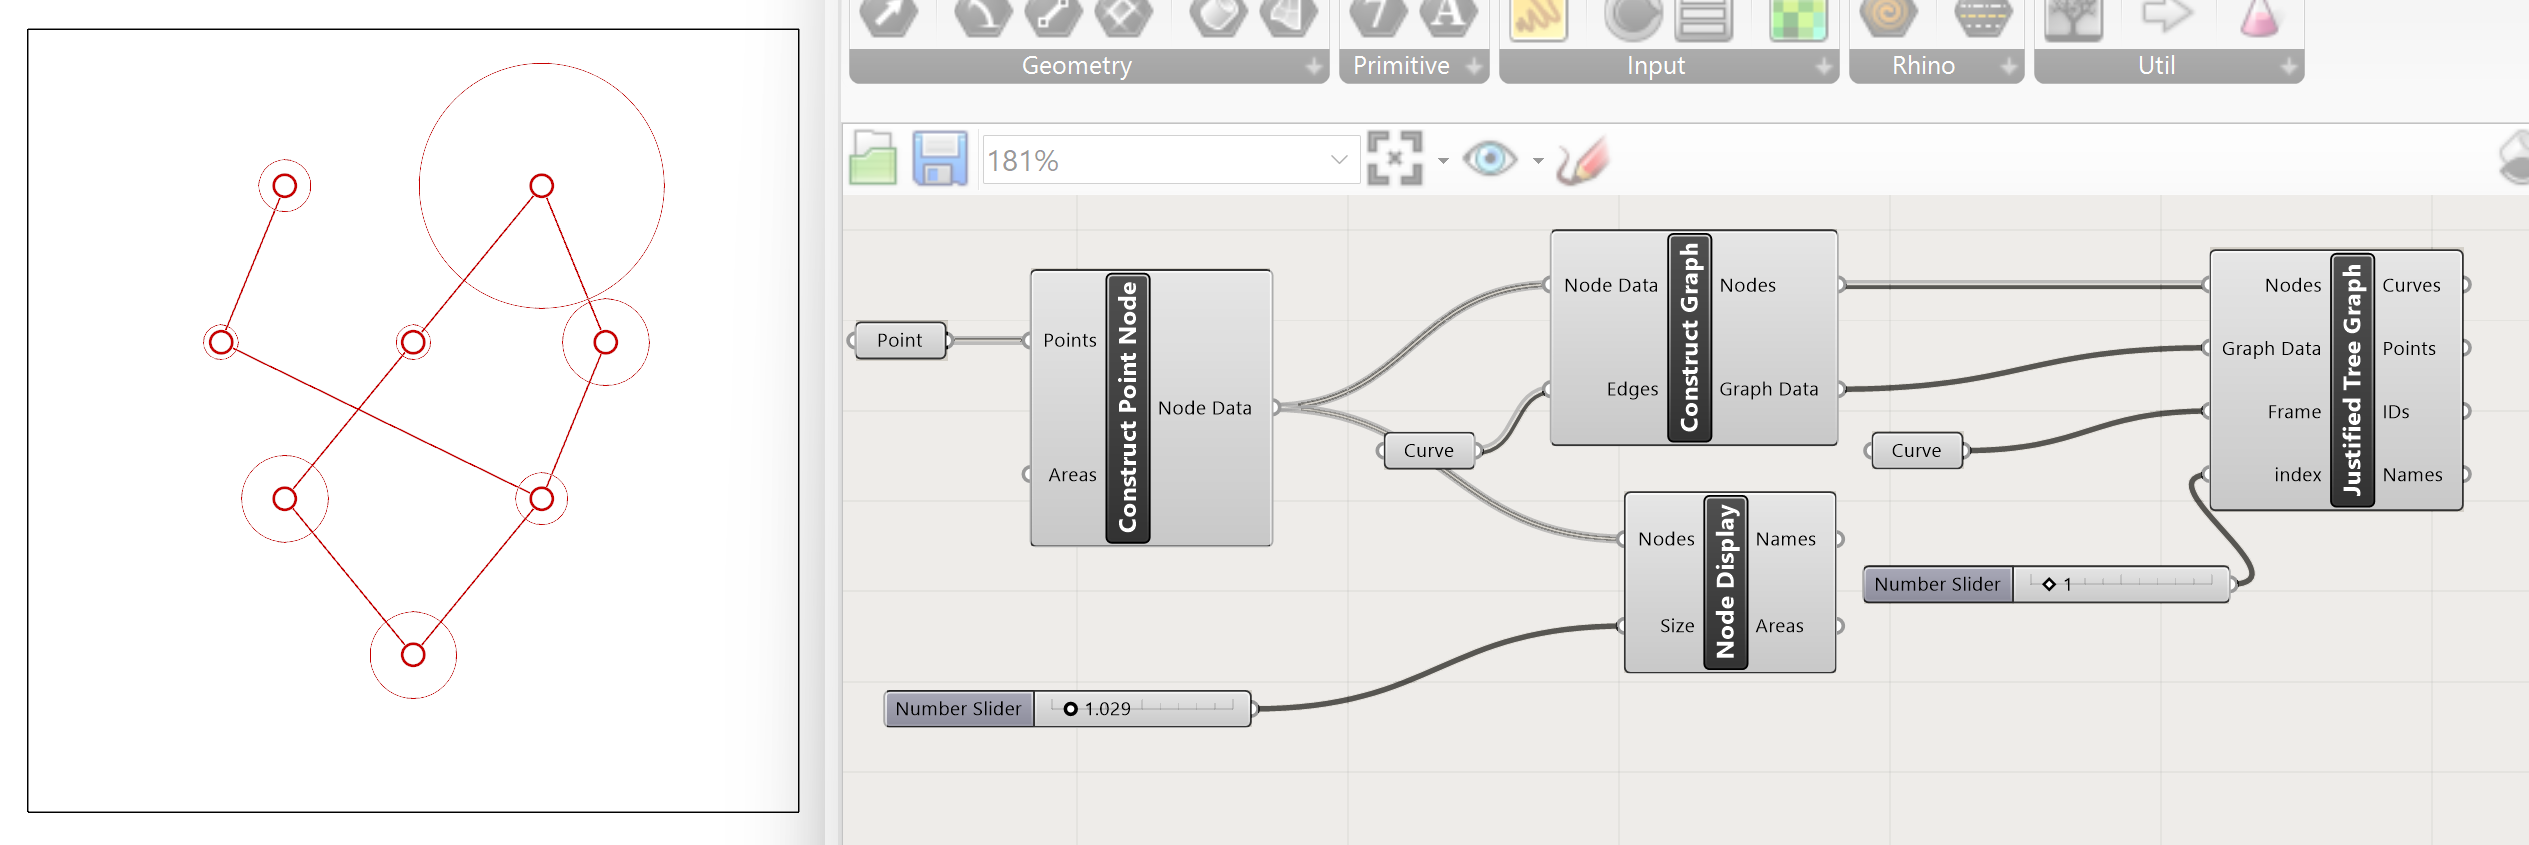
To place and define the size of the Justified Tree Graph we use a rectangle in Rhino. Create a rectangle in Rhino and connect this to a Parameter – Curve. The justified Tree Graph will be produced within this rectangle. A number slider is added to define the Index ( which point) of the start point.

To visualize the names of the points we use a Display – Text Tag 3D component. Select the component and drag it onto the canvas. The input for the Text Tag 3D component is Location ( of the text) , the text ( names of the points ), size ( size of the text ) , color ( of text) and justification ( position of the text next to the point) By right clicking on the Justification input a menu appears where the position of the text in relation to the points can be altered.
The location can be extracted from the point output of the Justified Tree Graph component. The text can be extracted from the names output of the Justified Tree Graph component. We can use a number slider for the size of the of the text. A color can be added if needed.
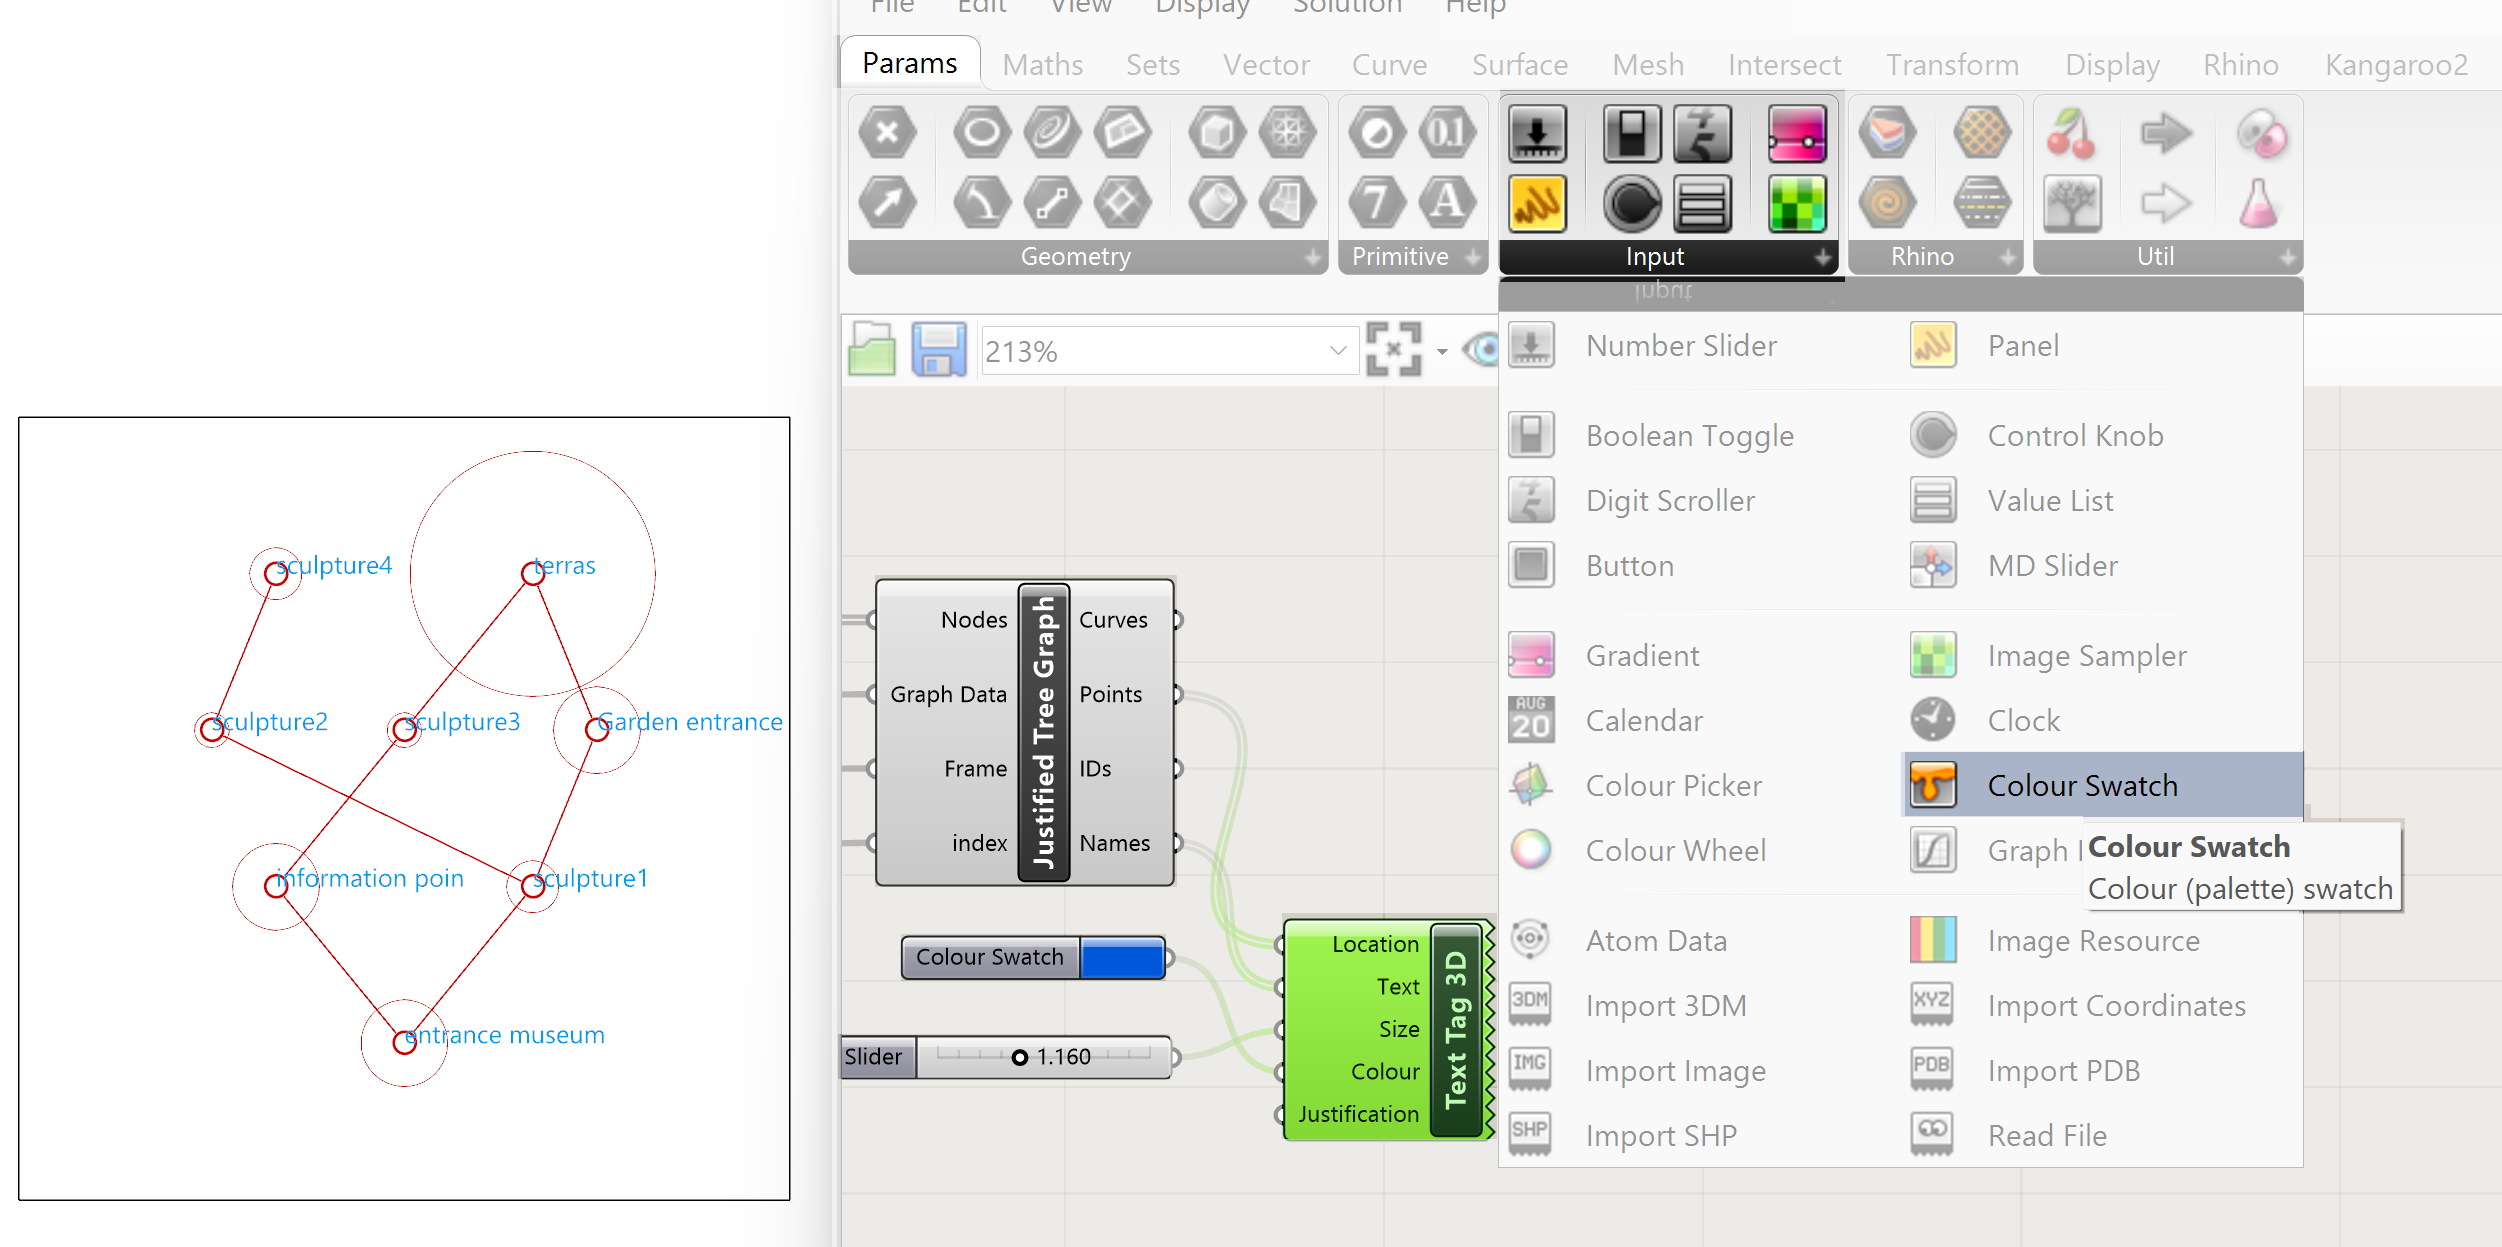
This Graph helps you to analyze the connections between the spaces/functions, giving insight into how the spaces and functions are related to each other, their functional hierarchy and spatial/functional experience when moving from one space/function to another. This graph doesn’t provide the location of the spaces on the site. It defines their spatial/functional relationships, the location of the points of the graph can change location without “breaking” de graph as we can see with the Justified Tree Graph. This analysis provides essential more in-depth insight than a spatial layout on the site alone.
Spacechase Sculpture Garden Graph 6/7
Layout the spaces/functions in the locationlink copied
Once the spatial and functional relations are defined, the graph can be used to locate the spaces/functions inside the site. The graph generated in previous text can’t be used for this because the way the graph is imported in Grasshopper. The points and curves between the points are both made in Rhino. The curves are not a result of the points but just drawn. Moving the points will not move the ends of the lines between the points. They will detach.
To make the graph parametric so when the points move the lines will remain connected, we must generate the lines with the help of the points. To keep it simple we create a point parameter for every point we created in Rhino and will give it the same name.

Once we have all the points separately connected to Grasshopper and named them accordingly, we can create lines between the points to replace the lines generated in Rhino. This can be quite a bit of work depending on the amount of points and lines between the points. That is the reason we do this after we have a graph which represents our design intent correctly.
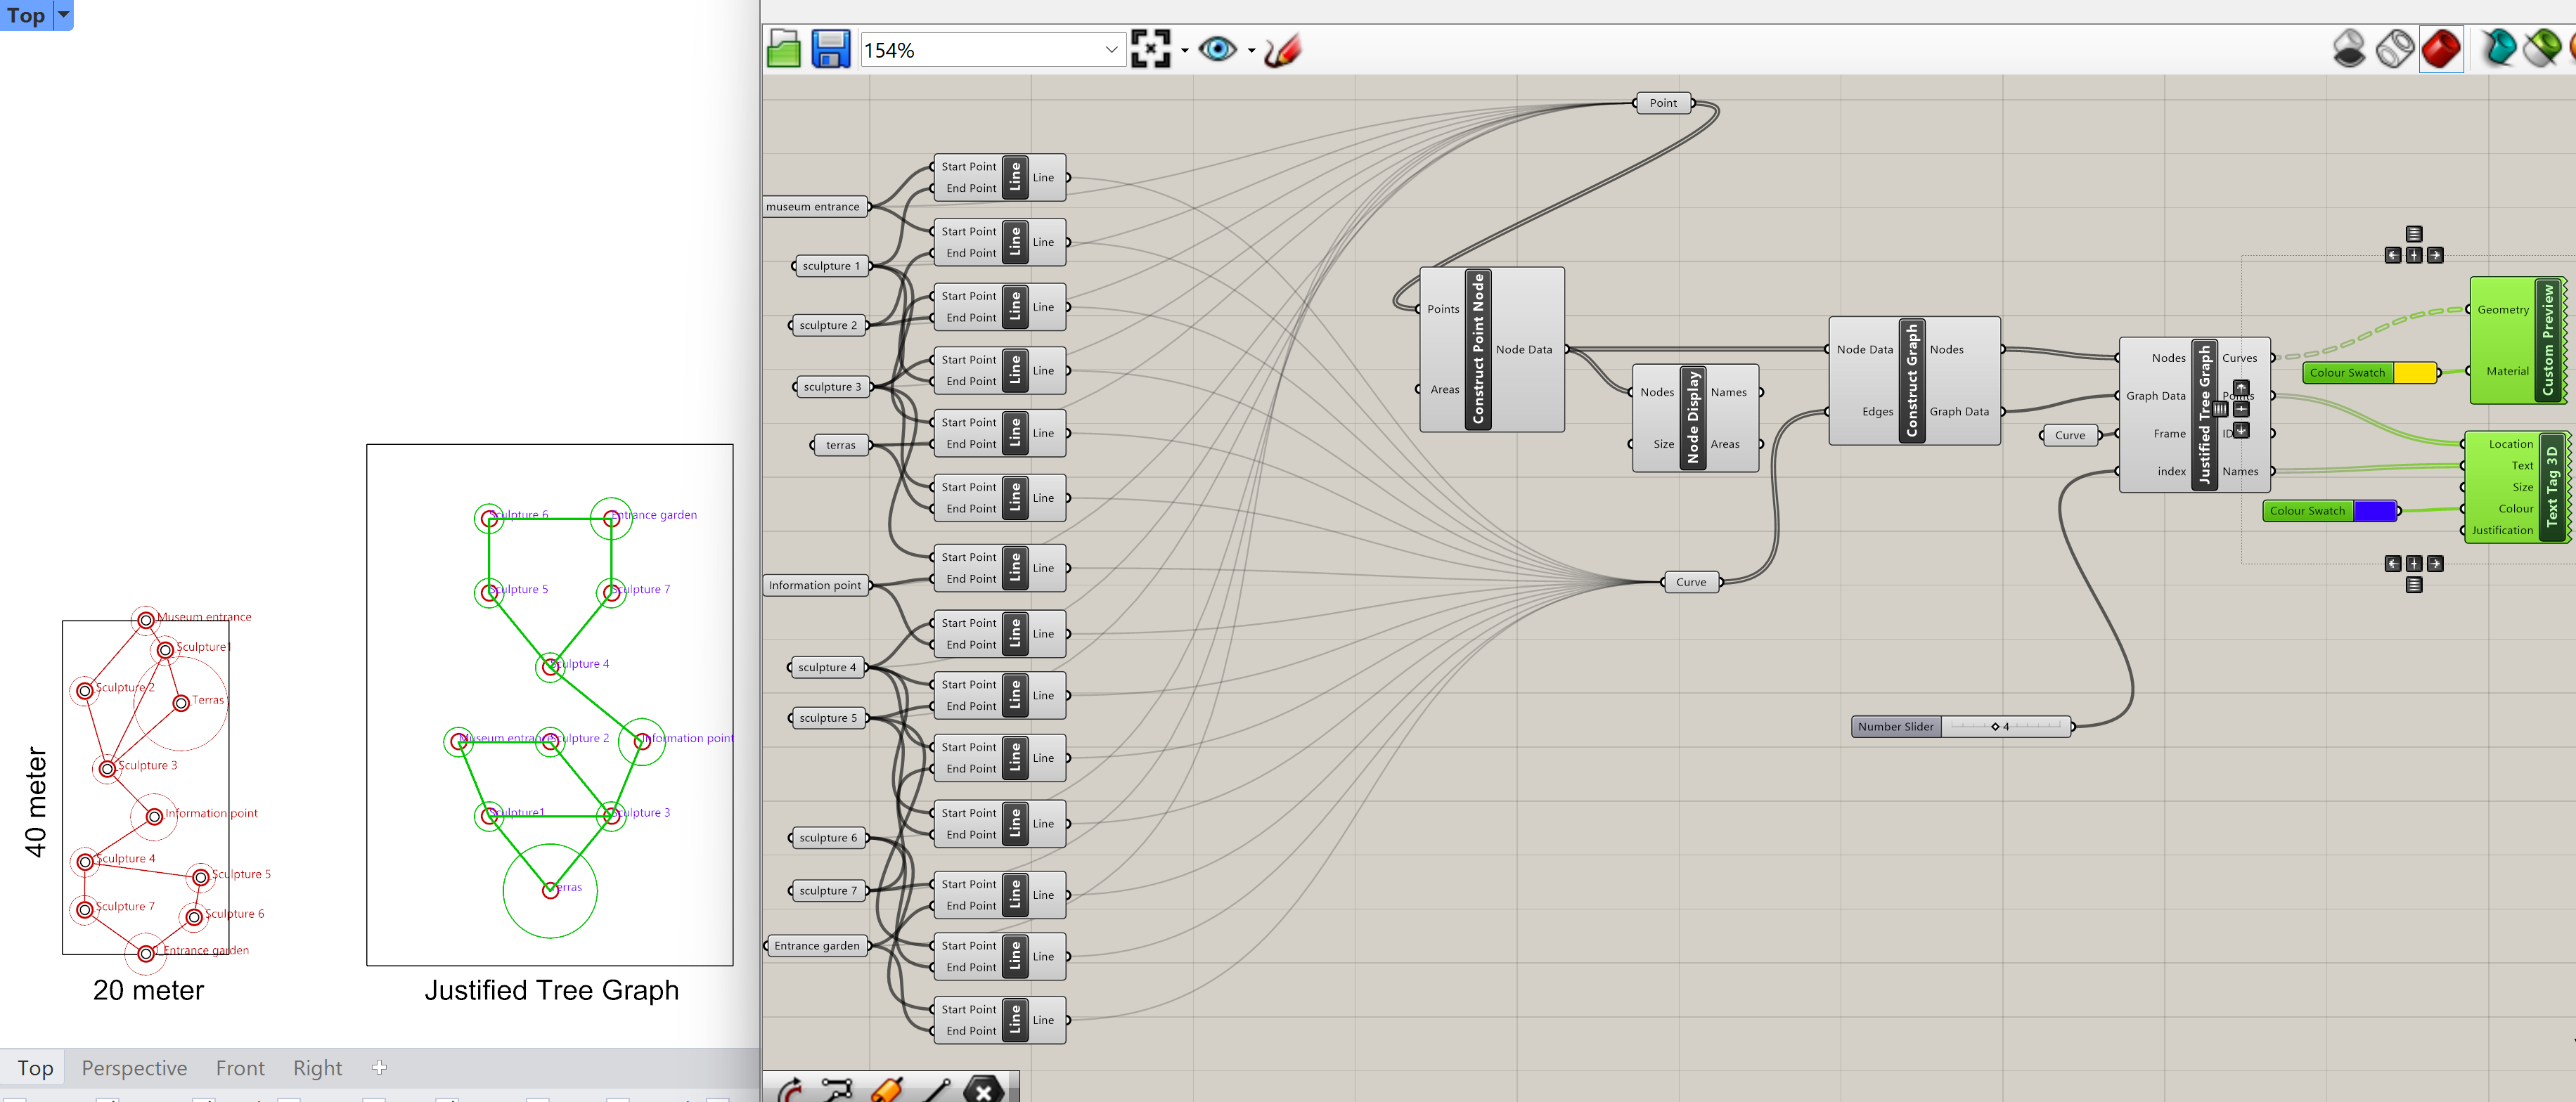
We combine all the separate points into one point parameter, and all the separate lines into a single curve parameter. To connection multiple components to a single curve input, press and hold the SHIFT key while you connect all the components. This will let you draw multiple wires to a single component.
The individual point components will connect to the point input in the Construct Point Node component. The edges input of the Construct Graph component will be replaced by the new defined curve parameter combining all the separate lines between the points. The function of the Graph is the same as the Graph using the lines drawn in Rhino, only it is now parametric. That means that if we move a point the lines will remain attached to the point. In the example file a rectangle of 40 by 20 units is created to give the correct size of the location.
Use this graph to place the points at the right location in the garden site without breaking the Graph and therefore the relationships between the points.
Make sure the units are set to centimeters.
Spacechase Sculpture Garden Graph 7/7
Conclusionlink copied
It is essential to investigate and define the spatial and function relations in the early stages of the design process before form generation takes place. An insight on how spaces are related to each other, how people will move through the spaces, how the functions are organized doesn’t only inform the designer it also has a substantial effect on how the users experience the design.

Write your feedback.
Write your feedback on "Spacechase Sculpture Garden Graph"".
If you're providing a specific feedback to a part of the chapter, mention which part (text, image, or video) that you have specific feedback for."Thank your for your feedback.
Your feedback has been submitted successfully and is now awaiting review. We appreciate your input and will ensure it aligns with our guidelines before it’s published.
