QGIS – Importing and Loading Data
-
Intro
-
Importing .CSV data using QGIS
-
Importing GeoJSON files to QGIS
-
Import data
-
Loading data
-
Useful links
Information
| Primary software used | QGIS |
| Software version | 1.0 |
| Course | QGIS – Importing and Loading Data |
| Primary subject | 3D Modelling |
| Secondary subject | Geospatial and Geographic Information Systems |
| Level | Intermediate |
| Last updated | November 11, 2024 |
| Keywords |
Responsible
| Faculty |
QGIS – Importing and Loading Data 0/5
QGIS – Importing and Loading Data
This section show how to import and load different types of data from various sources.
QGIS – Importing and Loading Data 1/5
Importing .CSV data using QGISlink copied
CSV, or Comma-separated value, data files are a compact form of delimited text files. These files are widely used as a main output for databases as it is readable in most applications. One of the advantages of the CSV structure is the efficient way of data storage as it just uses plain text, lines and commas making it an ideal file format for large datasets. The format can be seen as a simple version of the Excel format.

Example of .CSV file:
Studentnumber,Name,Age,Faculty,Average grade
- Jan de Vries,22,Architecture,6.1
- Maria Bovendonck,24,Physics,7.2
- Tom van Vliet,19,Computer Science,8.2
- Annabelle de Groot,20,Architecture,6.3
- Willem van Delft,22,Mechanical Engineering,7.9
Importing CSV data into QGIS
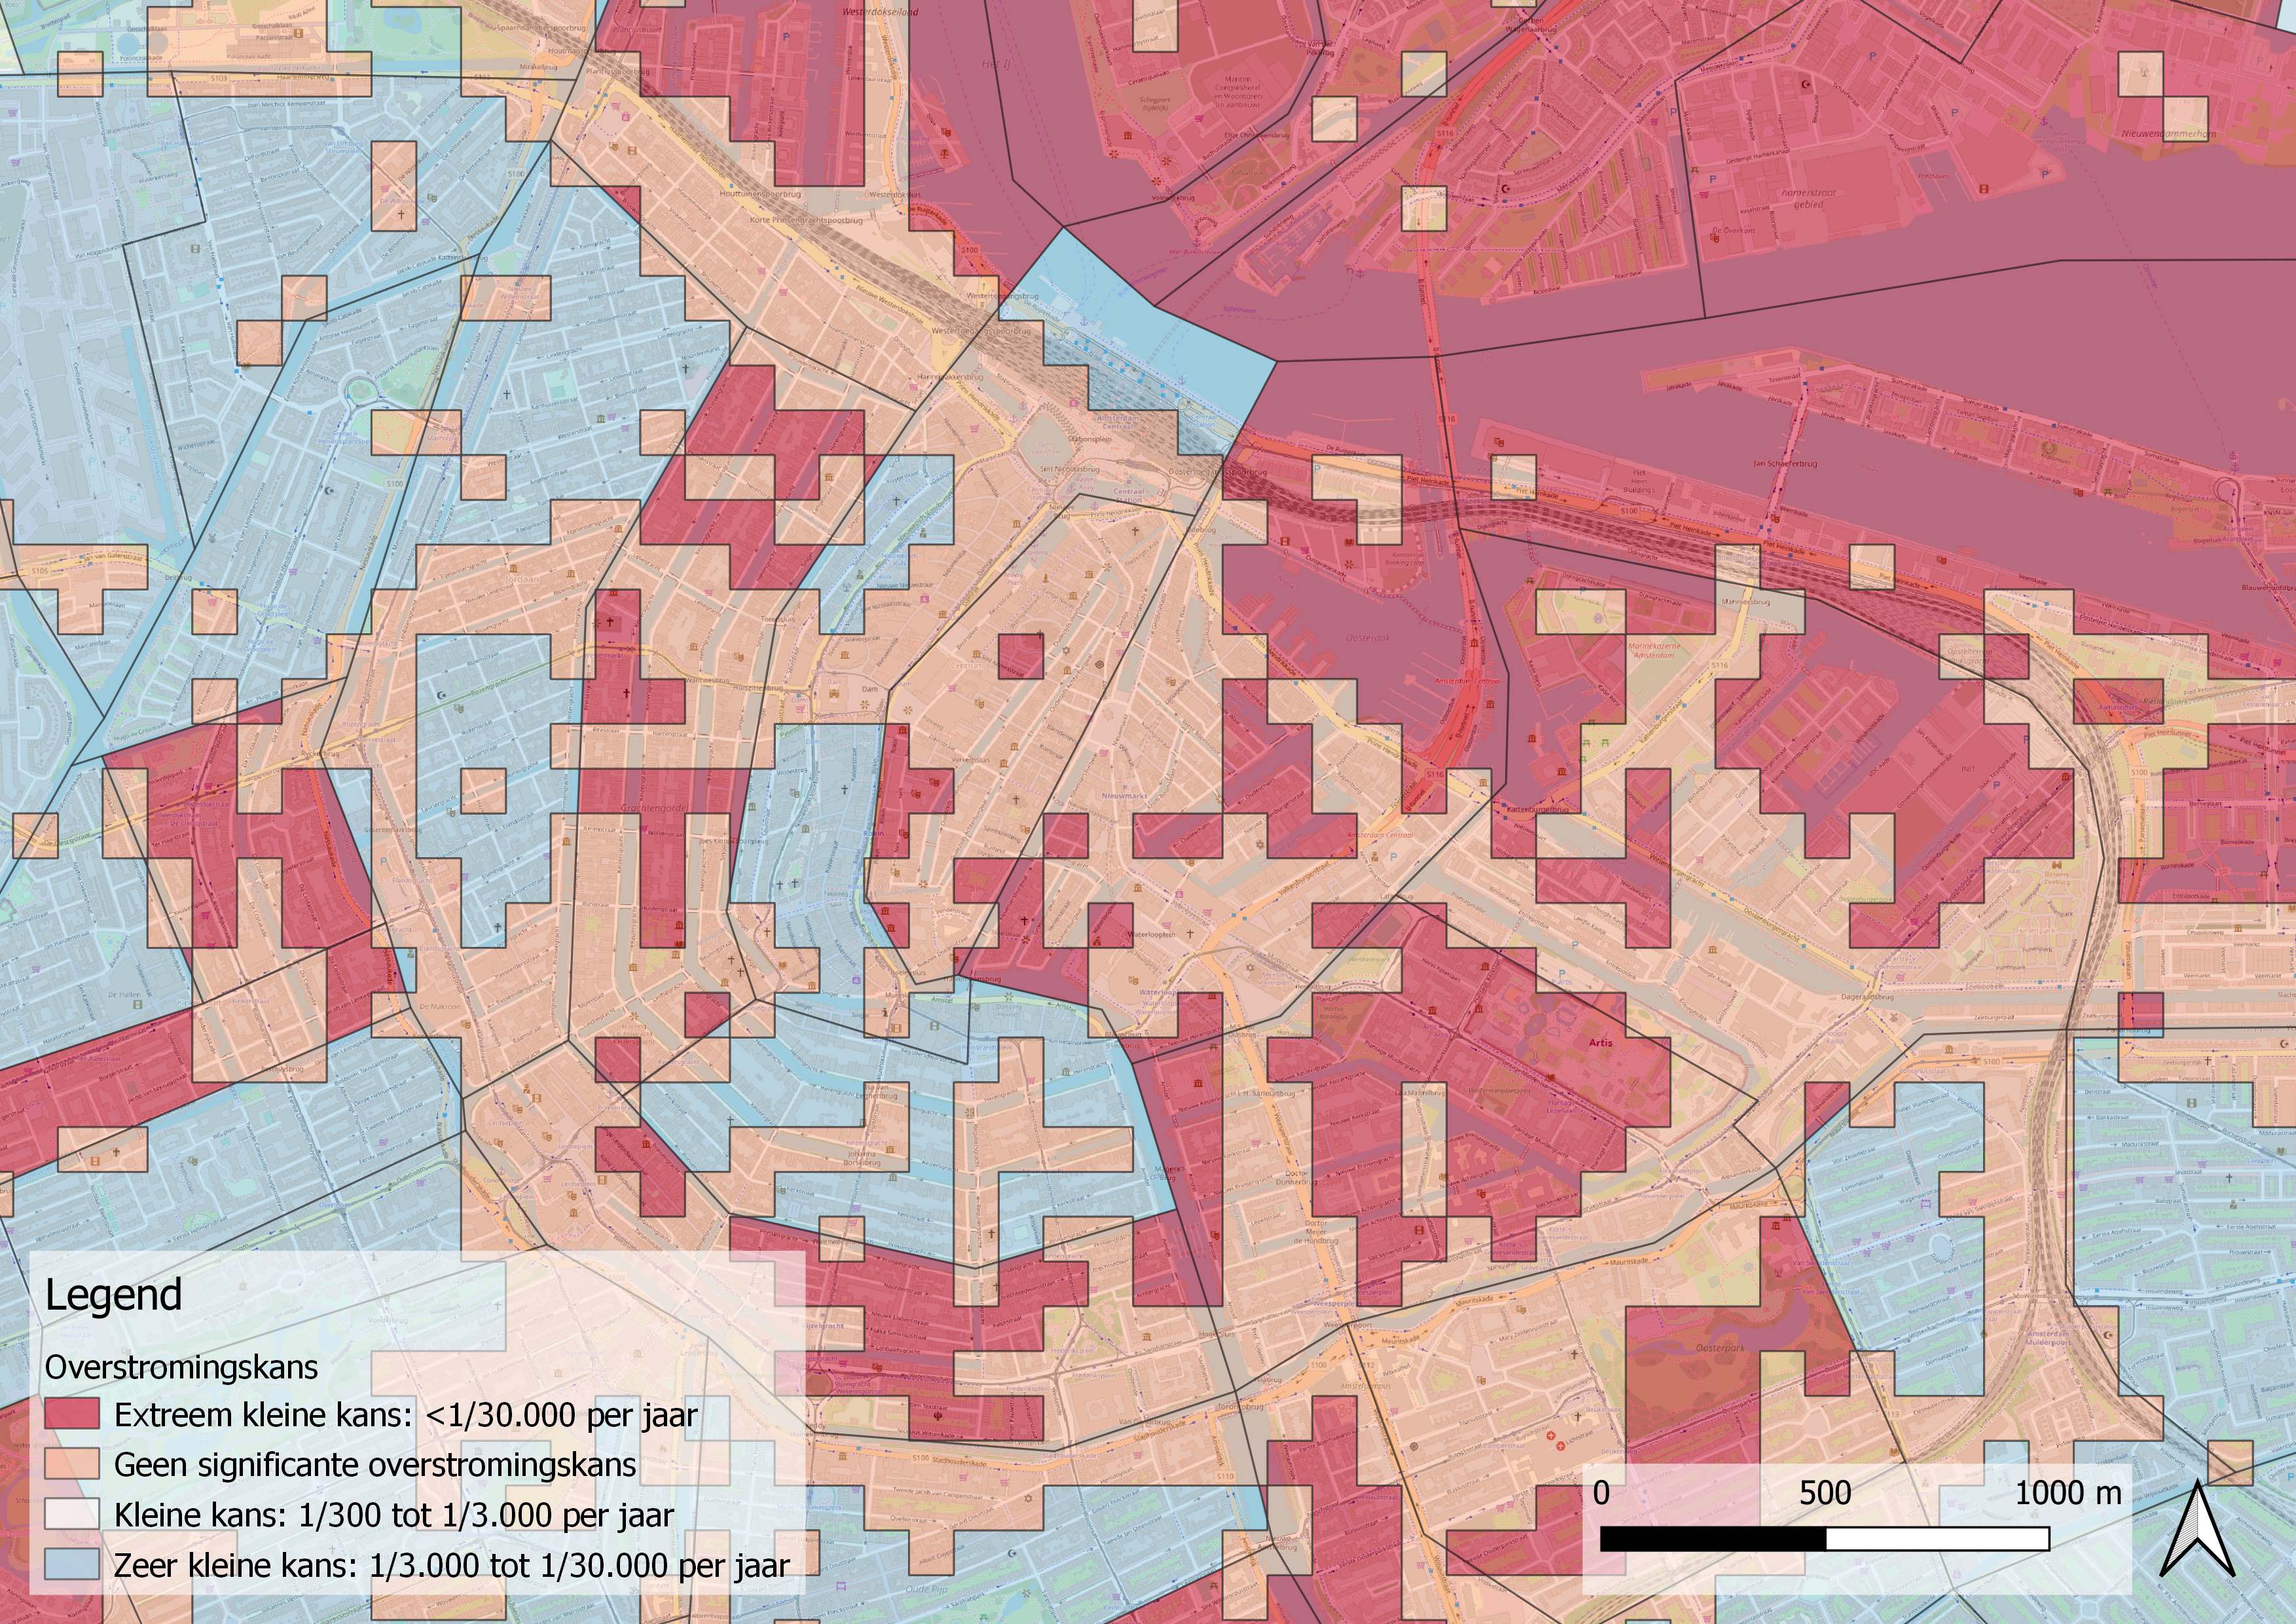
This chapter will step-by-step discuss (with the use of an example) the process of importing a .CSV dataset from the municipality of Amsterdam to QGIS. If you want to follow this step-by-step tutorial you can download the dataset (KLIMAAT_OVERSTROMING) from here
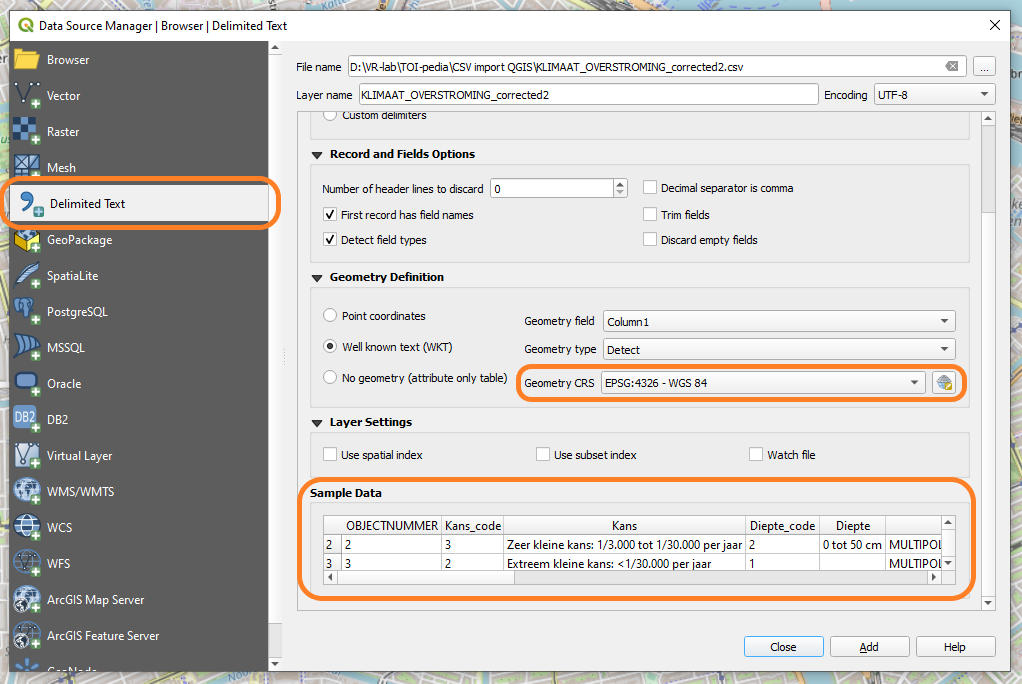
- Step 1: Open QGIS and go to your research location. In QGIS go to to the Data Source Manager found under the Layer tab and go to Delimited Text. Check if the Sample Data looks correctly (must look similar as Excel, see figure 3), if this is not the case follow step 2. Next, make sure you have selected the right Geometry CRS, most datasets mention the used coordinate system on their website or download page. Finally, add the CSV file as a layer.
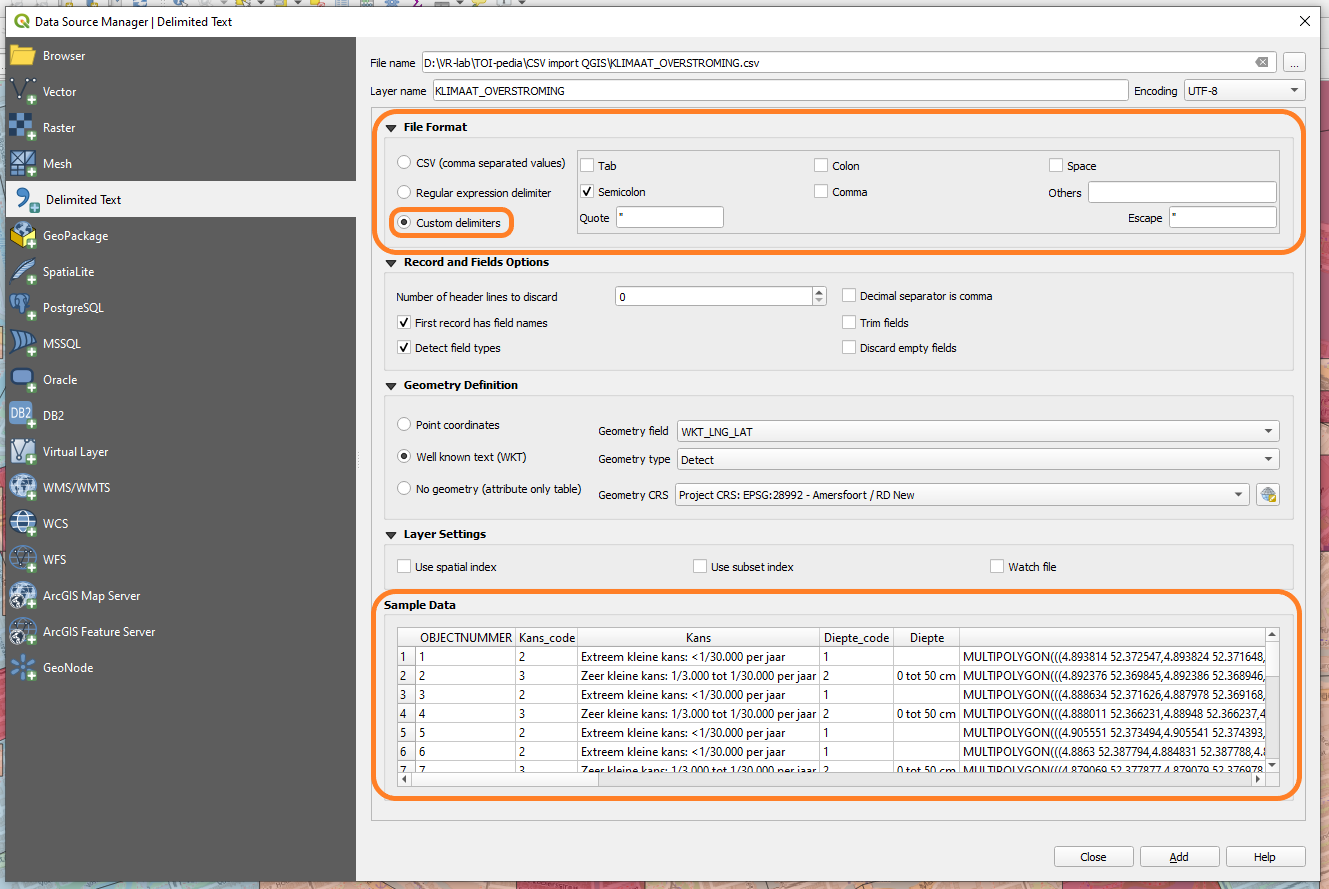
- Step 2 (optional): In some cases the .CSV file uses a different delimiter. This result in an erroneous reading for applications. Luckily QGIS has a built-in function to select the used delimiter. But first it is important to know which delimiter is used. This could be discussed at the download source or manually be checked. To check what delimiter is used, simply open your .CSV file in a text reading application like notepad (or even better notepad++) and check at which symbol is used to split the table information. Most used delimiters are: ,, ;, :, or even a space or tab. You can also directly import your file in QGIS as discussed, but use the additional import option under the File Format tab called Custom delimiters, illustrated in figure 4. As mentioned before look at the Sample Data tab to make sure your file is split correctly.
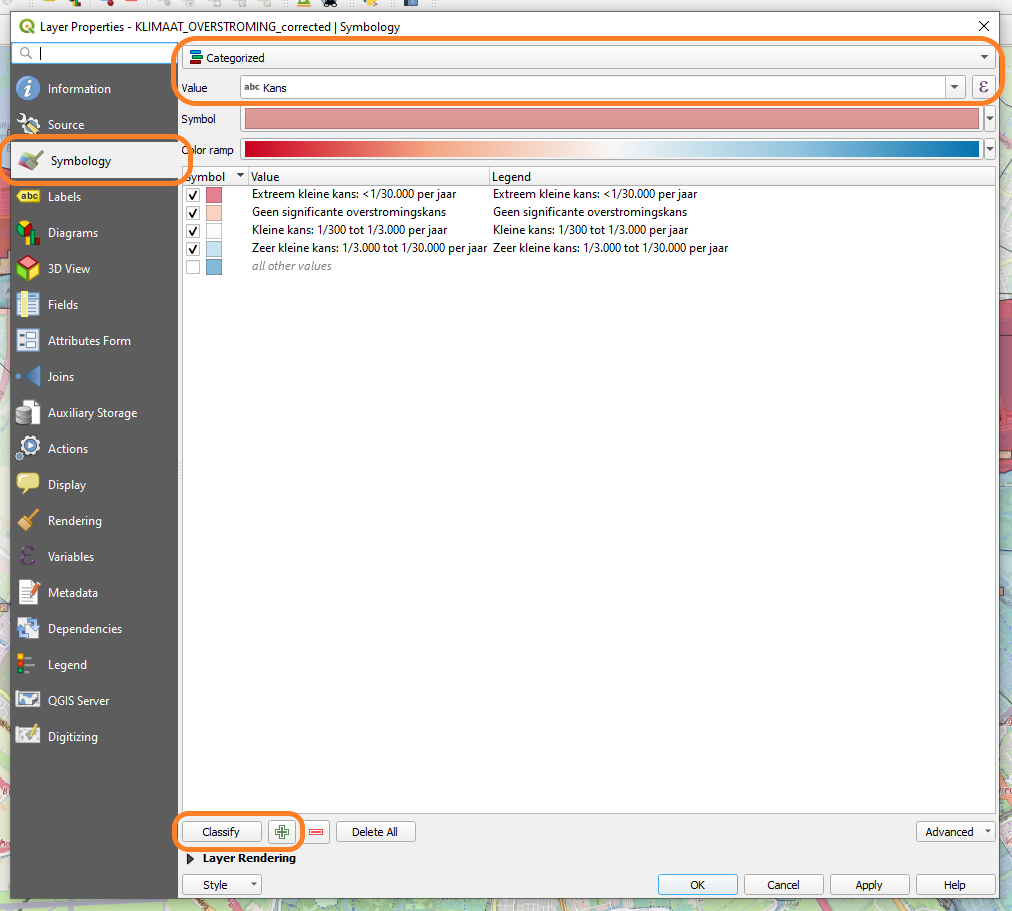
- Step 4: Edit your layer properties to make your import more readable. In this example the Symbology of the layer was changed to Categorized and classified by probability, as seen in figure 5.

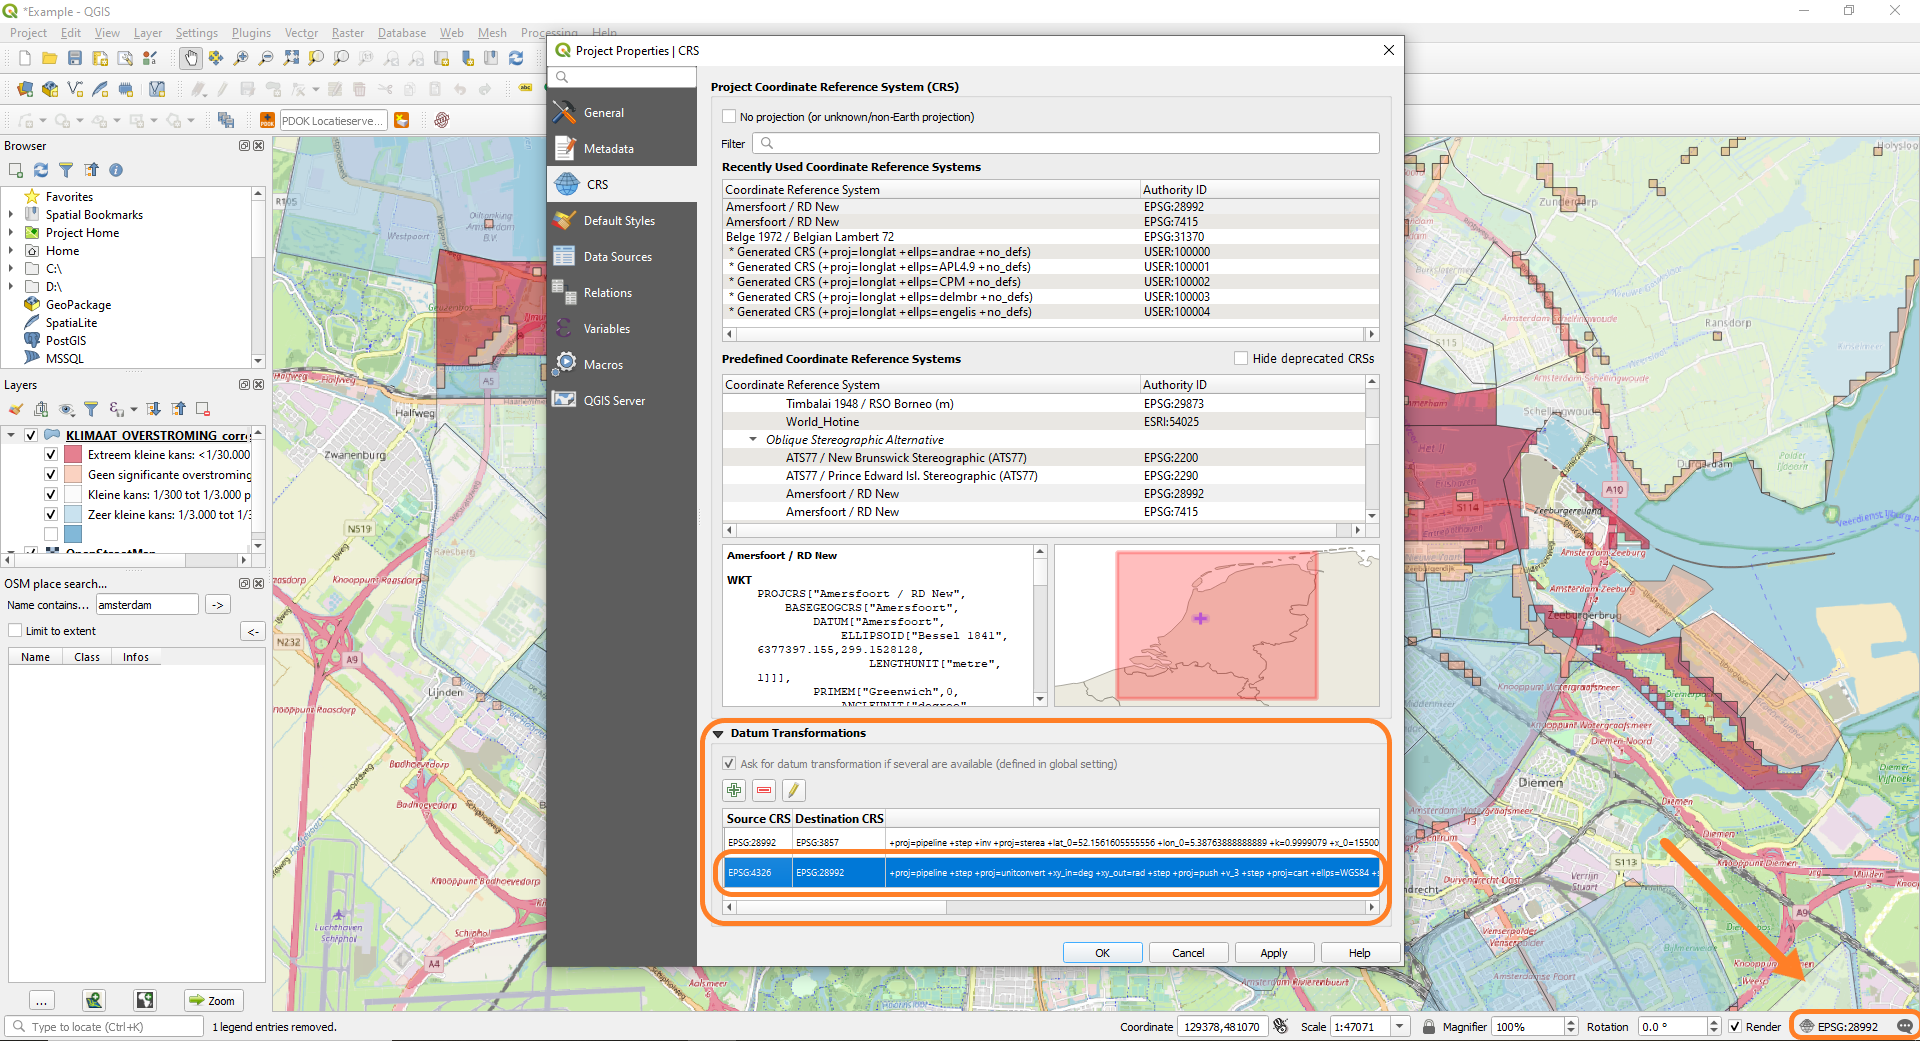
- Step 5: Check the coordinate system of the import and reproject the layer if it is not 28992 as this is the main CRS used in the Netherlands. You can reproject the layer by clicking on the globe next to the CRS number in the far right bottom of your screen, see figure 6.
Corrupted CSV files – quick fixes

- Step 1: Make sure to check if your .CSV file is correctly opening in Excel (or Apache OpenOffice [free-to-use]). If the file is correct you will see a normal Excel table as seen in figure 2. Sometimes CSV files use different separators (normally used: , or ; ) making it more difficult for applications to read the content. If the file still shows errors, like figure 7, make sure to follow the additional step described in step 2.
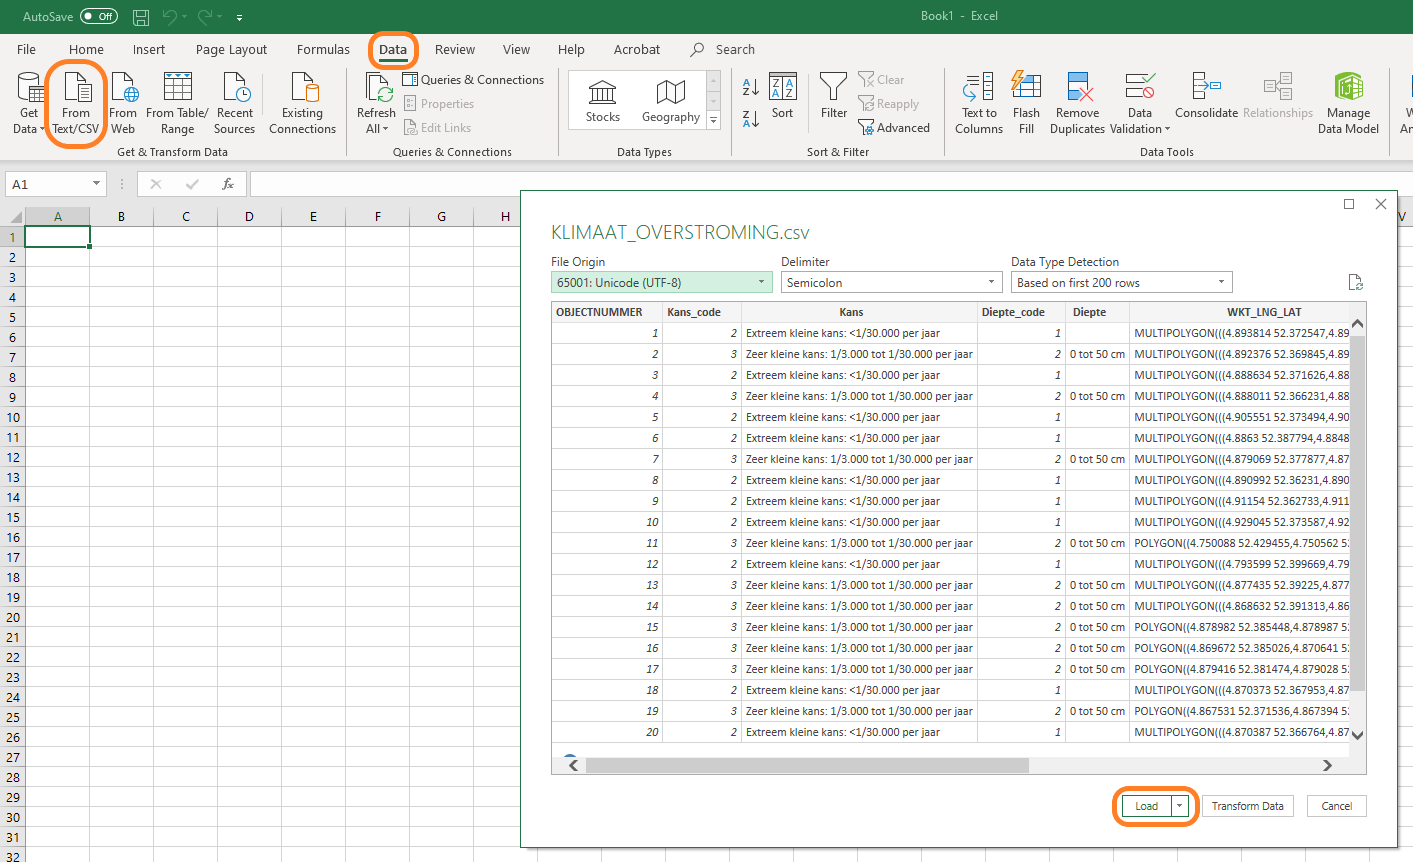
- Step 2: To convert your corrupted CSV file to a correctly formatted CSV format you need to work in Excel (or an open-source alternative). Create a new empty Excel file and go to the Data tab. Search for the From Text / CSV function to import your corrupted CSV data. As seen in figure 8, the function finds the used separator and creates a correct output table. Save the new Excel file as a .CSV (use save as function).
Other resources for CSV data
Use the data source manager to import CSV files
- Ujaval Gandhi: “Importing Spreadsheets or CSV files (QGIS3)”/ “Werkbladen of CSV-bestanden importen (QGIS3)”
you can access the english tutorial using this link
you can access the dutch tutorial using this link
Language(s): English, DutchChapters:
- overview of the task
- get the data
- procedure
Import spreadsheets, join attribute tables, edit attribute tables and interpolate points to raster
- Hans van der Kwast: “QGISHydro Webinar 2: Import tables and spatial interpolation”
you can access this videol using this link
Language(s): English
Time: 1h 5m 28s
Chapters:- start of QGISHydro Webinar 2 (start-6:51)
- introduction to demo import tables (6:51-9:55)
- start demo importing tables (9:55-10:56)
- using the Spreadsheet Layers plugin (10:56-15:49)
- export to GIS vector format (15:49-18:18)
- join attribute tables (18:18-21:00)
- remove missing data (21:00-21:50)
- convert temperature units (21:50-24:42)
- import CSV file (24:42-29:07)
- style temperature points (29:07-36:21)
- interpolation (Thiessen polygons) (36:21-39:35)
- interpolation (IDW) (39:35-43:12)
- interpretation of inteprolation results (43:12-45:46)
- result in 3D view (45:46-51:45)
- Q & A (51:45-59:19)
- shameless plugs (59:19-end)
QGIS – Importing and Loading Data 2/5
Importing GeoJSON files to QGISlink copied
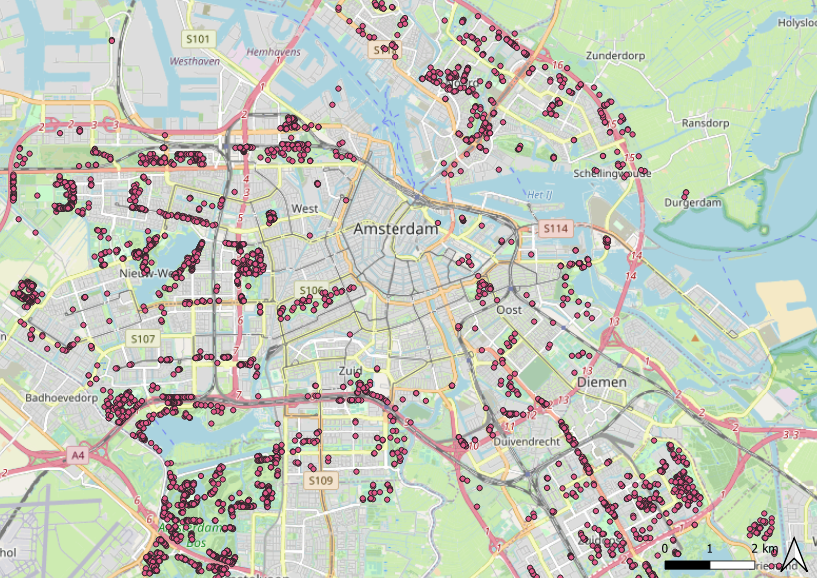
The GeoJSON file format represtents simple geographical features and linked non-spatial attributes. Just as with other formats used in QGIS it can represent, points, lines, polygons or even collections (multipart geometries).
This tutorial will cover the import process from download to importing in QGIS. To make this more clear an example will be used which can be downloaded here. Resulting in the imported layer seen in figure 1
Importing GeoJSON data into QGIS
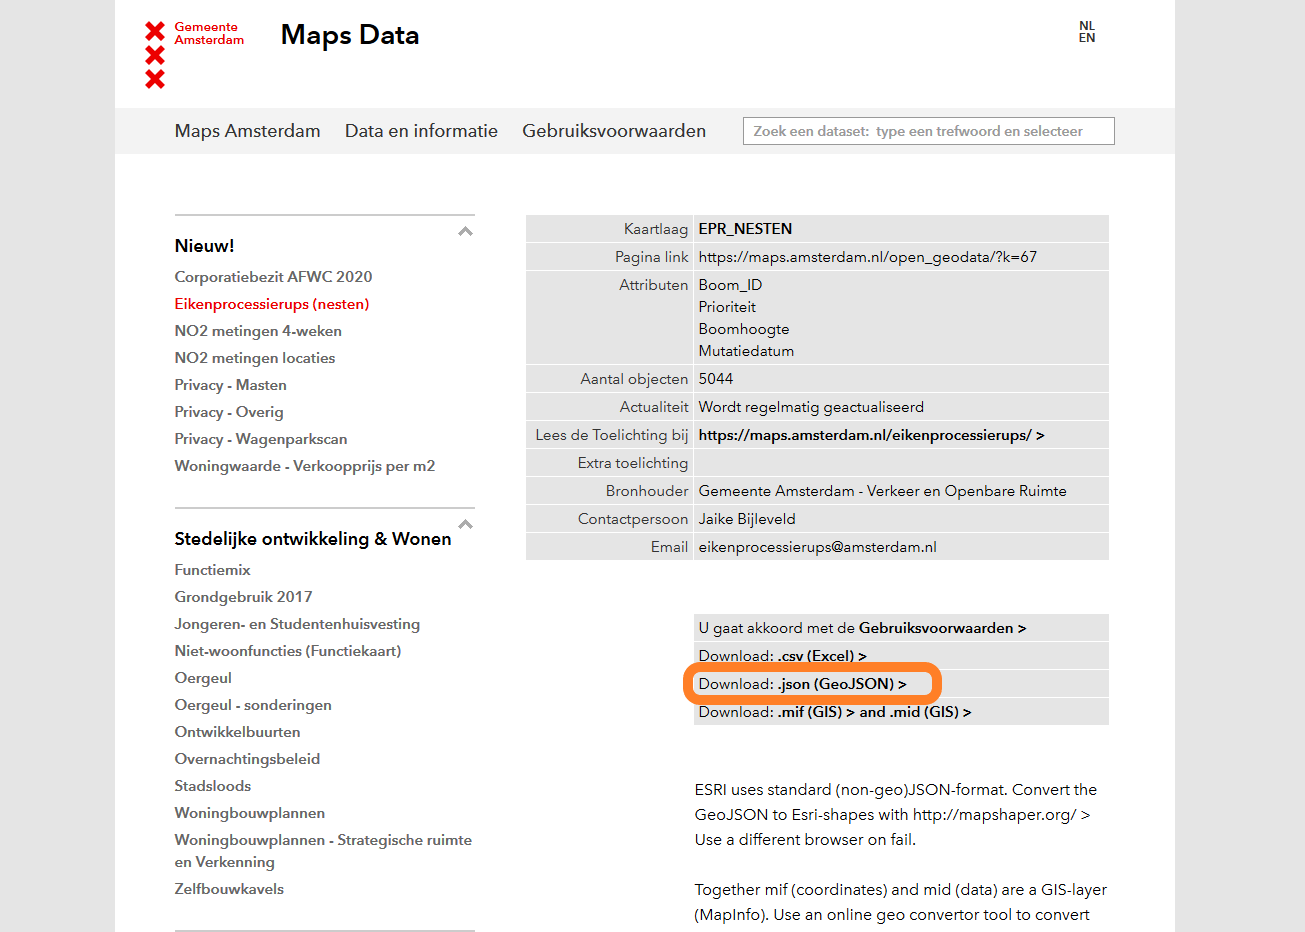
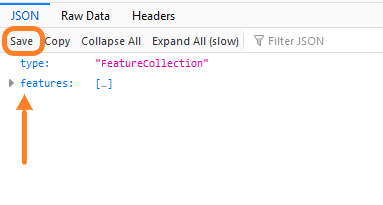
- Step 1: Download your data package (to follow the example, see figure 2), take into account that downloading a (Geo)JSON file can result in an unusual looking download page. To download the file correctly click on Save, highlighted in orange in figure 3. Make sure to give your file a good name.
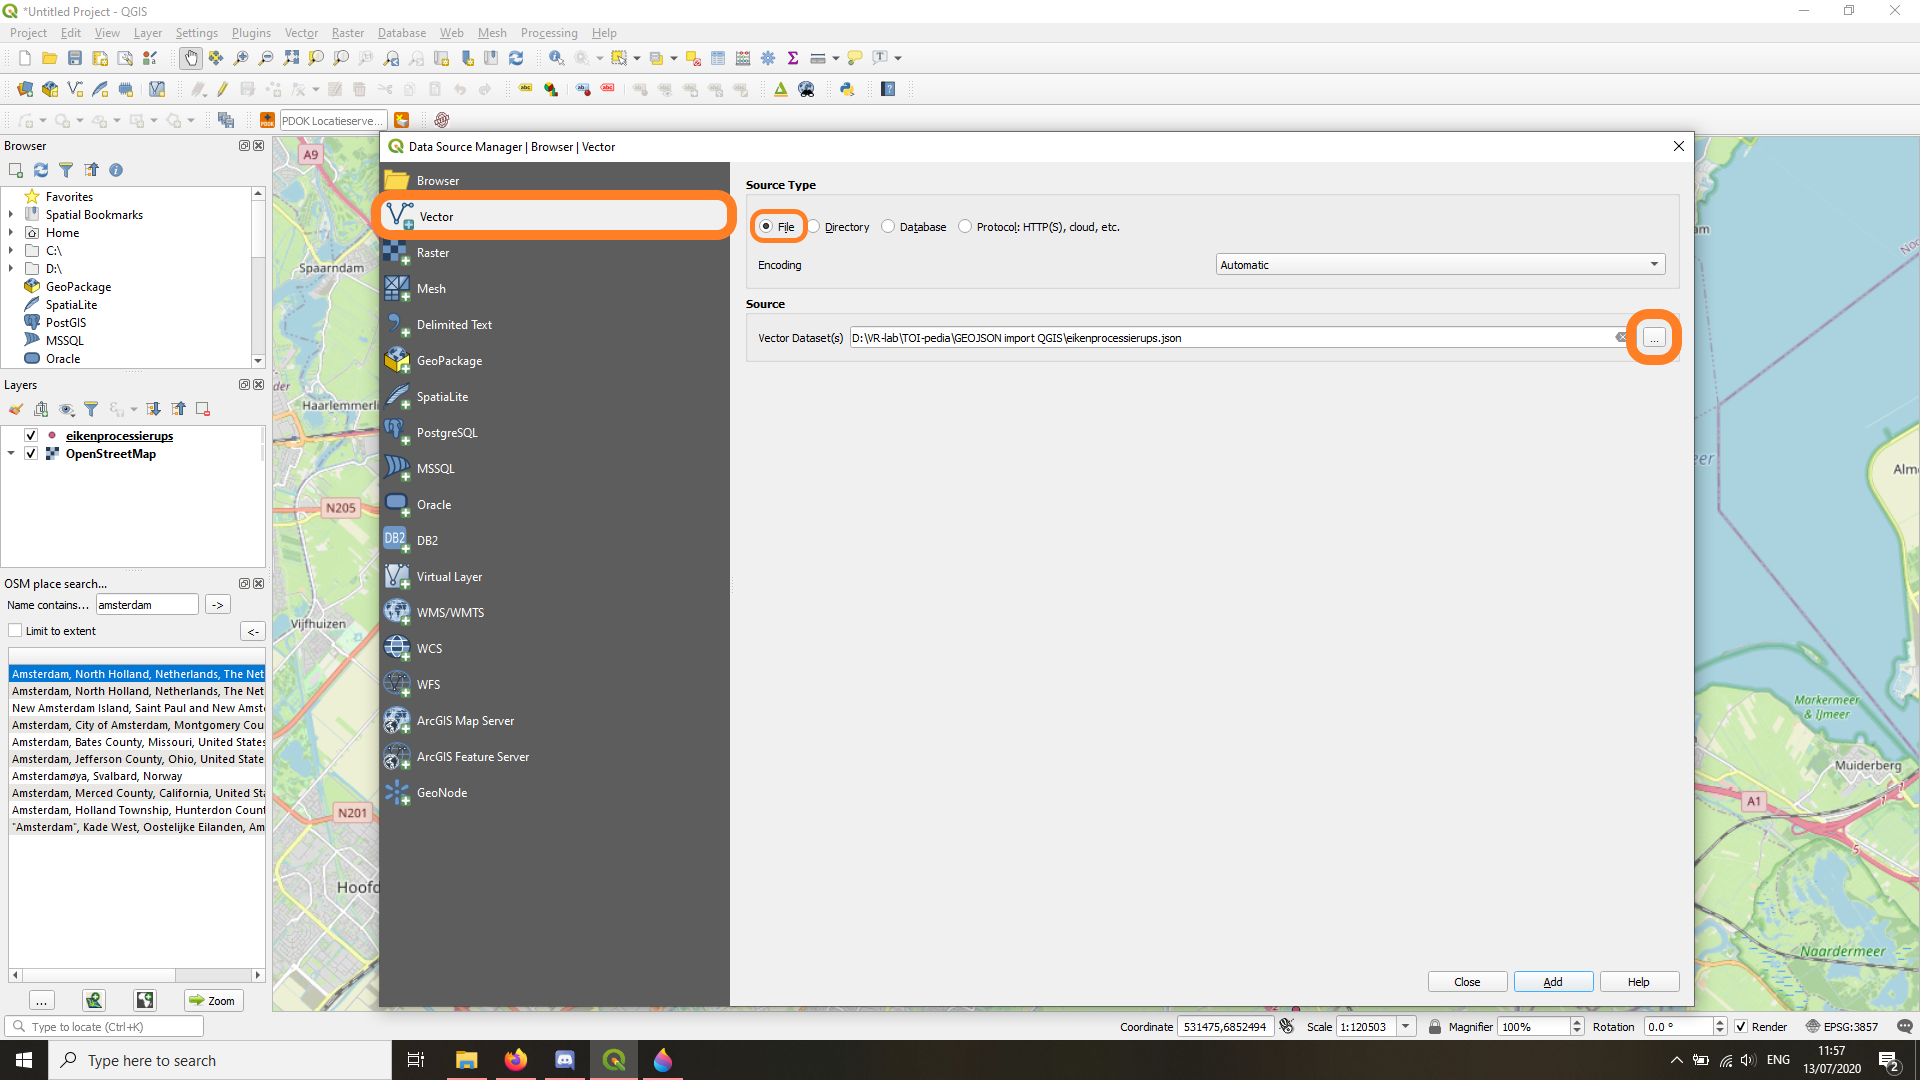
Step 2: To import your GeoJSON to QGIS, simply go to the Data Source Manager under the Layer tab. Select the Vector layer type and choose the file format. Finally locate your GeoJSON file and select it. By clicking on add a new layer is created with the GeoJSON geometries. The steps are highlighted in orange in figure 4.
Note: Always make sure you use the correct coordinate reference system.
For more information on the CRS, check the Coordinate reference systems tutorial
QGIS – Importing and Loading Data 3/5
Import datalink copied
Importing data into QGIS is done differently depending on the file format.
XLS data
An XLS file is a spreadsheet file from Excel.
Import Excel sheets with coordinates into QGIS
- Hans van der Kwast: “Importing spreadsheets into QGIS”
you can access this videol using this link
Language(s): English
Time: 4m 29s
Import spreadsheets with spatial data and without spatial data to QGIS
- Hans van der Kwast: “Import Spreadsheets in QGIS”
you can access this videol using this link
Language(s): English
Time: 4m 11s
XML data
An Extensible Markup Language (XML) file stores data in XML code.
Import XML file
- Mariëlle Geers-Plasmans (Geojuffie): “XML importeren in QGIS”
you can access this videol using this link
Language(s): English
Time: 5m 9s
GeoPackage (GPKG) data
A GeoPackage file is a SQLite database container that contains geospatial information in a compact manner.
Open files with drag and drop method
- Mariëlle Geers-Plasmans (Geojuffie): “I01 Drag and drop”
you can access this video using this link
Language(s): Dutch
Time: 4m 6s
Load files through browser
- Mariëlle Geers-Plasmans (Geojuffie): “I02 Laden via browser”
you can access this video using this link
Language(s): Dutch
Time: 3m 18s
Get started with an example map
- QGIS Training manual: “2.2. Adding your first layer”
you can access this manual using this link
Language(s): Dutch
Chapters:- follow along: prepare a map
- try yourself, follow along: loading vector data from a GeoPackage Database
- follow along: loading vector data from a SpatiaLite Database with the Browser
- try yourself load more vector data
- follow along: reordering the layers
- in conclusion
- what’s next
QGIS – Importing and Loading Data 4/5
Loading datalink copied
Loading data into QGIS can be done in various ways, depending on a file format and data source.
XLS data
An XLS file is a spreadsheet file from Excel.
Load spreadsheets into QGIS, join their attribute tables and interpolate points to a raster
- Hans van der Kwast: “Load spreadsheets in QGIS 3, join and interpolate”
you can access this video using this link
Language(s): English
Time: 14m 44s
Shuttle Radar Topography Mission (SRTM) data
Stream and catchment delineation using only Open Data (SRTM)
- Hans van der Kwast: “Stream and catchment delineation in QGIS 3”
you can access this video using this link
Language(s): English
Time: 33m 39s
Chapters:- introduction (start-0:37)
- setting up OSM (0:37-1:44)
- river war (1:44-2:35)
- catchment area (2:32-3:55)
- download (3:55-5:13)
- virtual mosaic (5:13-7:03)
- reproject (7:03-9:08)
- subset (9:08-10:33)
- fill (10:33-12:03)
- hillshade (13:30-15:43)
- strata order (15:43-16:26)
- visualisation (16:26-17:13)
- threshold (17:13-20:33)
- stream delineation (20:33-22:29)
- style flow direction (22:29-24:43)
- coordinate capture (24:43-26:48
- polygons (26:48-27:46)
- attribute table (27:46-end)
USGS Earth Explorer data
The USGS Earth Explorer allows to download aerial and satellite imagery from Landsat.
Define a search extent in USGS Earth Explorer
Hans van der Kwast: “How to select a search extent in USGS Earth Explorer”
you can access this video using this link
Language(s): English
Time: 3m 30s
Download a Sentinel 2 image from USGS Earth Explorer, use QGIS to stack the bands in a virtual raster, use the Raster calculator to calculate NDVI and reclassify the results
Hans van der Kwast: “Calculate NDVI from Sentinel 2 and reclassify in QGIS”
you can access this video using this link
Language(s): English
Time: 10min 6s
CORINE Land Cover data
CORINE stands for coordination of information on the environment and stores the land cover of Europe into 44 different land cover classes.
Download the CORINE land cover data as a GeoPackage and style it using a QLD file
- Hans van der Kwast: “Download and Style CORINE Land Cover Data in QGIS”
you can access this video using this link
Language(s): English
Time: 2m 19s
Clip the CORINE land cover vector data and reproject it to the projection of a project
- Hans van der Kwast: “Clip and Reproject CORINE Land Cover Data in QGIS”
you can access this video using this link
Language(s): English
Time: 1m 53s
Aggregate the CORINE Level 3 classes to Level 1 class using string functions in the field calculator of QGIS
- Hans van der Kwast: “Aggregate CORINE Level 3 to 1 Classes in QGIS”
you can access this video using this link
Language(s): English
Time: 3m 20s
Strava data
Strava tracks physical exercises such as running and cycling.
Save a hiking route from Strava and import that into QGIS
- Hans van der Kwast: “Import Routes from Strava to QGIS and create an Outdoor Map with the MapTiler Plugin”
you can access this video using this link
Time: 8m 6s
Language(s): English
Chapters: - intro (start-0:25)
- export a route from Strava (0:25-0:45)
- go to the Strava website (0:45-2:30)
- create an outdoor map (2:30-3:30)
- layer styling (3:30-4:10)
- export to UTM (4:10-5:30)
- add a color ramp (5:30-6:30)
- final touches (6:30-end)
3D BAG data
The 3D BAG data contains 3D building models of the Netherlands.
Load data from the 3D BAG download both from GPKG and CityJSON
- Erik Meerburg (3D geoinformation research group): “Using 3D BAG in QGIS 1: an introduction”
you can access this video using this link
Language(s): English
Time: 8m 40sChapters:
- introduction (start-0:38)
- viewer (0:38-1:37)
- GeoPackage (1:37-5:49)
- visualisation (5:49-end)
How to use data from data services
- Erik Meerburg (3D geoinformation research group): “Urbanism GIS Course 4: Adding data from services”
you can access this video using this link
Language(s): English
Time: 8m 56s
Chapters:- intro (start-0:15)
- OpenTopo Background map (0:15-1:04)
- WebMap Services (1:04-2:17)
- adding your own service (2:17-4:15)
- documentation (6:08-6:34)
- finding data (6:34-end)
Building data: debug data, visualize, graduated vizualization, export to Rhino
- Erik Meerburg (3D geoinformation research group): “Urbanism GIS Course 10: Using the BAG”
you can access this video using this link
Language(s): English
Time: 10m 24s
Download BAG buildings in QGIS
- Erik Meerburg (Geogoeroe): “BAG panden naar QGIS downloaden”
you can access this video using this link
Language(s): Dutch
Time: 5min 55s
Load BAG data using the WFS service
- Erik Meerburg (Geogoeroe): “3D BAG panden in QGIS”
you can access this video using this link
Language(s): Dutch
Time: 3min 8s
Actueel Hoogtebestand Nederland (AHN) data
AHN contains the elevation data of the Netherlands.
Use AHN data, Arcgis data and 3D data
- Erik Meerburg (3D geoinformation research group): “Urbanism GIS Course 11: Using AHN”
you can access this video using this link
Language(s): English
Time: 10m 59sChapters:
- introduction (start-1:12)
- using AHN data (1:12-4:47)
- using ArcGIS data (4:47-7:18)
- using 3D data (7:18-end)
Add highest and average building heights, using AHN3, and visualise the data in QGIS
- Erik Meerburg (Geogoeroe): “AHN3 downloaden en huizen op hoogte brengen”
you can access this video using this link
Language(s): Dutch
Time: 9min 43s
Basisregistratie Grootschalige Topografie (BGT)
BGT is a map on which buildings, roads, water and vegetation are placed.
Import and use BGT
- Erik Meerburg (3D geoinformation research group): “Urbanism GIS Course 12: Using the BGT”
you can access this video using this link
Language(s): English
Time: 8m 26s
Download BGT data
- Erik Meerburg (Geogoeroe): “BGT in QGIS downloaden”
you can access this video using this link
Language(s): Dutch
Time: 4min 44s
Import BGT data
- Erik Meerburg (Geogoeroe): “BGT import in QGIS”
you can access this video using this link
Language(s): Dutch
Time: 8min 1s
Approximate road width
- Erik Meerburg (Geogoeroe): “Wegbreedtes uit de BGT benaderen”
you can access this video using this link
Language(s): Dutch
Time: 12min 18s
Landelijk Informatiesysteem van Arbeidsplaatsen (LISA) data
LISA maps all the establishments with gainful employments of the Netherlands.
Import and use LISA data
- Erik Meerburg (3D geoinformation research group): “Urbanism GIS Course 13: Using LISA data”
you can access this video using this link
Language(s): English
Time: 11m 1sChapters:
- introduction (start-1:40)
- LISA data (1:40-5:20)
- Delft (5:20-end)
WaPOR data
WaPOR stands for Water Productivity through Open access of Remotely sensed derived data and contains data of agricultural water productivity over Afrika and Near East.
Use WaPOR data using OGC services (WMS, WCS)
- Hans van der Kwast: “How to use FAO WaPOR open data via web services in QGIS?”
you can access this video using this link
Language(s): English
Time: 14min 45s
GeoWeb data
Rijkswaterstaat provides geographic datasets such as archaeological terrain, bathymetry, river management or monuments.
Load GeoWeb data with services
- Erik Meerburg (Geogoeroe): “In GeoWeb data vinden en die in QGIS gebruiken”
you can access this video using this link
Language(s): Dutch
Time: 9min 15s
Nationaal wegenbestand (NWB)
The NWB contains road data of the Netherlands.
Filter national roads from the WFS service of NWB (Nationaal wegen bestand)
- Erik Meerburg (Geogoeroe): “Alleen rijkswegen uit het NWB”
you can access this video using this link
Language(s): Dutch
Time: 2min 16s
Nationaal Georegister
The nationaal georegister contains a lot of geographic data of the Netherlands.
Import CSV with coordinates from the Nationaal Georegister
Erik Meerburg (Geogoeroe): “Data vinden en als csv in QGIS laden”
you can access this video using this link
Language(s): Dutch
Time: 6min 28s
Open street map data
for more information on open street map data you can check the following tutorial
QGIS – Importing and Loading Data 5/5
Useful linkslink copied
- QGIS Training Manual
- QGIS User Guide
- Shuttle Radar Topography Mission (SRTM) website
- USGS Earth Explorer website
- Corine land cover data download
- 3D BAG viewer
- Actueel Hoogtebestand Nederland (AHN) website
- Landelijk Informatiesysteem van Arbeidsplaatsen (LISA) website
- OpenStreetMap website
- WaPOR data
- GeoWeb data
- Nationaal wegenbestand (NWB) website
- Nationaal Georegister website
- GIS OpenCourseWare
- Ujaval Gandhi (QGIS Tutorials and Tips website)
- Hans van der Kwast YouTube channel
- Mariëlle Geers-Plasmans (Geojuffie) YouTube channel
- Erik Meerburg (3D geoinformation research group) YouTube channel
- Erik Meerburg (Geogoeroe) YouTube channel
Related tutorials
Follow-up tutorial
Write your feedback.
Write your feedback on "QGIS – Importing and Loading Data"".
If you're providing a specific feedback to a part of the chapter, mention which part (text, image, or video) that you have specific feedback for."Thank your for your feedback.
Your feedback has been submitted successfully and is now awaiting review. We appreciate your input and will ensure it aligns with our guidelines before it’s published.
