Generating a Dataset in Grasshopper
-
Intro
-
Design
-
Video: Room Set Up, Daylight Analysis, Assigning Labels, and Exporting
-
Parametric Room Model: Create room geometry
-
Parametric Room Model: Windows and Shading
-
Parametric Room Model: Organize Final Geometries
-
HB Daylight Analysis: Import the Weather Data
-
HB Daylight Analysis: Create Honeybee model of the room
-
HB Daylight Analysis: Materials and Sensor Grid
-
HB Annual Daylight Simulation
-
Assigning Room Labels
-
Recording Grasshopper Data with Colibri
-
Colibri: Select Design Variables
-
Colibri: Export Data
-
Conclusion and Download Files
Information
| Primary software used | Grasshopper |
| Course | Computational Intelligence for Integrated Design |
| Primary subject | AI & ML |
| Secondary subject | Machine Learning |
| Level | Intermediate |
| Last updated | November 27, 2024 |
| Keywords |
Responsible
| Teachers | |
| Faculty |
Generating a Dataset in Grasshopper 0/14
Generating a Dataset in Grasshopper
In this tutorial you will learn how to create a data set in Grasshopper and save it as a CSV file. The data set will be of room types based on their characteristic dimensions and the daylight simulation result data. After creating this CSV file (data set), you can use it to train a ML model, for example by importing it to a Jupyter notebook.
First, you will set up a parametric room in Grasshopper with variables that lead to numerous variations. Then, you will perform a Daylight Analysis to gather data about each room variation. Finally, you will learn how to export all gathered data into a CSV file (can also be opened in Excel) with a format that can be used to train a ML model in Jupyter notebook.
Generating a Dataset in Grasshopper 1/14
Designlink copied
Imagine that TU Delft would like to determine how it should assign room functions based on features of the space using machine learning.
The university has described that they have a series of rooms that are a variable depth of 6-10 meters, 4 meters high, and 6 meters wide. Each room has a window on the shorter south side which is located 1 meter above the floor and varies in width between 1 meter and 5 meters in 0.5-meter increments, and in height between 1 meter and 2 meters. Additionally, some rooms have shading. The exterior shading is horizontal shading that covers the entire width of the window but varies in depth between 0 meters and 1 meter in 0.5-meter increments. Please refer to table 1 for the design parameters of the room and to table 2 for the design variables mentioned above.
Table 1: design parameters
|
Design parameter |
Fixed value |
|
Location |
Rotterdam |
|
Nr of windows |
1 |
|
Room width |
6 m |
|
Room height |
4 m |
|
Façade side |
South |
|
Nr of windows |
1 |
|
Window sill |
1 m |
Table 2: design variables
|
Design variable |
Range |
Increments |
|
Room depth |
6-10 m |
1 m |
|
Window width |
1-5 m |
0.5 m |
|
Window height |
1-2 m |
1 m |
|
Overhang depth |
0-1 m |
0.5 m |
Based on these variations in rooms the university would like to assign one of three functions to each space: office, computer lab, storage. The requirements of the room types are listed in the table below. If the room meets neither of the above-mentioned requirements, then it can be assigned as storage space.
Note: The requirements stated below do not correspond to existing building guidelines. They are curated for the needs of this specific exercise to create a diverse data set.
Table 3: Room type requirements
|
Room type |
Daylight (UDI) For 50% room area at all time |
Glare (UDI up) For 50% room area at all time |
Overhang depth [m] |
Area [m2] |
|
Office |
30% – 100% Label 1 or 2 |
0% – 2% Label 1 |
> 0 |
– |
|
Computer lab |
60% – 100% Label 1 |
2% – 10% Label 2 |
– |
> 42 |
|
Storage |
– |
– |
– |
– |
The university knows the performance requirements of each room, but they do not know how the spaces actually perform in terms of daylight and glare. It is too costly to run a simulation for each room that the university has, therefore they would like to train a machine learning model to predict what function should be assigned to the room based on information that they do have about the room.
The university knows:
- The area of the room
- The width to depth ratio of the room
- The window to wall ratio of the room
- The depth of the shading
Using the above-mentioned features, we need to train a machine learning model to predict the function that the university should assign to each room. To do this, we will put together a parametric model in grasshopper to gather data about the daylight, glare, and room features which will be exported into a CSV file (can also be opened in Excel).
Generating a Dataset in Grasshopper 2/14
Video: Room Set Up, Daylight Analysis, Assigning Labels, and Exportinglink copied
The video shows how to set up a room in Grasshopper, analyse it, and export the data. The steps are slightly different to the text tutorials which follows. The text tutorial uses Colibri instead to record data from Grasshopper and save it to a CSV file.

Generating a Dataset in Grasshopper 3/14
Parametric Room Model: Create room geometrylink copied
The first step to creating our data set in grasshopper is to set up our parametric room model.
Room
First create the room. For the floor plan variations:
- Create a Rectangle component.
- Create a Panel component to set the room width to 6m. Connect it to the X size of the Rectangle component.
- Create a Number Slider component to determine the depth of the room varying from 6-10m. Connect it to the Y size of the Rectangle component.
- Create a Surface component. Connect it to the rectangle output to create the floor face.
Ceiling
For the ceiling:
- Create a Offset Surface component. Connect the floor surface created before to the surface input to create a duplicate surface for the ceiling face.
- Create a Panel component to set the room height to 4m. Connect it to the distance input of the Offset Surface component.
Walls
After you create the walls, you need to make sure that you separate the faces to input them correctly to the HB room faces later. For the walls:
- Create a Extrude component. Connect the rectangle output of the Rectangle component to the base input.
- Create a Unit Z component. connect the factor input to the panel of the height of the room and the unit vector output to the direction input of the Extrude component.
- Create a Surface » Analysis » Deconstruct Brep component. Connect it to the extrusion output.
- Create a List Item component. Connect the list input to the output of the Deconstruct Brep component. Add 4 output sources to the component, 1 for each wall.
- Create 4 Surface components and connect them to the 4 outputs of the List Item component, 1 for each wall.
Window Start
For the south wall where the window with shading will be placed, we want to extract the bottom line of the wall to use later for the window. To do that:
- Create a List Item component and a Params » Geometry » Line component. Connect the Edges output of the Deconstruct Brep component to the list input of the List Item and the Line component to the ioutput of the List Item to get the curves of the south wall.

Generating a Dataset in Grasshopper 4/14
Parametric Room Model: Windows and Shadinglink copied
Next step is to create the opening. The window has variable sizes both in height and width. To create all window variations:
- Create a Rectangle component.
- Create 2 Number Slider component to determine the width and height of the window respectively. The width dimension varies between 1-5m with 0.5 m increments. Connect it to the X size of the Rectangle component. The height dimension varies between 1-2m. Connect it to the Y size of the Rectangle component.
- To find the starting point of the window parametrically create a Expression component, add three variable inputs of ‘x’, ‘y’ and ‘z’ and write the expression ‘(x/2)+y-(z/2) ‘.
- Create 2 Unit X components and a Unit Z component. Connect the first Unit X components to ‘x’ input of the Expression and to the ‘room width’ data. Connect the second Unit X to the ‘z’ input and to the ‘window width’ data.
- Create a Panel component to set the window sill to ‘1’ m and connect it to the Unit Z component. Then connect the Unit Z to the ‘y’ input of the Expression.
- Create a XZ Plane component. Connect it to the Plane input of the Rectangle component. Connect its input to the Expression result.

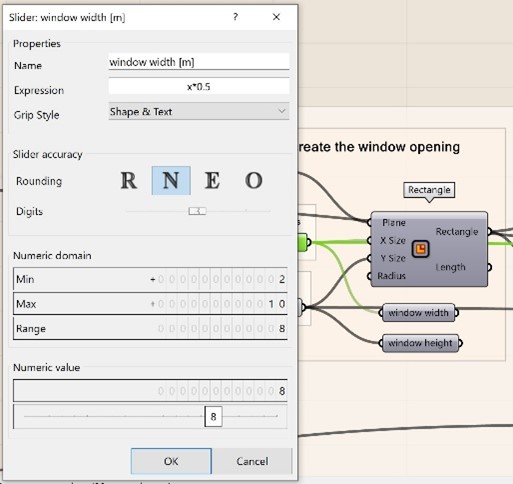
To set the 0.5m increments to the number slider, double click on the slider and write in the Expression line x*0.5. Then, set the Min and Max values of the number slider to double the amount of what you want the min and max values to be. In this way, each time the slider will divide the numbers in half and you are able to get the values of the half meters.

Next, we need to create the overhang on top of the window for shading.
- Create a Explode component. Connect the ‘curve’ input to the ‘rectangle’ output of the Rectangle component.
- Create a List Item component and a Number Slider component. Connect the segments output of the Explode component to the list input of the List Item and the number slider to the index input. Set the number slider to 2 in this example to select the upper line of the window.
- Create a Extrude component. Connect the output of the List Item component to the base input.
- Create a Unit Y component and connect it to the ‘direction’ input of the Extrude.
- Create a Number Slider component. Set it between the numbers 0,0.5 and 1m to set the different variations of the overhang depth. Do this by adding the expression ‘x*0.5’. Connect it to the Unit Y component.
Generating a Dataset in Grasshopper 5/14
Parametric Room Model: Organize Final Geometrieslink copied
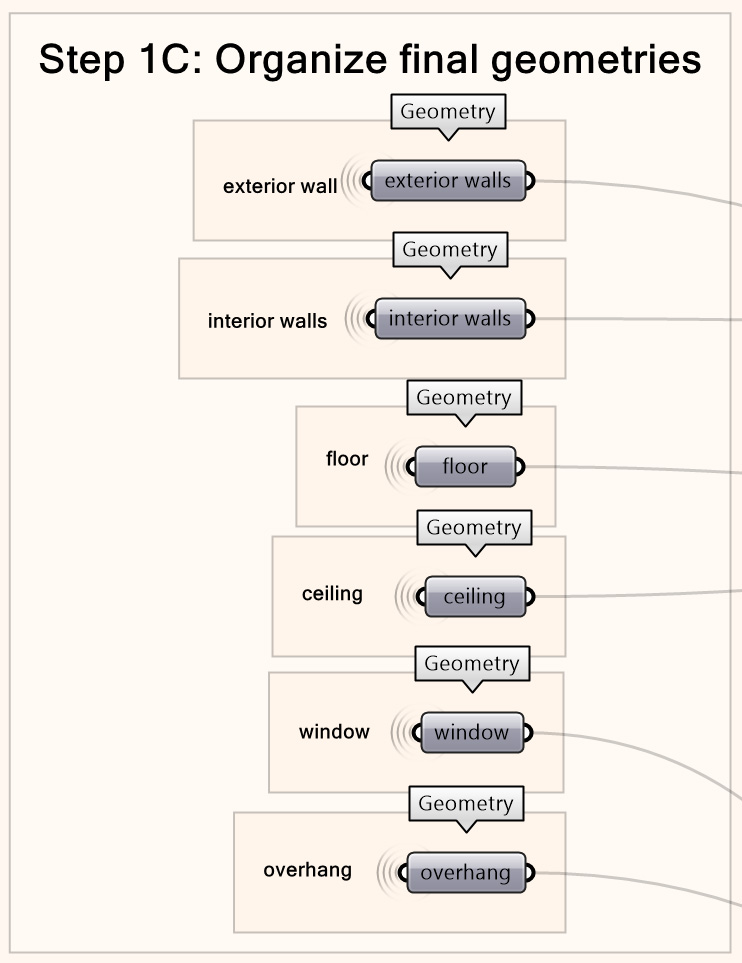
As a final step to the parametric room creation with the variable configurations, it is important to organize all the faces to use them correctly for the Honeybee room model and the Daylight simulation. To do that:
- Create 6 Geometry components. Connect all the correct faces that correspond to the following surfaces: exterior wall (south wall with the opening), interior walls, floor, ceiling, window, overhang.
Generating a Dataset in Grasshopper 6/14
HB Daylight Analysis: Import the Weather Datalink copied
After you have created the part of the code for all room variations, it is time to analyse the rooms with Ladybug by performing a Daylight Analysis. The values of these simulations will be used to determine the function of each room. This tutorial goes quickly over the simulation set-up, as it is explained in detailed in other tutorials, referenced later.
Import the Weather Data
You can import and extract the respective EPW weather data. Check the quality of the EPW file and extract data for a specific time in the WEA object by following the steps in the Importing weather files in Ladybug tutorial.
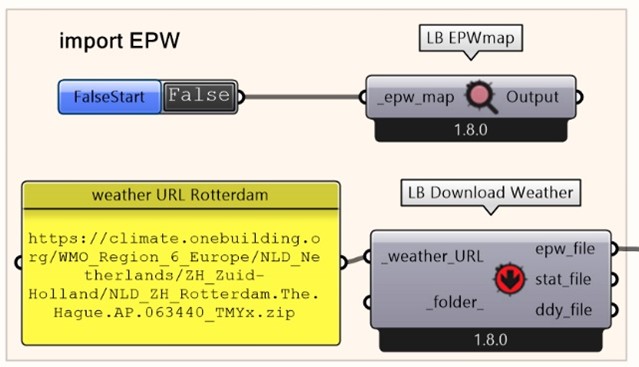
Following these steps (and selecting the Rotterdam weather data in the EPW map), you should have the components as shown in the image. It is important to make sure that the EPW file we are using is of good quality and does not miss any data.
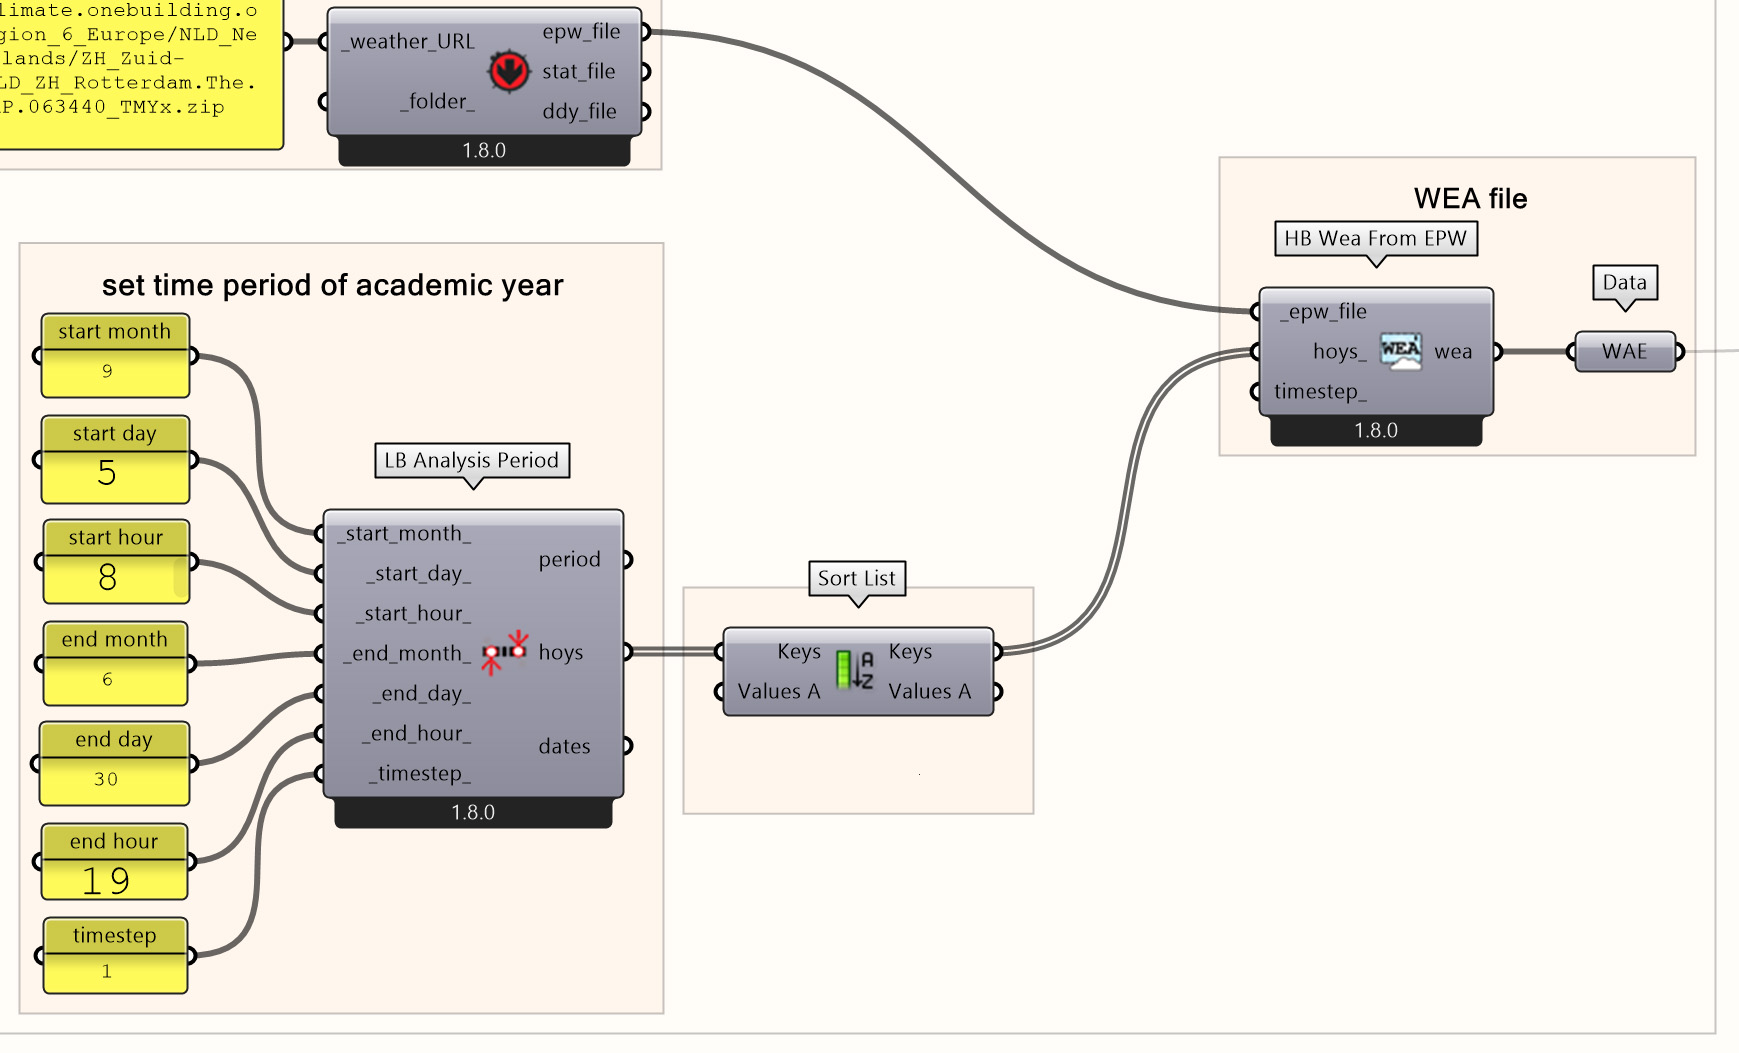
To use the weather file in the simulation, the EPW file should be converted to a WEA object. For this example, we will set the time-period to the length of the academic year since that is when the rooms of the university will be occupied. This is the time-period we will then use for the Daylight Simulation. The analysis period (the academic year) considered, is from 5th of September until the 30th of June, from 8:00 am until 19:00 pm. The analysis is set with a timestep of 1, which means it will extract data for every 1 hour. This time step was selected to balance having an accurate analysis with reducing computational time required to compute the analysis. Because our time period is from September until June, the hoys component outputs the list in this order, however the WEA component expects the hours of the year to be listed from earliest day to latest day, therefore we need to sort the output list to not cause an error in the WEA component.
Generating a Dataset in Grasshopper 7/14
HB Daylight Analysis: Create Honeybee model of the roomlink copied
To be able to perform the Daylight simulation you first need to add all the created faces to the correct Honeybee face components and compose the Honeybee room model. This part has been explained and produced in the tutorial “Honeybee model set-up”. If you need more information please refer to that tutorial.
The first step is to compose the HB room by creating correctly all the HB faces. Then select, the façade wall and correctly connect to it the window opening and shading as explained in the “Honeybee model set-up” tutorial.
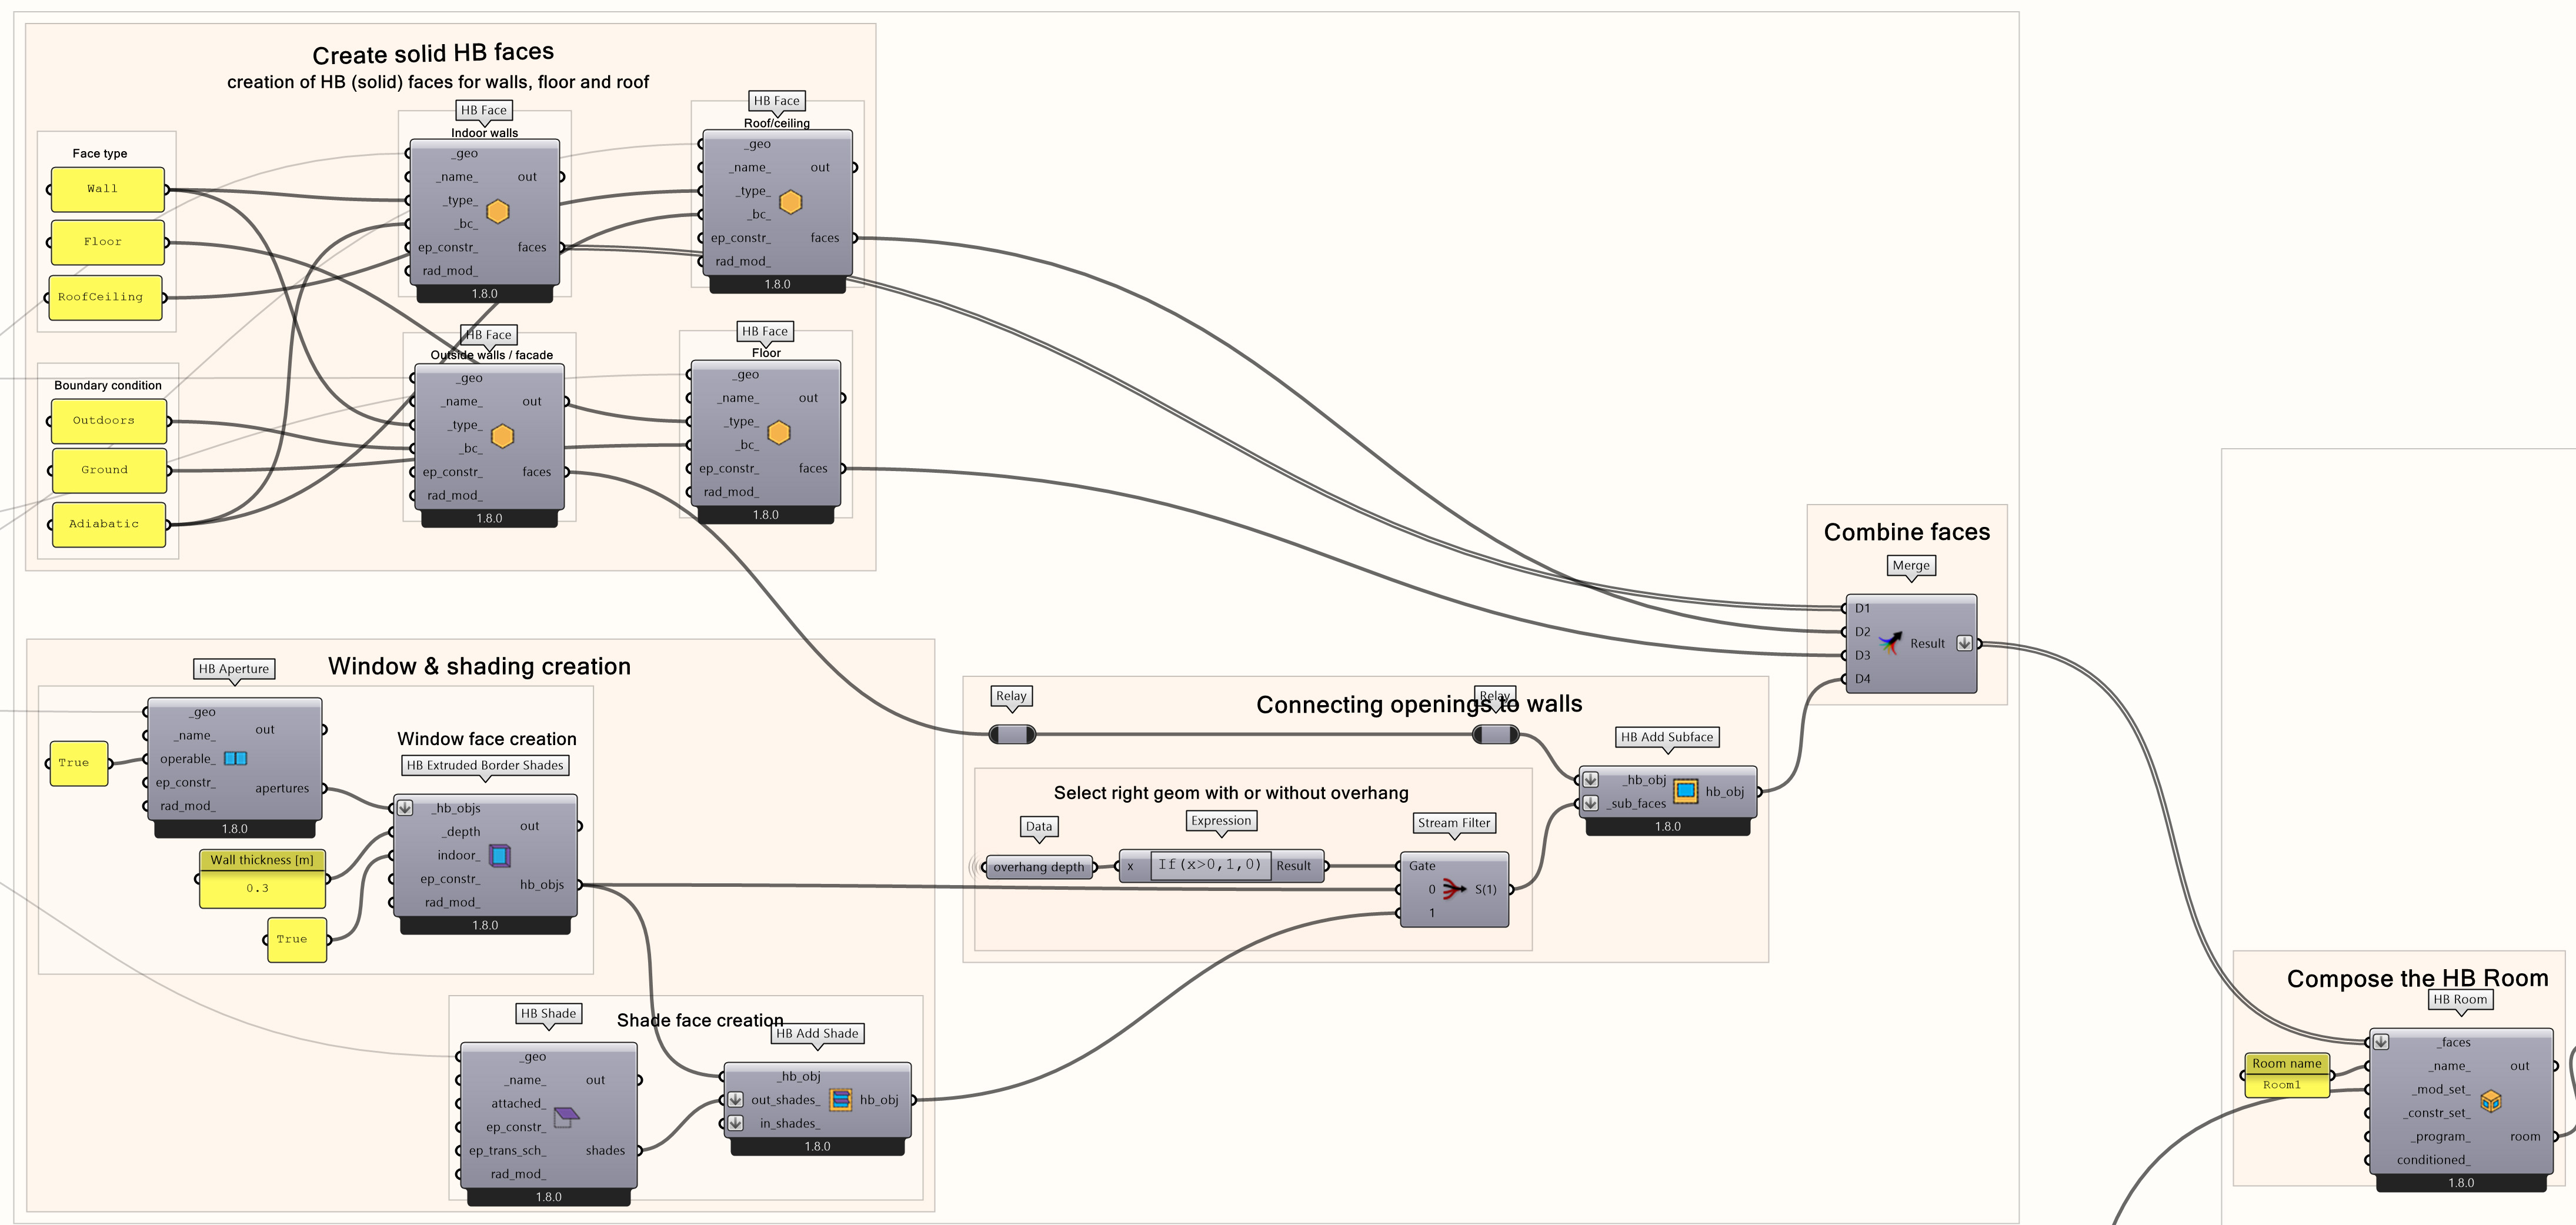
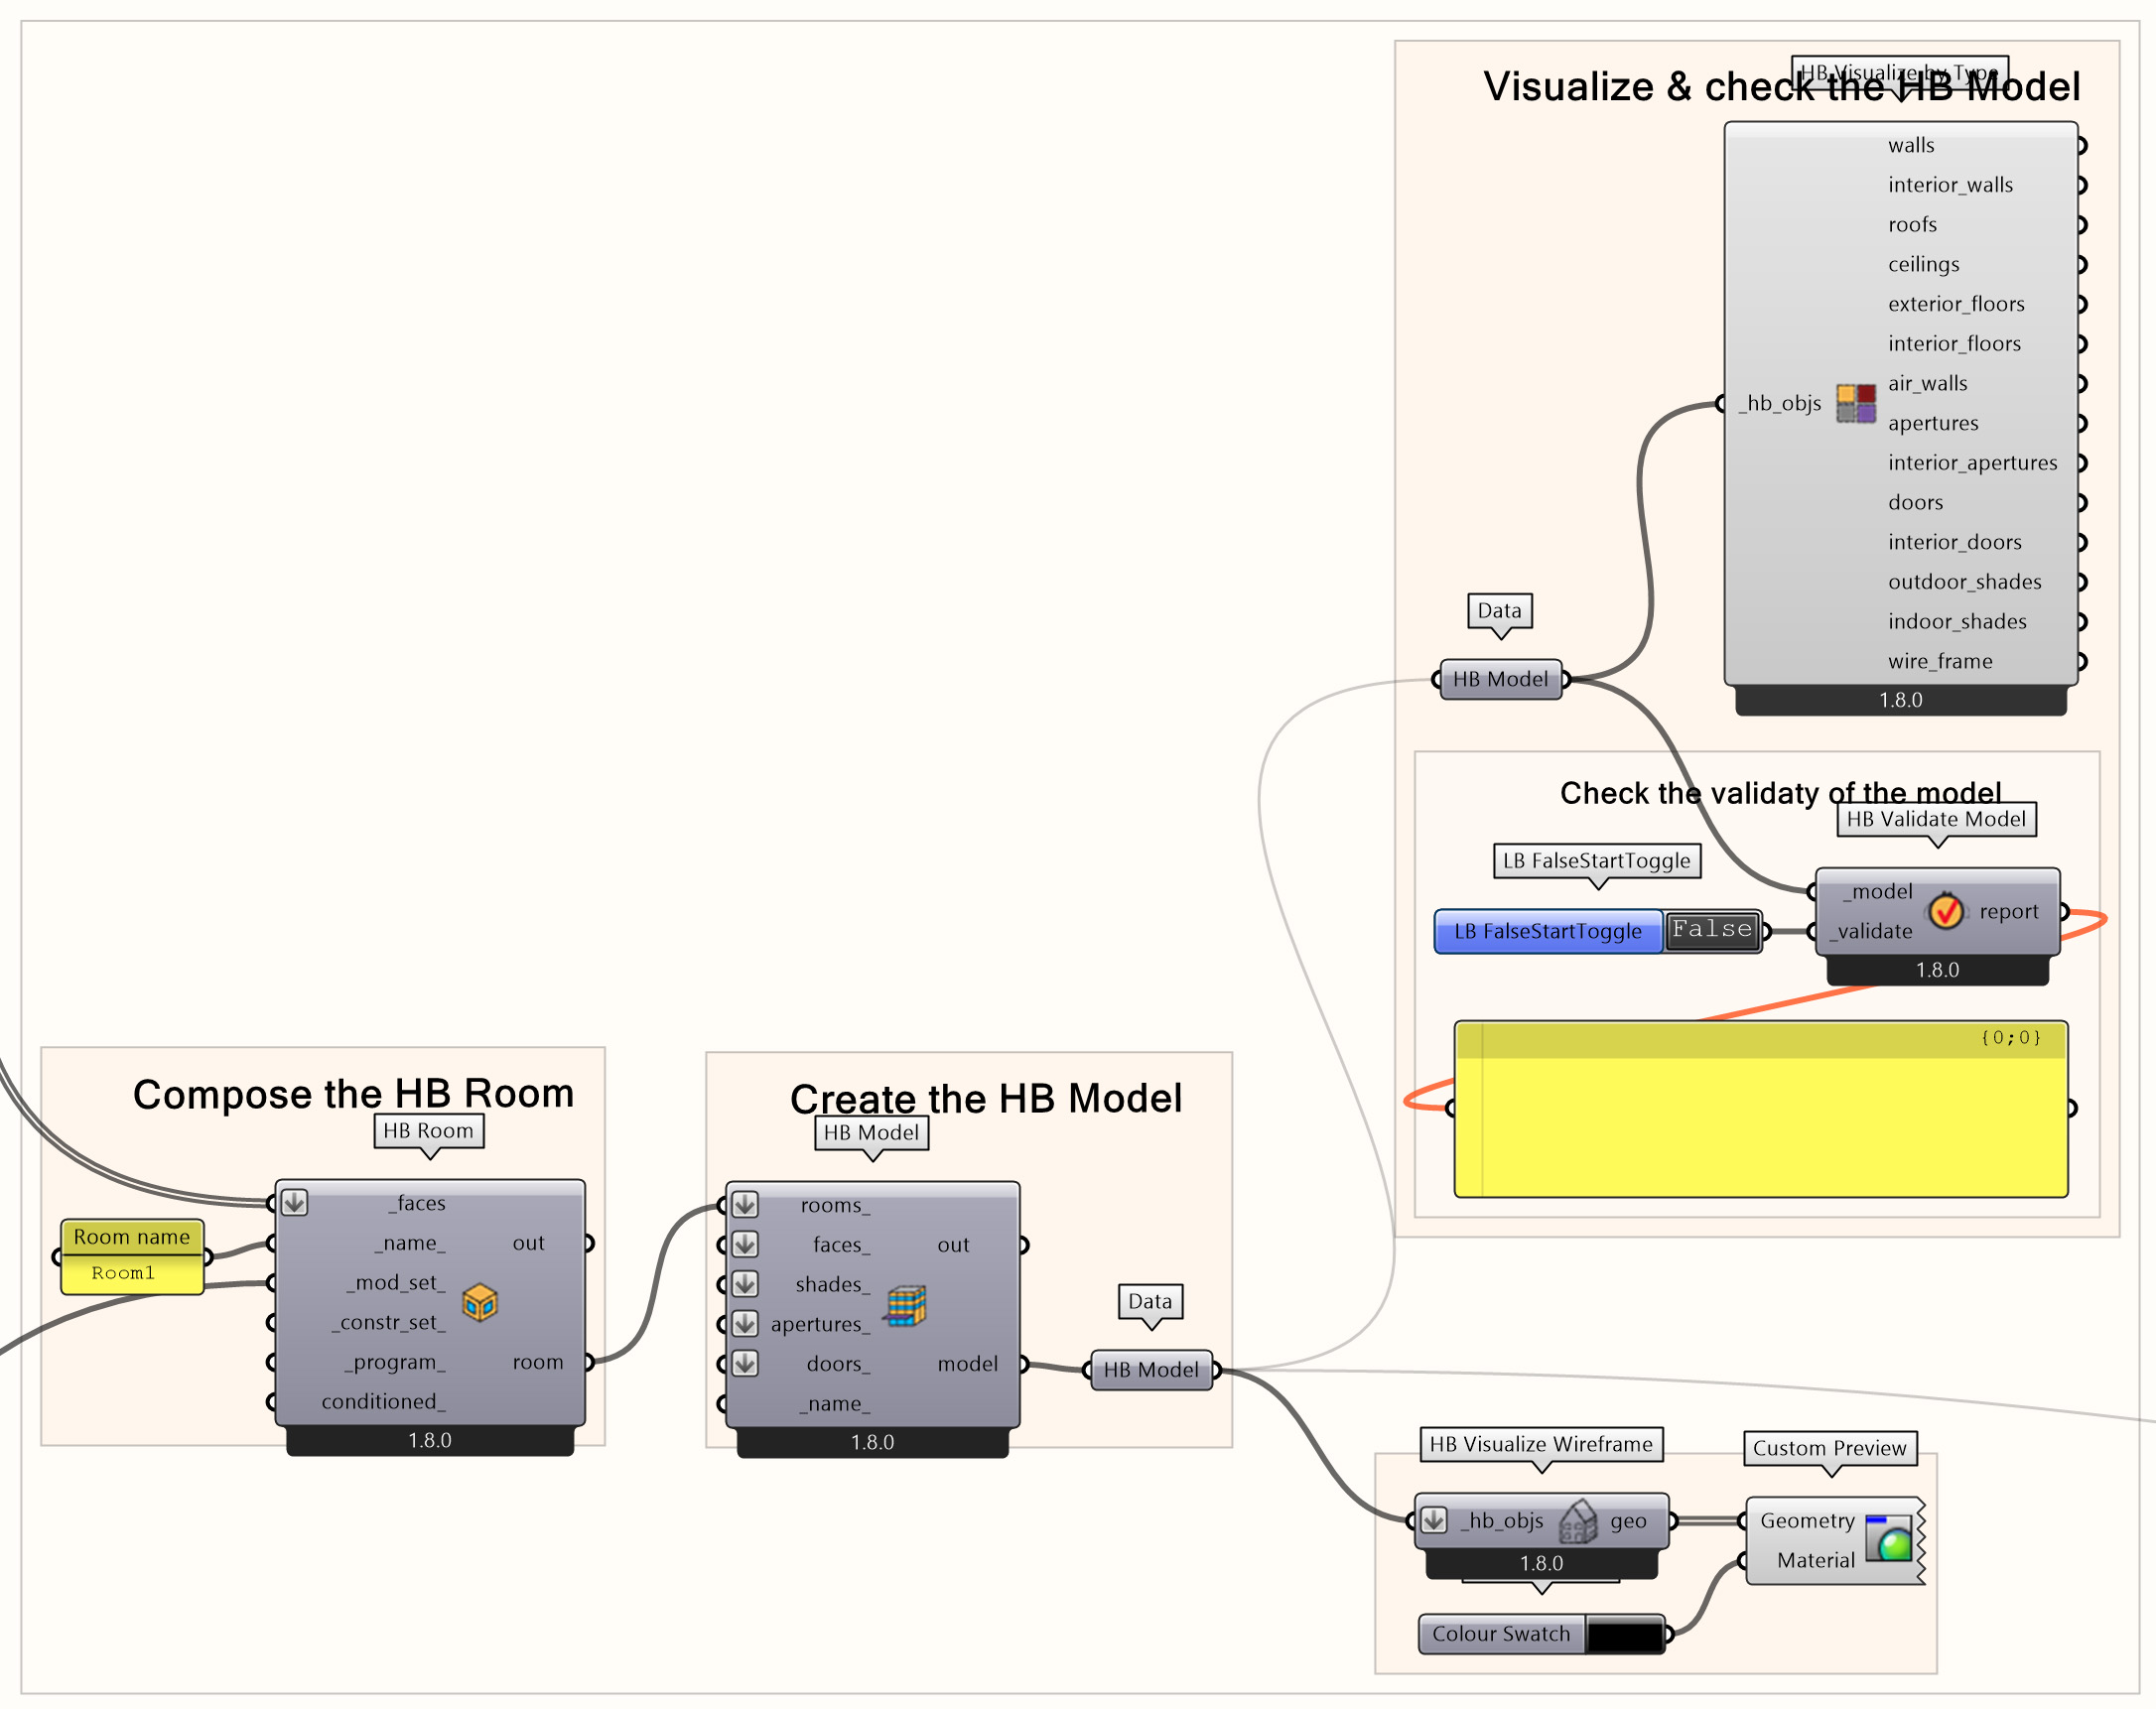
Then, from the HB room you can create the HB model, visualize the faces and check if it is correctly created or if there are errors you need to resolve before you proceed with the next steps. You can validate the HB model by following the steps as explained in the “Honeybee model set-up” tutorial.
Generating a Dataset in Grasshopper 8/14
HB Daylight Analysis: Materials and Sensor Gridlink copied
Optical material properties
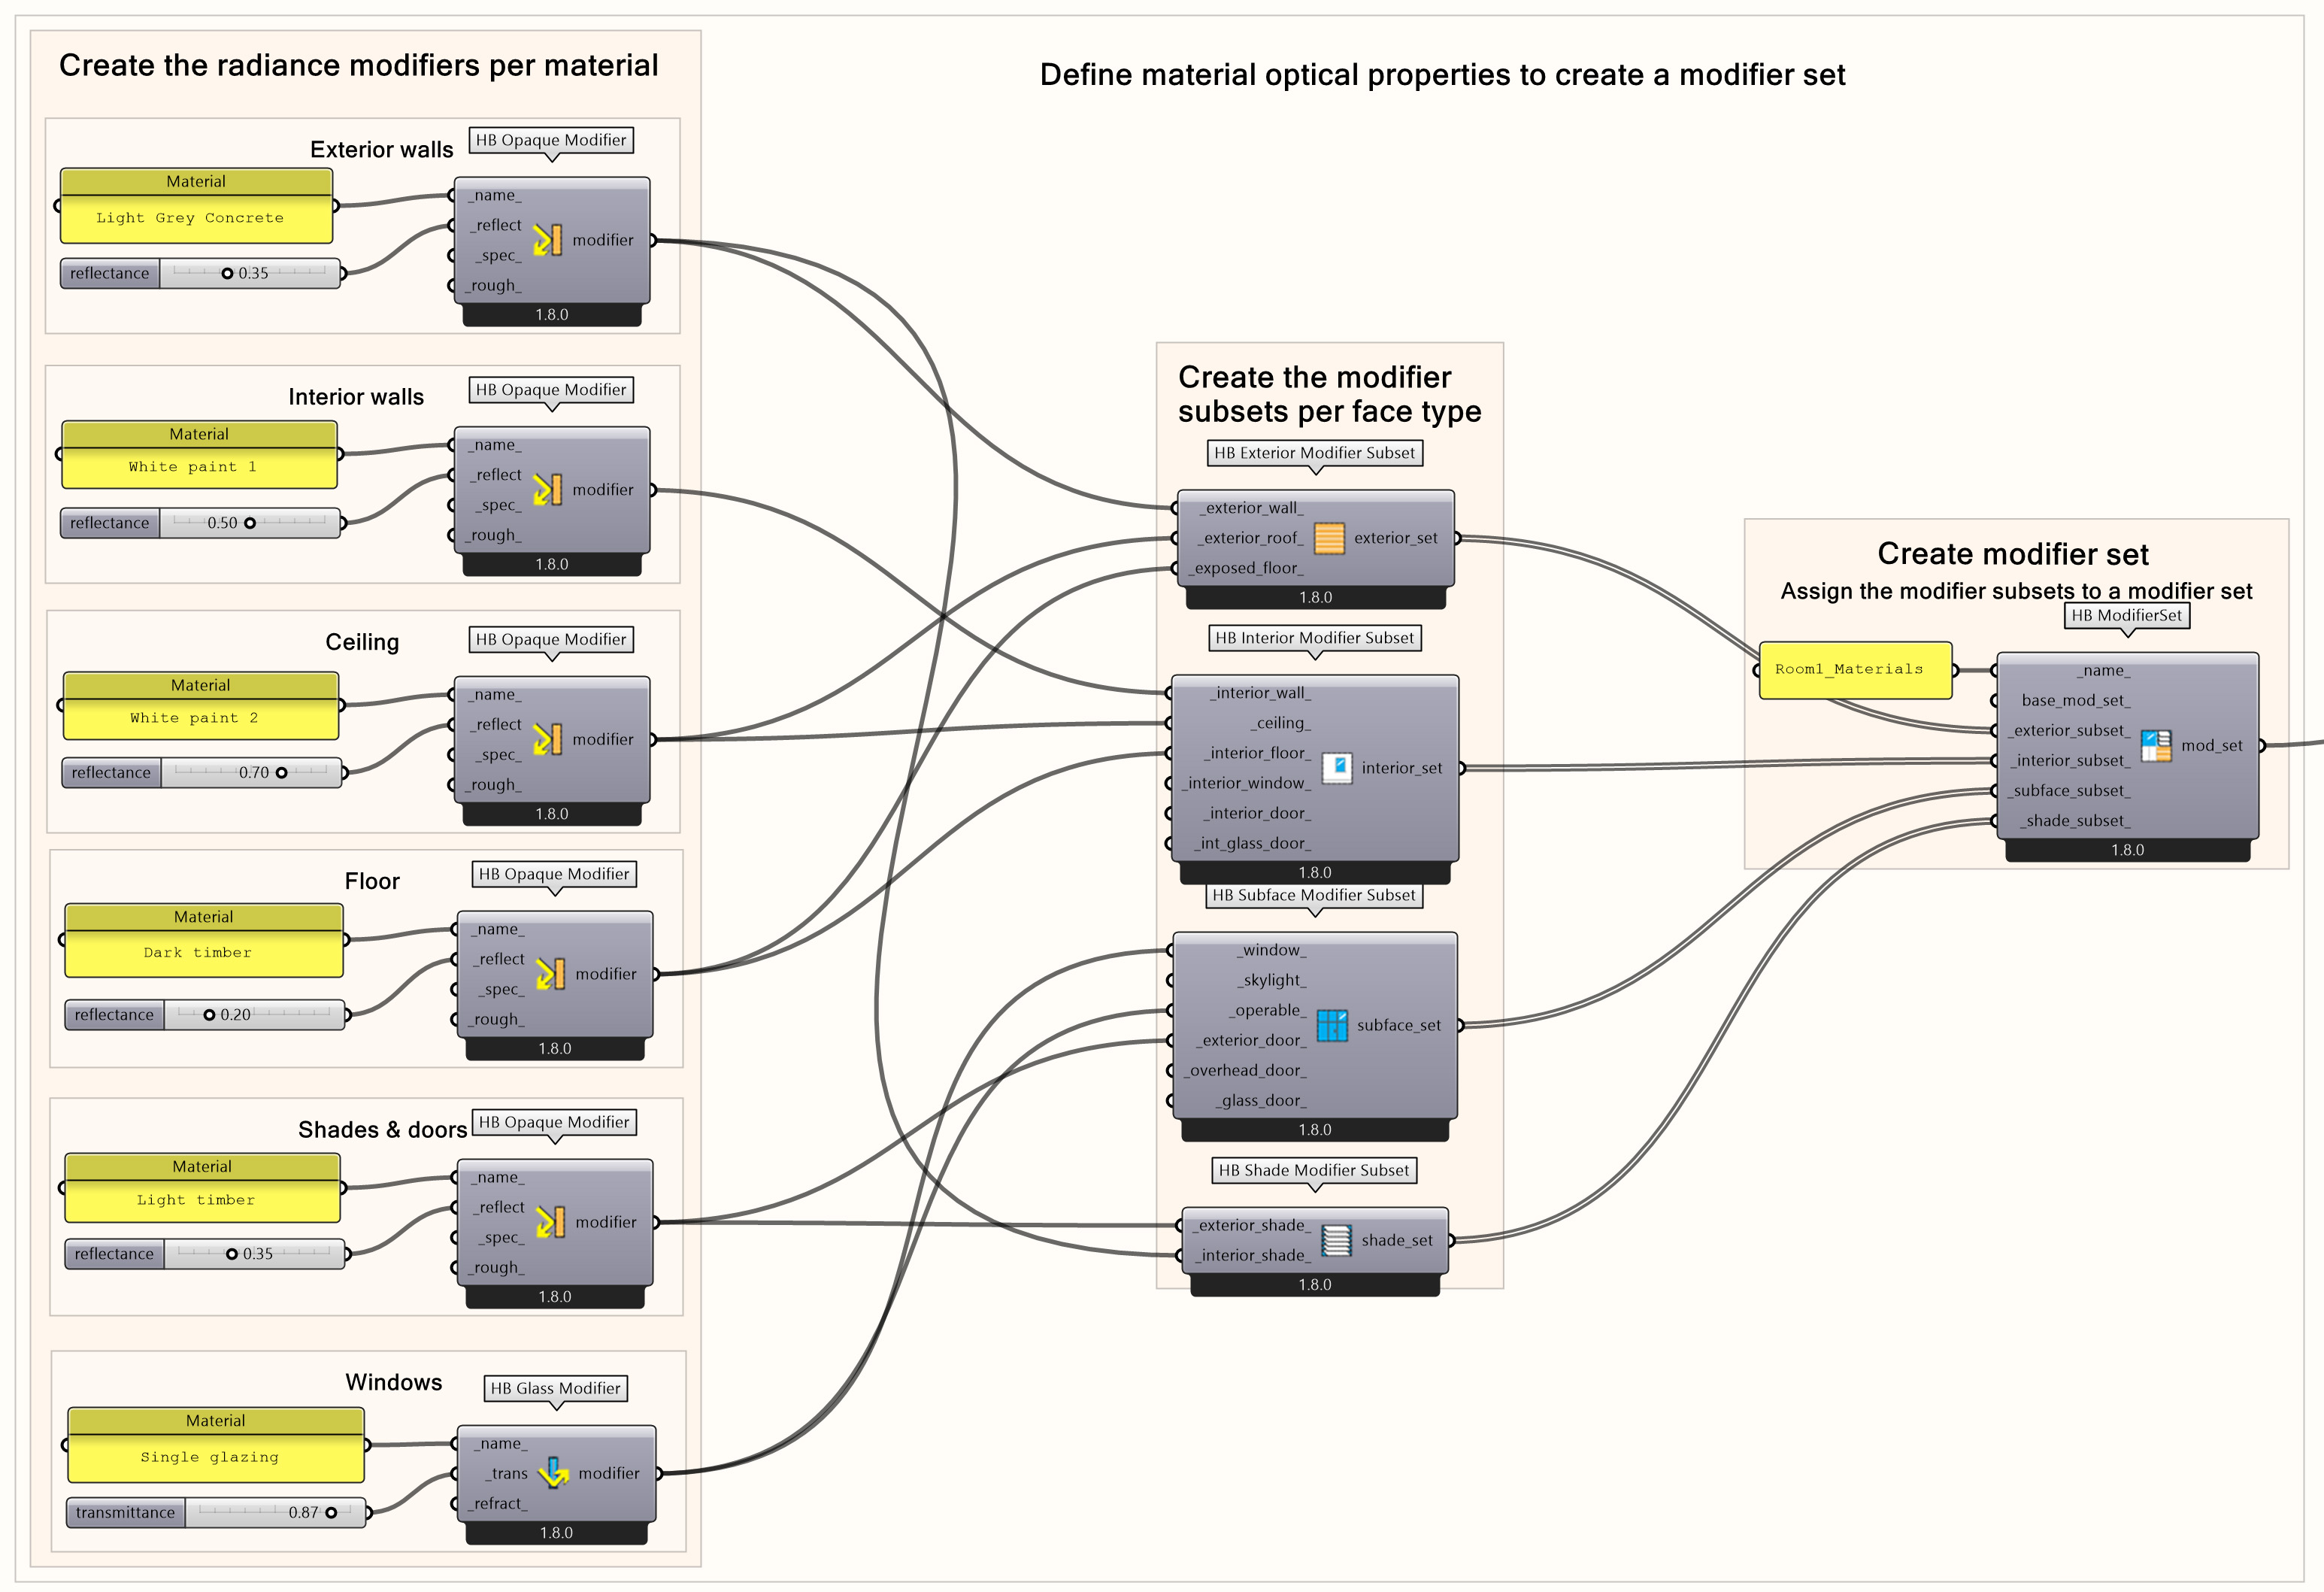
Before running the Daylight analysis, relevant material optical properties must be assigned to the faces of your HB model. To do so, first the radiance modifiers per material are created, then the modifier subsets are created per face from which the modifier set is created. Lastly, the modifier set is assigned to the HB model after which you can visualize and check the modifiers. The steps to add optical material properties to the HB model are described in the “Honeybee model set-up” tutorial.
Add Sensor Grid
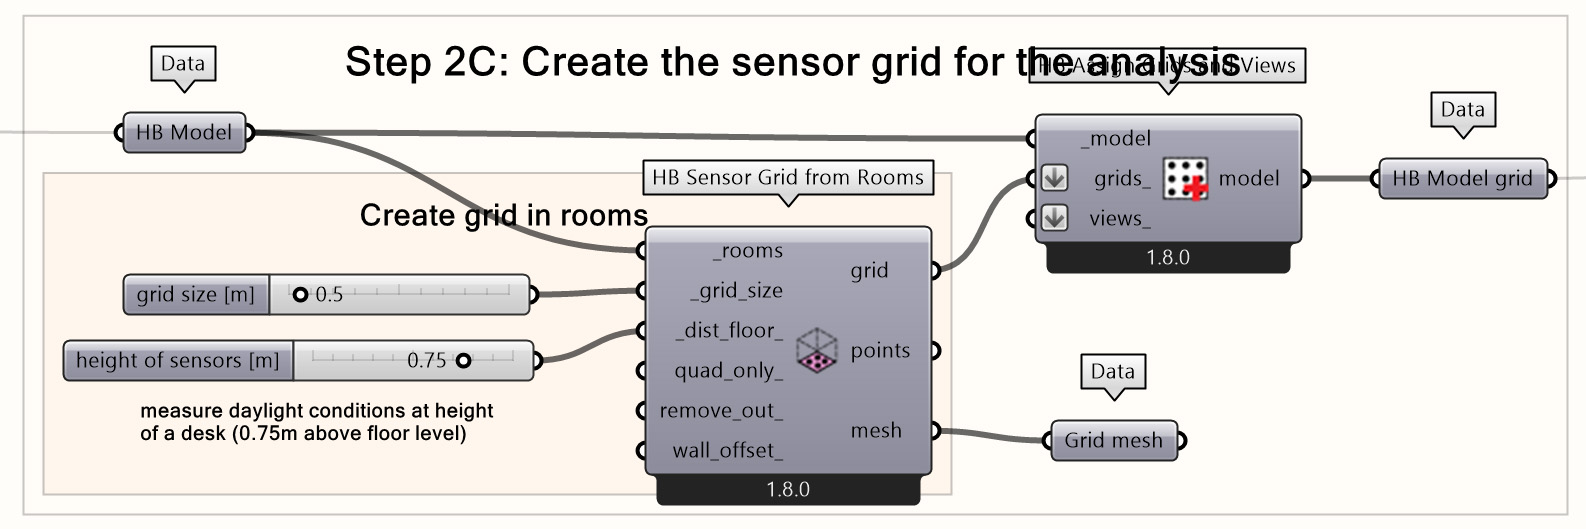
To run the Daylight simulation, a sensor grid should be assigned to the HB model that you have created. Create a sensor grid at 0.75m height above floor level to measure the daylight at the level of a work desk. The steps to add a sensor grid to the HB model are described in the “Honeybee model set-up” tutorial.
Generating a Dataset in Grasshopper 9/14
HB Annual Daylight Simulationlink copied
The final step of this part is to perform an Annual Daylight Simulation for every room variation. Based on the values of the useful daylight illuminance (UDI) and glare (UDI_up) we are then able to determine which is the correct function for each room. You can see a detailed description of how to set up an Annual Daylight Simulation by following the steps in Annual Daylight Simulation section of the “Honeybee Daylight simulation” tutorial.
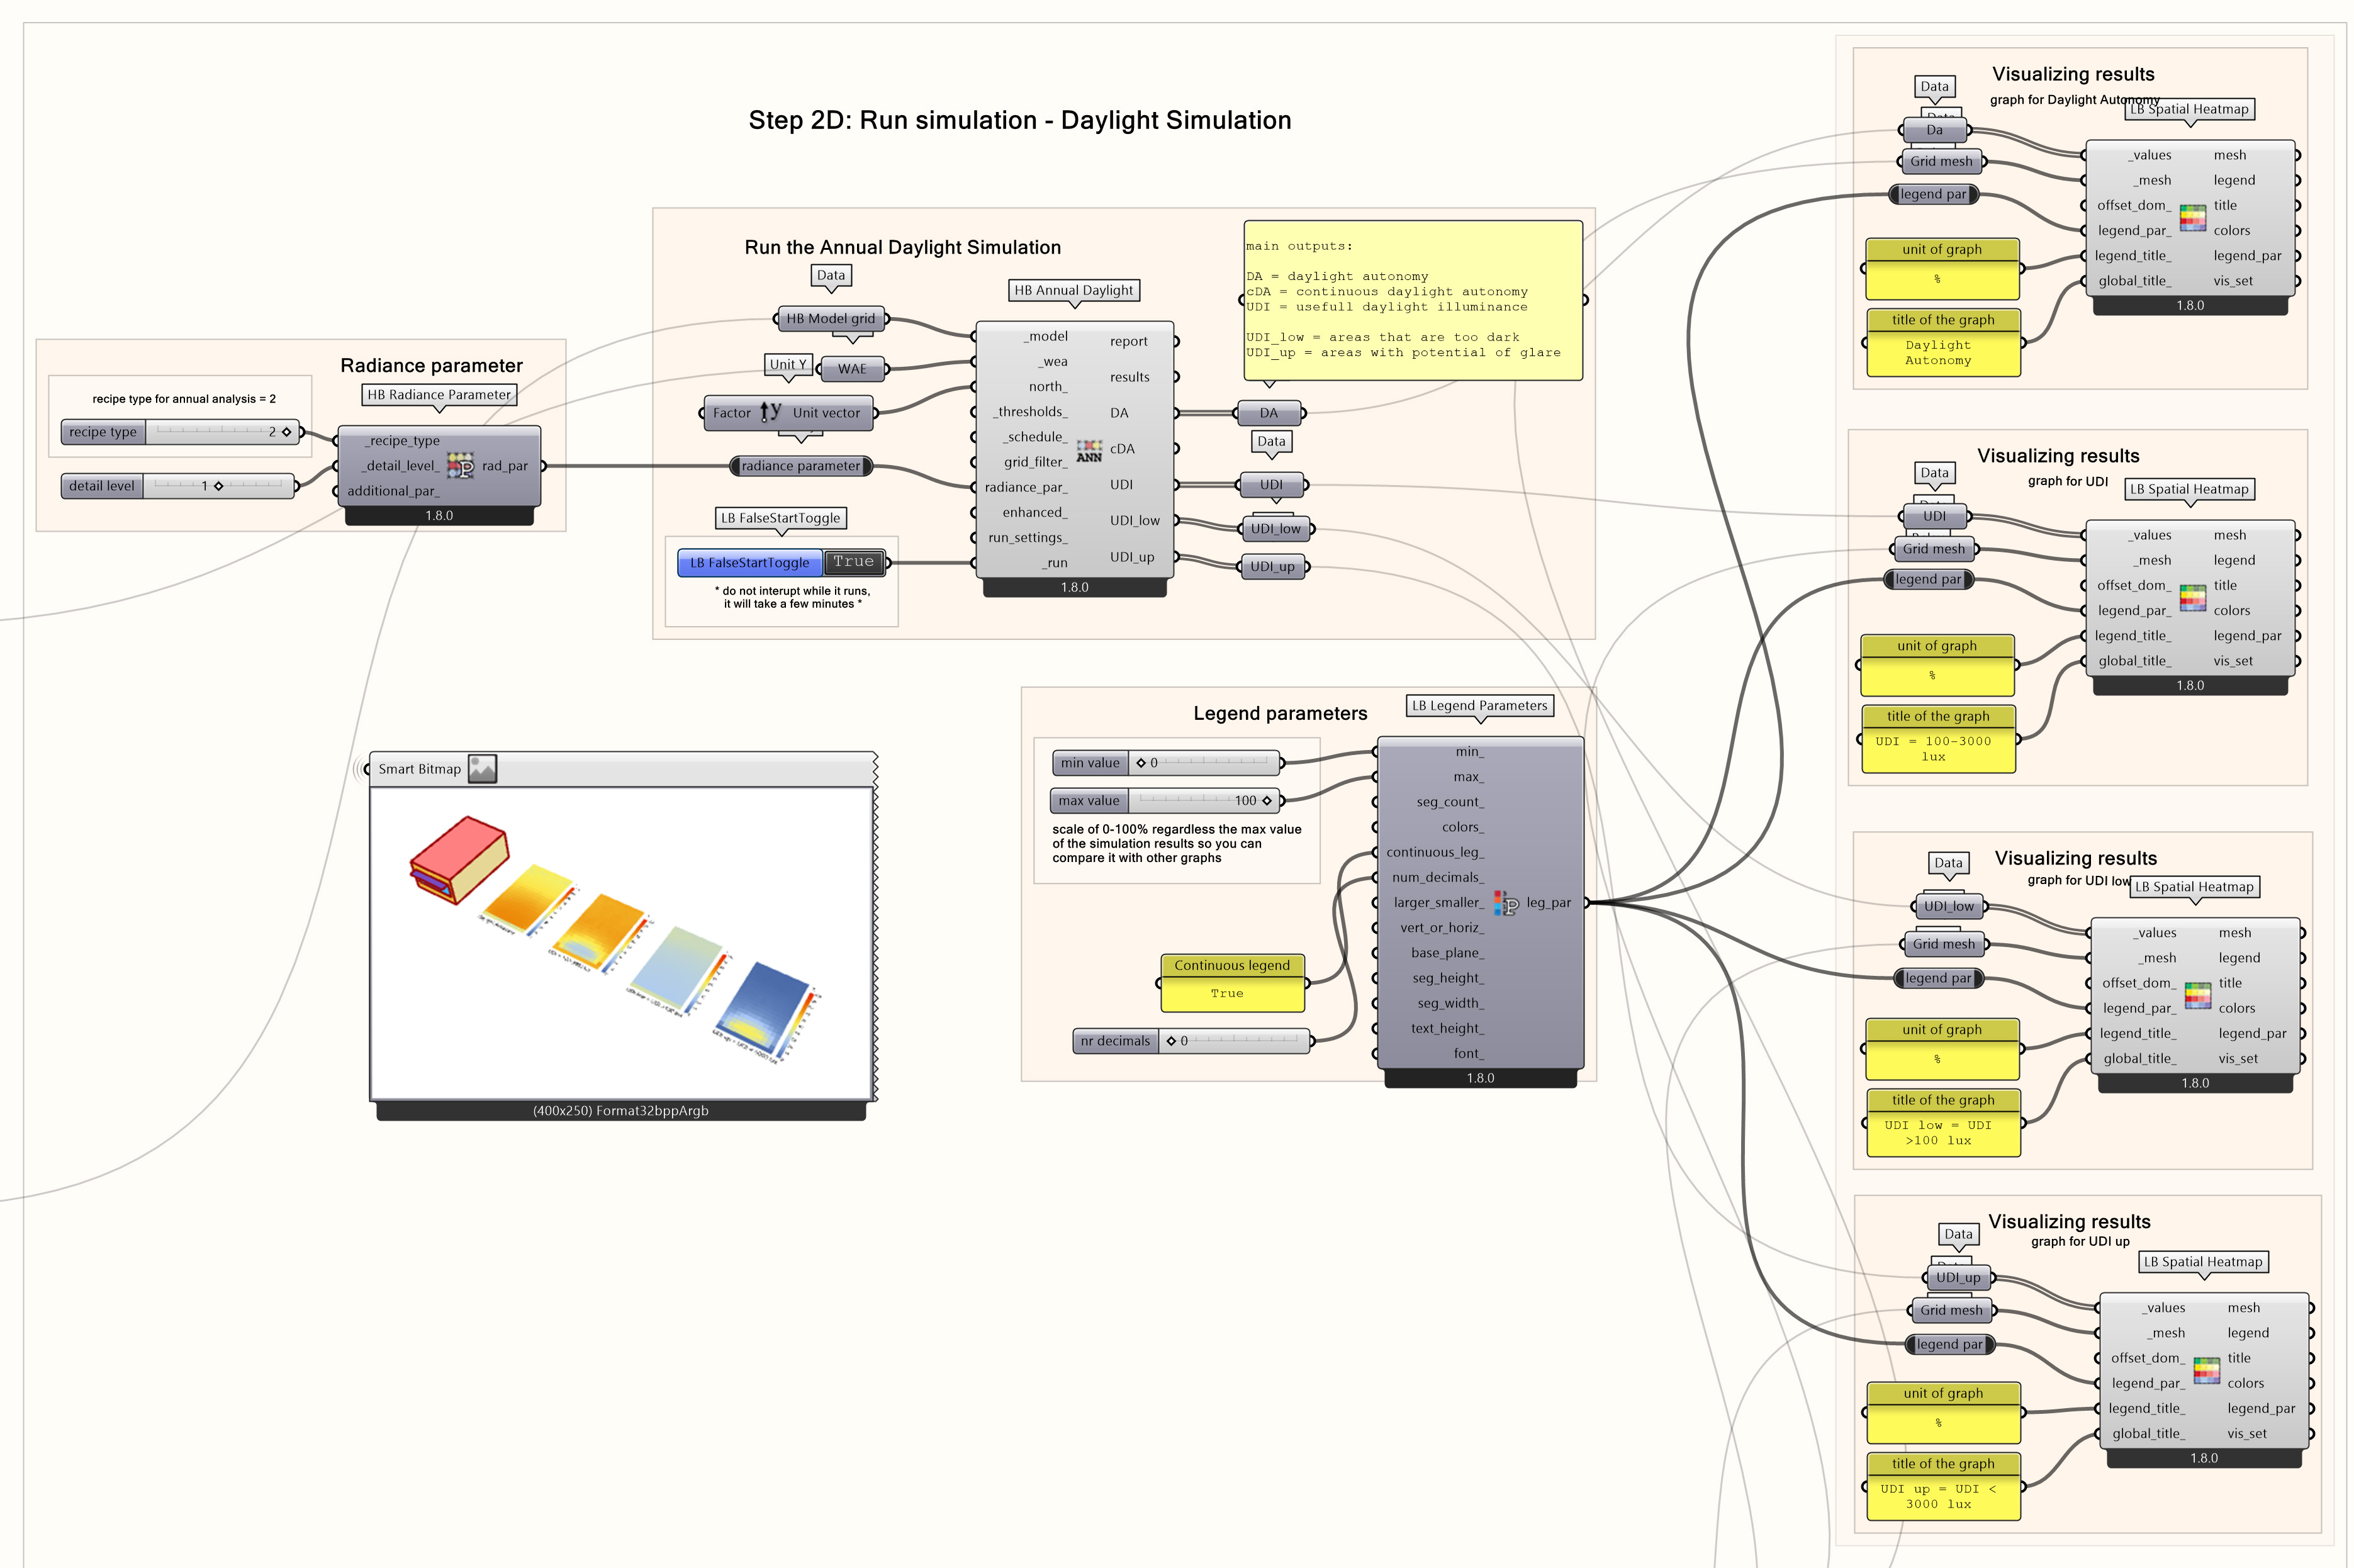
If you want to capture the outcomes of the Annual Daylight Simulation as images of the graphs for different room variations and be able to compare them, it is essential to use a consistent legend to make the comparison easy. Therefore, all outcomes are shown in the graphs as a percentage % with the same min and max values.
Note: The requirements for daylight and glare of each room to determine its function do not correspond to existing building guidelines. They are curated for the needs of this specific exercise in order to create a diverse data set.
Other than creating a dataset containing all room variations data in a file, a goal of this exercise is to also create a data set containing the image results of their daylight simulations. The images contain the results of all outcomes – DA, UDI, UDI_up, UDI_low – and not only the ones we consider for the daylight and glare.
To visualize all the output graphs simultaneously in one row for each simulation, we need to create a row of multiple meshes. To do this:
- Create a Stack Data component. Connect its data input to the grid mesh output of the HB Sensor Grid from Rooms component.
- Create 2 Number Slider components. One of them represents the number of copies of the mesh. Set it to 5. Connect this number slider to the stack input of the Stack Data component. The other is the distance between them in m. Set it in 10.
- Create a Pyhton 3 Script and name the input sources to num, dis, vert and the output source to points. Connect the num input to the number of copies Number slider and the dis input to the distance Number slider.
- Create a Boolean Toggle component. Connect it to the vert input of the Python component.
- Write a Python script that moves the mesh horizontally at a point that has a distance equal to what was set in the slider if there is another mesh in that point. Use the following code:
import Rhino.Geometry as rg
import math

# Calculate the dimensions of the grid
num_points_per_row = num  # Since it's just one row

# Generate the list of sets
if vert:
    result = [[x * dis, 0, 0] for x in range(num_points_per_row)]
else:
    result = [[0, x * dis, 0] for x in range(num_points_per_row)]

# Convert the list to a list of points
points = [rg.Point3d(item[0], item[1], item[2]) for item in result]
- Create a Move component. Connect the geometry input to the Stack Data component and the motion input to the Python component output.
- Create a Explode Tree component. Connect it to the geometry output of the Move component to be able to select all meshes separately.

Generating a Dataset in Grasshopper 10/14
Assigning Room Labelslink copied
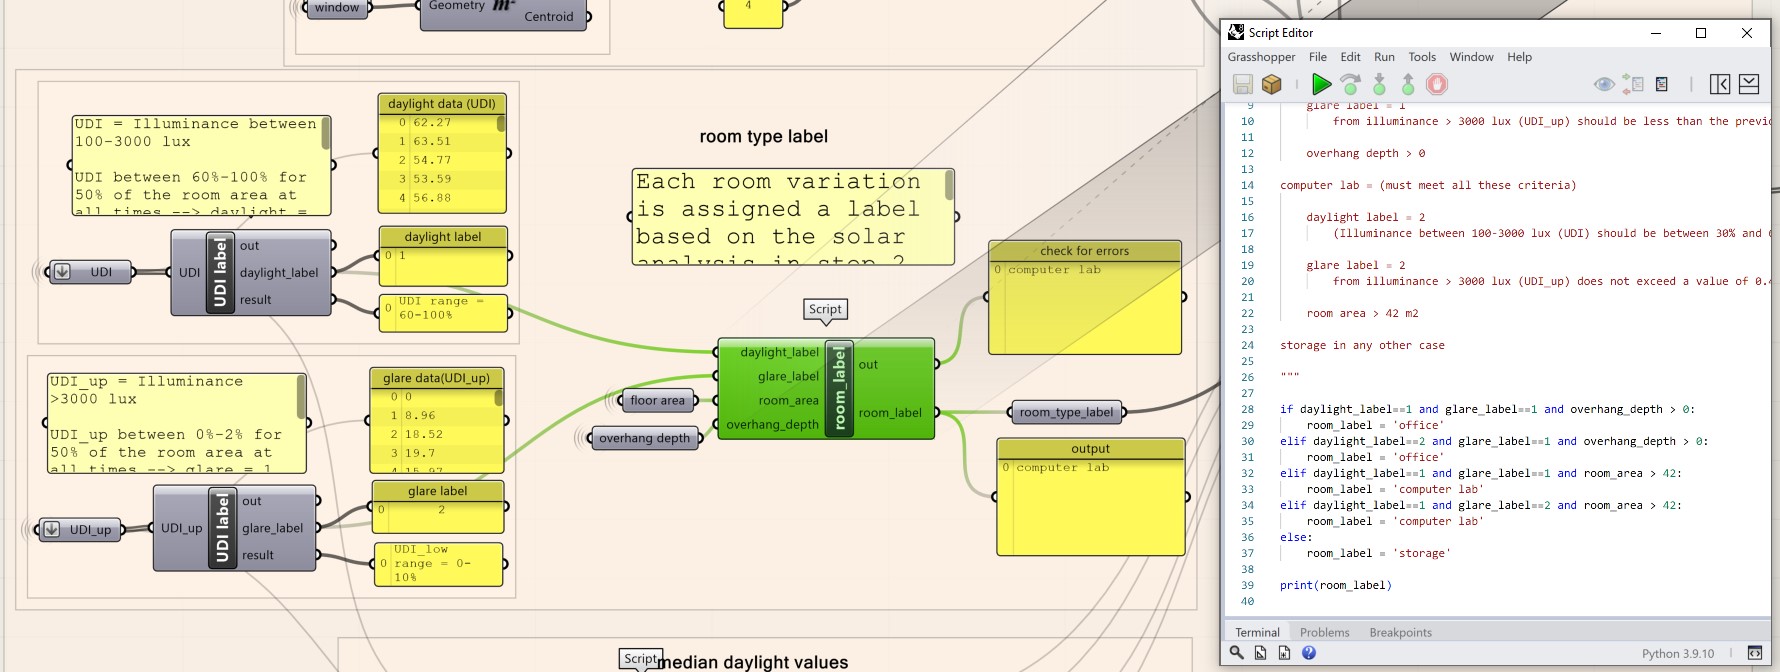
Generally, when we have a complete data set we will have both the input (features) and the output (true label). When we are creating our own data set we need to determine what the label of each data point is. If this were a true research project, we would collect actual or simulated data on each room of the university and collect the actual function of this room. Then the model could be trained on validated data. In this case, we need to artificially create the room labels. There are certain cases this may be necessary like when trying out an application or putting together an initial proof-of-concept model that will later be trained with validated data. In this case, we need to assign the “true” room label (room function) to each room based on the daylight and glare requirements that were described in the design problem. To do this, we have put together some Python components that check if a room meets the requirements. Please note, for this example, the values used for daylight and glare were selected to produce a balanced data set.
Daylight
The rooms can have a function of either office, computer lab or storage. To determine the room function we need the UDI (daylight) and UDI_low (glare) values from the daylight simulation. To define the room label you need to:
- Create 2 Python 3 Script and 2 Panel components. Name the input sources of the Python components as “UDI”. Connect each of the Python components outputs to one of the Panels to visualize the resulting values.
Note: For the Python component to be able to process the input data correctly, right click on the input data stream and select “List Access”. Then, right click again, click on the Type hints and select float. You need to do this for both Python components. Do this for both Python components.
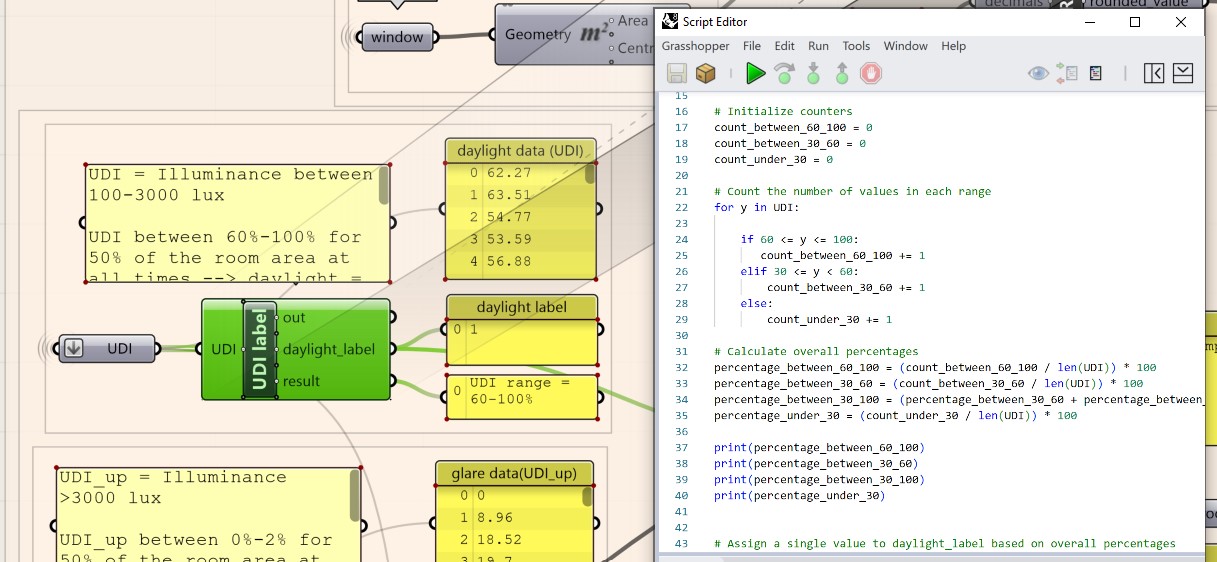
- Connect the first Python component’s UDI input to the UDI output of the HB Annual Daylight Simulation component. The Python component need to be scripted to count the percentage of values that are between 30-60% and 60-100% and then assign the output value 1,2 or 3 to the daylight depending on the highest count amongst them. The script you can use is this:
"""
how to figure out what daylight we have in the room:

UDI = Illuminance between 100-3000 lux

UDI between 60%-100% for 50% of the room area at all times
--> daylight = 1

UDI between 30%-60% for 50% of the room area at all times
--> daylight = 2

UDI below 30% for 50% of the room area at all times
--> daylight = 3
"""

# Initialize counters
count_between_60_100 = 0
count_between_30_60 = 0

# Count the number of values in each range
for y in UDI:

    if 60 <= y <= 100:
       count_between_60_100 += 1
    elif 30 <= y < 60:
        count_between_30_60 += 1

# Calculate overall percentages
percentage_between_60_100 = (count_between_60_100 / len(UDI)) * 100
percentage_between_30_60 = (count_between_30_60 / len(UDI)) * 100

# Assign a single value to daylight_label based on overall percentages
if percentage_between_60_100 >= 50:
    daylight_label = 1
elif percentage_between_30_60 >= 50:
    daylight_label = 2
else:
    daylight_label = 3
Glare
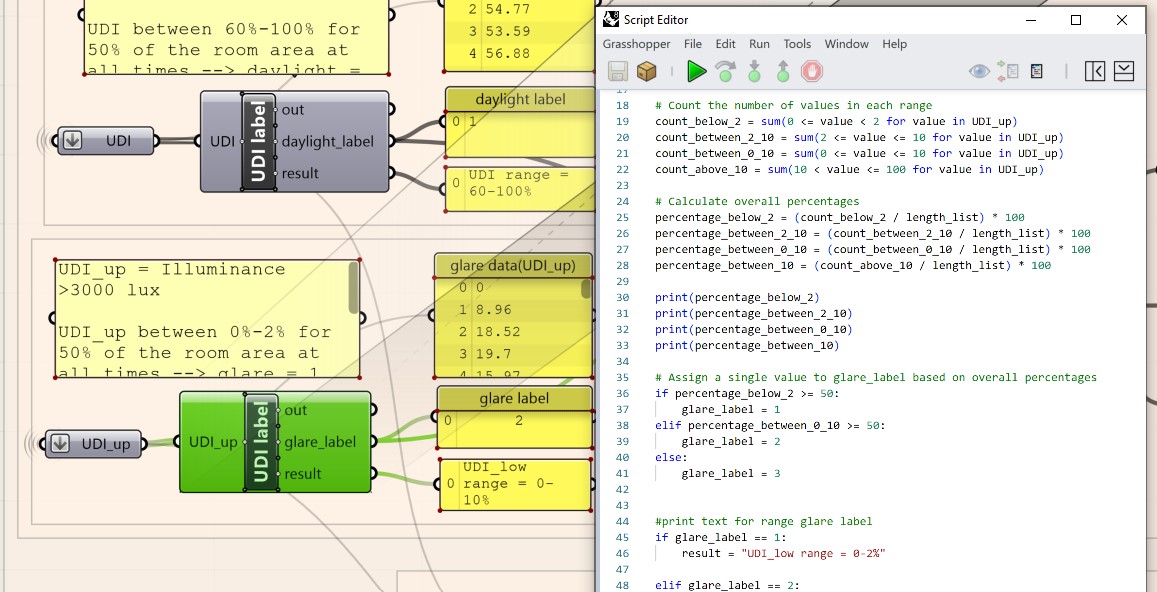
- Connect the second Python component’s UDI input to the UDI_low output of the HB Annual Daylight Simulation component. The Python component needs to be scripted to count the percentage of values that are between 0-2% and 2-10% and then assign the output value 1,2 or 3 to the glare depending on the highest count amongst them. The script you can use is this:
"""
how to figure out what glare we have in the room:

UDI_up = Illuminance >3000 lux

UDI_up between 0%-2% for 50% of the room area at all times
--> glare = 1

UDI_up between 2%-10% for 50% of the room area at all times
--> glare = 2

otherwise
--> glare = 3
"""

# Count the number of values in each range
count_between_0_2 = sum(0.00 <= value < 2.00 for value in UDI)
count_between_2_10 = sum(2.00 <= value <= 10.00 for value in UDI)

# Calculate overall percentages
percentage_between_0_2 = (count_between_0_2 / len(UDI)) * 100
percentage_between_2_10 = (count_between_2_10 / len(UDI)) * 100

# Assign a single value to glare_label based on overall percentages
if percentage_between_0_2 >= 50 :
    glare_label = 1
elif percentage_between_2_10 >= 50:
    glare_label = 2
else:
    glare_label = 3
Label Assignment
Then, you can combine the daylight and glare numbers to get the room label. The room label can be:
- office: daylight = 1 or 2, glare = 1, shading depth > 0
- computer lab : daylight = 2, glare = 2, room area > 42 m2
- daylight should be less in computer room therefore, less light needed
- storage in any other case
To output the room label:
- Create a Pyhton 3 Script and a Panel component. Name the input sources of the Python components as “room_area”, “daylight”, “glare”, “shading_depth” and the output as “room_label”. Connect the Python output to the Panel to visualize the resulting label.
Note: For the Python component to be able to process the input data correctly, right click on the input data stream and select “Item Access” on each of the inputs. Then, right click again, click on the Type hints and select ‘float’.
- Connect the room_area input to the room Area component you used in writing the data in a row. Connect the daylight input to the daylight value Python output and the glare input to the glare value Python output. Connect the shading_depth input to the Absolute component used for the shading depth data writing in 1 row.
- Write the Pyhton script to define the room label based on the above mentioned parameters. Use this script:
"""
assign label to rooms: office, computer lab or storage

office = (must meet all these criteria)

    daylight label = 1 or 2
        (Illuminance between 100-3000 lux (UDI) should be between 30% and 100% for 50% of the room area at all times)

    glare label = 1
        from illuminance > 3000 lux (UDI_up) should be less than 2% for 50% of the room area at all times

    overhang depth > 0

computer lab = (must meet all these criteria)

    daylight label = 2
        (Illuminance between 100-3000 lux (UDI) should be between 30% and 60% for 50% of the room area at all times)

    glare label = 2
from illuminance > 3000 lux (UDI_up) is between 2%-10% for 50% of the room area at all times

    room area > 42 m2

storage in any other case

"""

if daylight==1 and glare==1 and shading_depth > 0:
    room_label = 'office'
elif daylight==2 and glare==1 and shading_depth > 0:
    room_label = 'office'
elif daylight==2 and glare==2 and room_area > 42:
    room_label = 'computer lab'
else:
    room_label = 'storage'

print(room_label)
Generating a Dataset in Grasshopper 11/14
Recording Grasshopper Data with Colibrilink copied
To create the data set, we need to run the Grasshopper script with all variations of the room parameters. Each variation will then be exported to a CSV file. To run all the variations automatically, we will use the Grasshopper plugin Colibri. Colibri allows you to loop through all possible combinations of a set of inputs and assemble the results into a CSV file with input and output values for each iteration.
To connect with the Jupyter notebook you need to export all outputs in a CSV file (which can also be opened in Excel). Each room variation now has an assigned label based on the daylight analysis performed before. .
For each room variation, the following features will be saved:
- area
- room depth
- depth to width ratio
- window width
- window height
- window to wall ratio
- shading depth (if there is no shade this is 0)
- room label
Optionally, you can also include the daylight analysis values:
- Da results
- UDI results
- UDI_low results
- UDI_up results
Collect all room data
To write all the data to a CSV, we will collect the room data for each room variation by connecting them to a Colibri Outputs component. To do that:
- Create a Colibri Outputs component and add 8 input data streams to it named: ‘room area [m2]’, ‘room depth-width ratio’, ‘window-wall ratio’ ‘room type label’, ‘median DA’, ‘median UDI’, ‘median UDI-low’, median UDI-up’.
For the 1st data stream: Create a Area component. Connect its geometry input to the floor surface of the 1st step of this tutorial to get the area of the room.
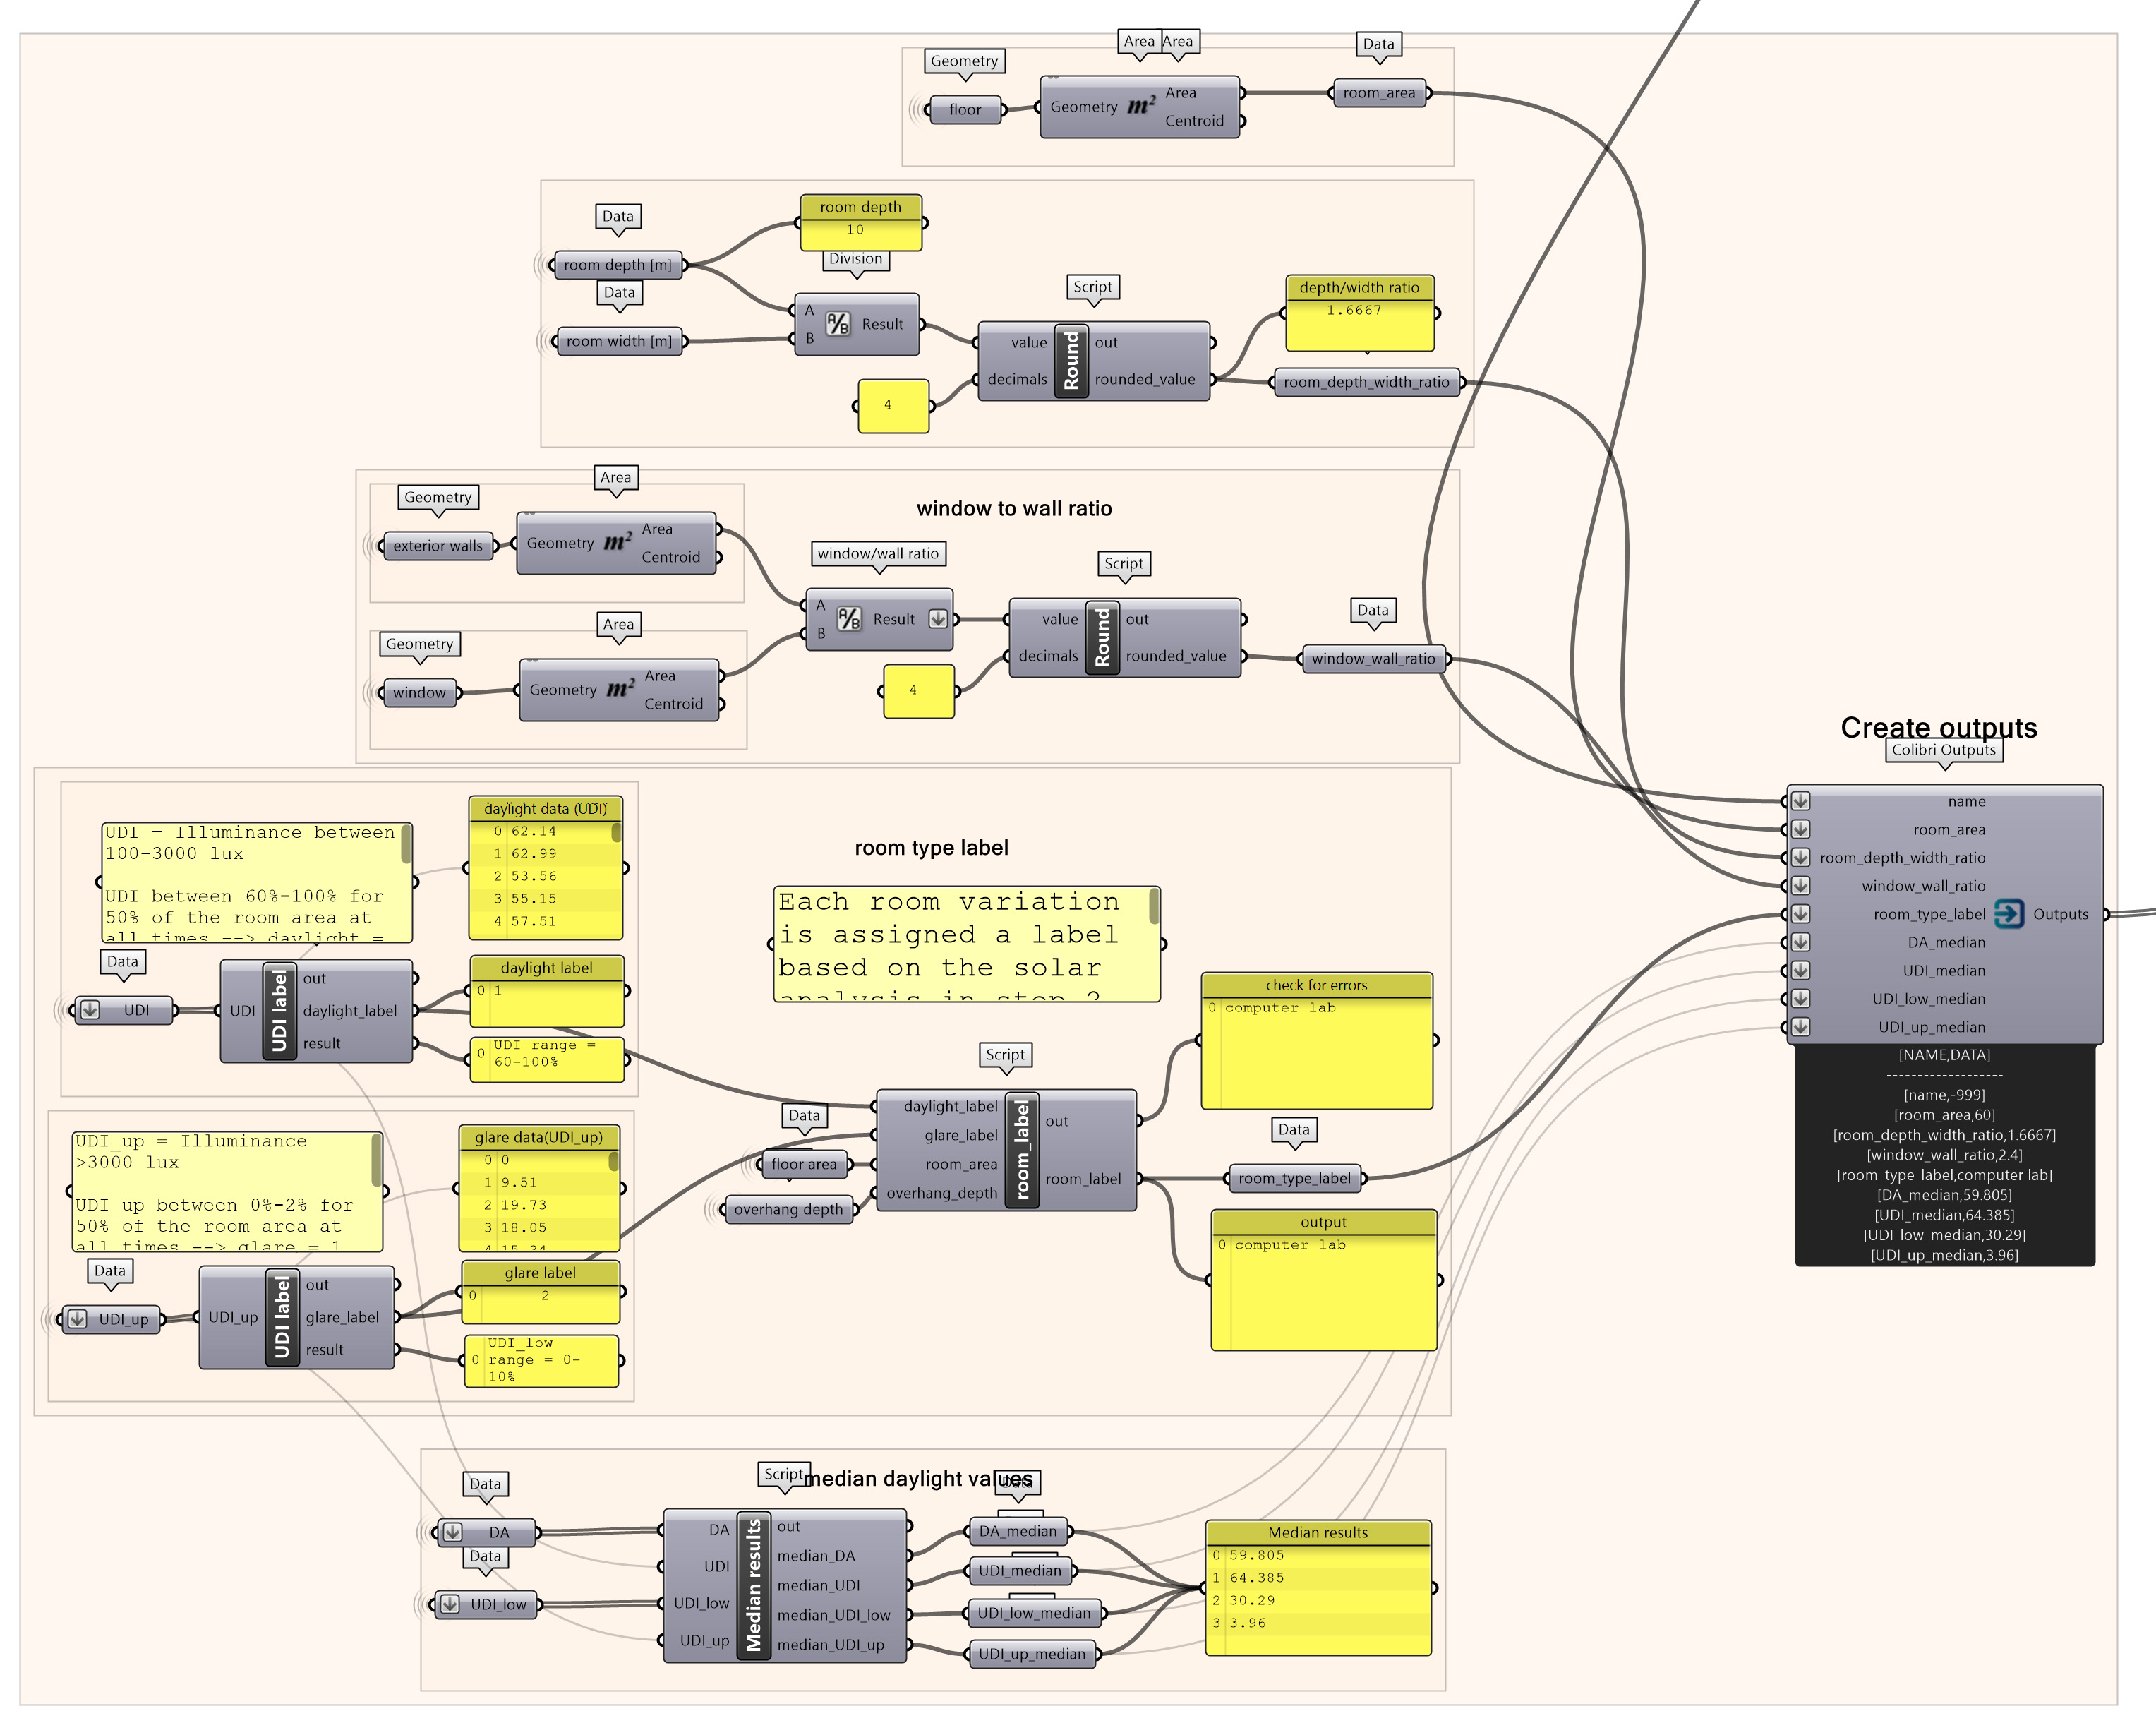
For the 2nd data stream, you need to find the depth/width ratio of the room:
- Create a Division component. Connect it to the room depth and width accordingly from the room geometry creation step to get the depth/width ratio of the room.
- Create a Pyhton 3 Script component. Set two inputs to “value” and “decimals” and the output to “rounded_value”.
- Write a python script that returns a value rounded in specific decimals. Connect the value input to the Division component. The Python script to use for the component is:
rounded_value = round(value, decimals)- Create a Panel component.
- Write the number 4 in the panel to set it to 4 decimals and connect the Panel to the decimals input of the Python component.
For the 3rd data stream, you need to find the window to wall ratio:
- Create 2 Area components and connect them to the south (exterior) wall and window surfaces at the end of the room geometry creation step.
- Then, create a Division component and connect the two Area components to its inputs.
- Create a Pyhton 3 Script component. Set two inputs to “value” and “decimals” and the output to “rounded_value”.
- Write a python script that returns a value rounded in specific decimals. The Python script to use for the component is:
rounded_value = round(value, decimals) - Create a Panel component. Write the number 4 in the panel to set it to 4 decimals and connect the Panel to the decimals input of the Python component.
- For the 4th data stream: connect the python component created in the last step where it outputs the room labels
- For the final 4 data streams of the Colibri Outputs components we need the median daylight values from the simulation. To get those values:
- Create a Pyhton 3 Script and add 4 input streams to it named ‘DA’, ‘UDI’, ‘UDI_low’ and ‘UDI_up’.
-
- Write the Pyhton script to calculate the median value results. Use this script:
# Import statistics module to use median function
import statistics
# Calculate median
median_DA = statistics.median(DA)
median_UDI = statistics.median(UDI)
median_UDI_low = statistics.median(UDI_low)
median_UDI_up = statistics.median(UDI_up)


Generating a Dataset in Grasshopper 12/14
Colibri: Select Design Variableslink copied
The next step is to set up the iteration through all room variations. We will do this by using the Colibri Inputs (Iterator) component to connect all number sliders that influence the room variables. For this example, we will have 270 different results. To create the iteration:
- Create a Colibri Inputs (Iterator) component and add 4 input data streams to it named: ‘room depth [m]’, ‘window width [m]’, ‘window height [m]’, ‘overhang depth [m]’.
- Connect these data inputs to the respective number sliders created in the Form generation step of the tutorial of the room depth, window width and height and overhang depth.
To check if the iterator works, we need to first test on a limited number of iterations. To create a selection and check the iterator:
- Create a Colibri Iteration Subdomain component.
- Create a Construct Domain component and 2 Panel components to set the 2 numbers of the beginning and end room number out of all iterations.
- Connect the 2 panels to the Construct Domain inputs and then the output to the ‘domain’ input of the Colibri Iteration Subdomain.
- Connect the ‘selection’ output of the Colibri Iteration Subdomain to the ‘selection’ input of the Colibri Inputs (Iterator).
- Double click on the ‘Fly’ button of the Colibri iterator to check if the iteration works.
Generating a Dataset in Grasshopper 13/14
Colibri: Export Datalink copied
Export images of iterations
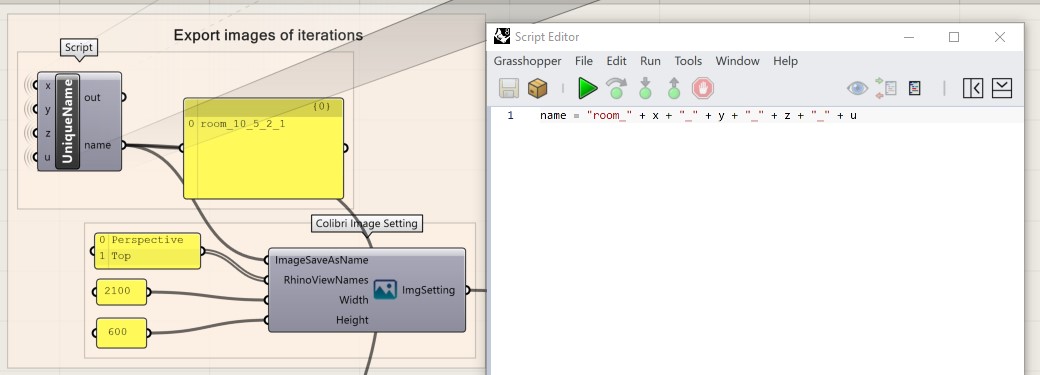
In addition to exporting the CSV file, we will be exporting images of the graphs created for each iteration during its Daylight simulation. This allows us to visually compare the results for each iteration later if needed. Each iteration should be saved with its unique name so there is no confusion between the images. To create a unique name, we can use a python script. To export the images:
- Create a Colibri Image Setting component and Panel components to set the Rhino views you want to save as images, the width and height of the exported image. For this tutorial we will export the Perspective and Top views and set the exported image dimensions to 2100×600.
- Create a Pyhton 3 Script and add 4 input sources to it. Connect these sources to the 4 outputs of the Colibri Inputs (Iterator) component. Rename the output of the component to name.
- Write a Pyhton script that creates a unique name by adding all numbers form the inputs as strings to the word ‘room’. Use this script:
name = "room_" + x + "_" + y + "_" + z + "_" + u
Write the CSV File
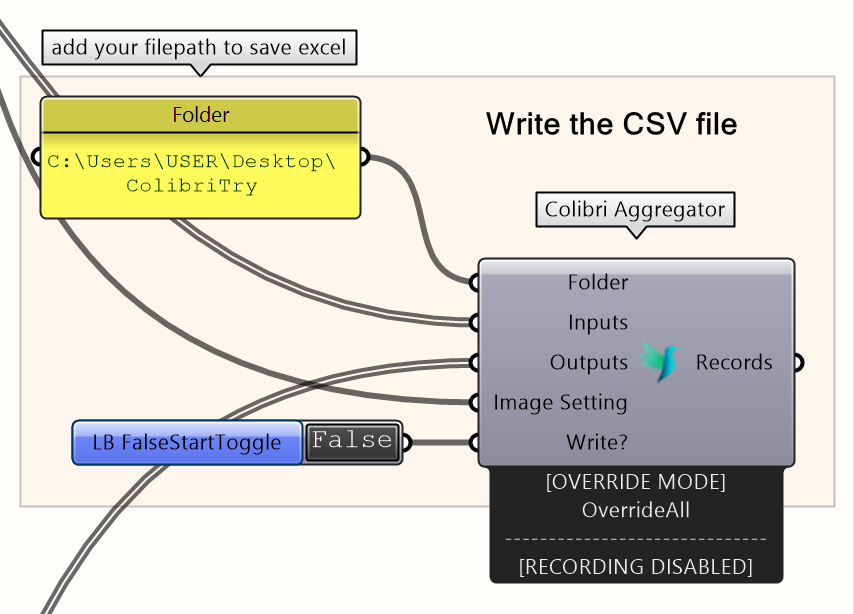
The final step is to write the CSV file containing all the data. To do this, we first need to create a folder in which we will save the CSV file and all exported images. Then use a Colibri Aggregator component for the writing of the file and finally start the iterator. The steps to do this:
- Create a Panel component and paste the filepath of the folder location for saving the data.
- Create a Colibri Aggregator component.
- Connect the panel with the filepath to the ‘folder’ input, the ‘inputs’ output of the Colibri Inputs (Iterator) to the ‘inputs’ input, the output of the Colibri Outputs to the ‘output’ input and the output of the Colibri Image Setting to the ‘Image Setting’ input.
- Create a LBFalseStartToggle component and connect it to the ‘write?’ input of the Colibri Aggregator.
- Double click on the toggle to write the CSV file. Then, disconnect the Colibti Iteration Subdomain from the ‘selection’ input of the Colibri Inputs (Iterator) and double click on the ‘fly’ button to start the iteration and data writing of all room variations.
Possible Errors
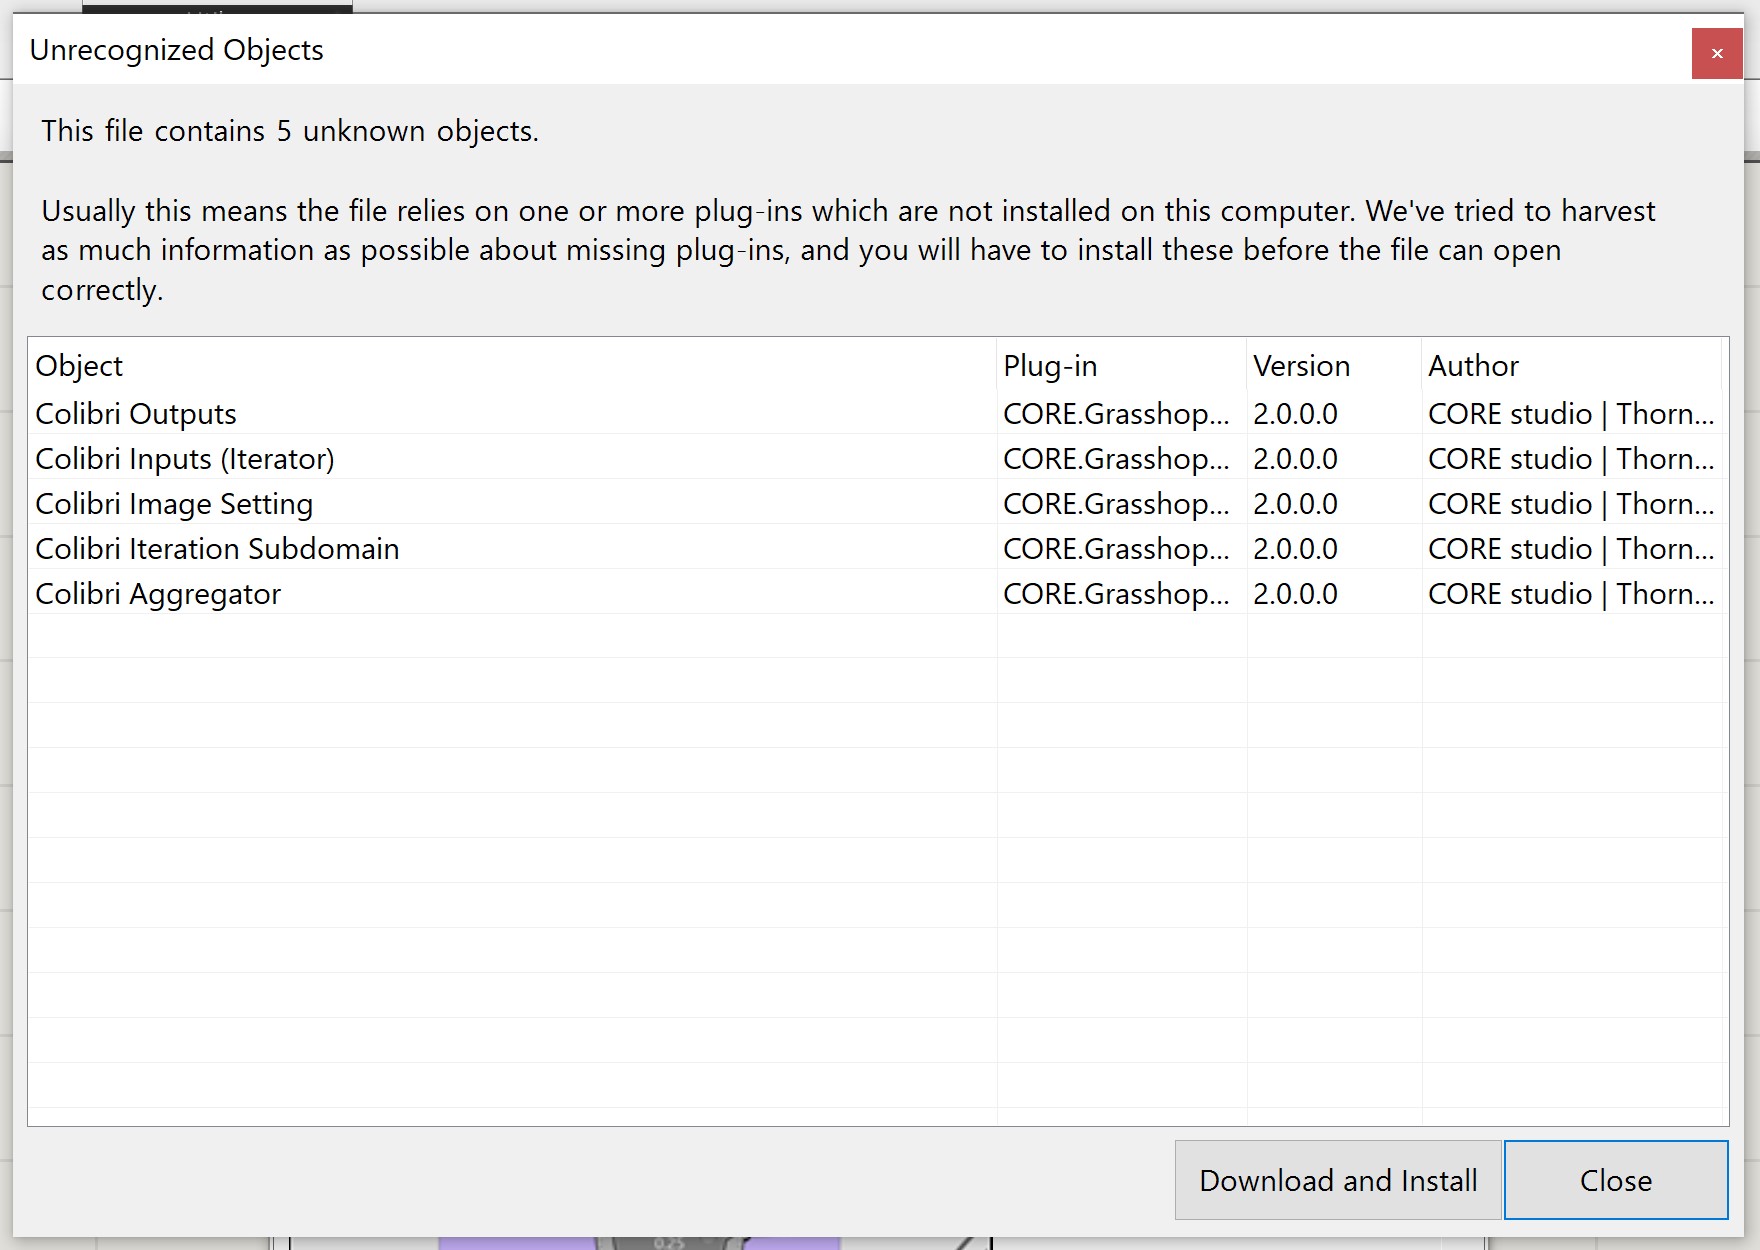
A possible error encountered with the latest Rhino 8 update is that Grasshopper may not recognize the installation of Colibri 2.0 when opening the file you are working on. A quick solution is to close the grasshopper file you were working on, install Colibri again and then with Rhino still open, open your grasshopper file and continue your work.
Generating a Dataset in Grasshopper 14/14
Conclusion and Download Fileslink copied
In this tutorial you learned how to create a data set by putting together a parametric model in grasshopper with numerous variations, analyzing those variations, assigning a label, and saving the data. The data gathered can then be imported to a Jupyter notebook and used to train a ML model. After following this tutorial, you created a data set and exported it into a CSV file (can also be opened in Excel). You can now proceed with opening the CSV file into a Jupyter notebook to train a ML model.

Grasshopper File
You can download the script and the CSV file with the data here.
Useful links
Colibri 2 plugin download: https://www.food4rhino.com/en/app/colibri#downloads_listIntroduction video
Tutorial to Colibri: https://www.youtube.com/watch?v=GyqAZDyTWZw
Write your feedback.
Write your feedback on "Generating a Dataset in Grasshopper"".
If you're providing a specific feedback to a part of the chapter, mention which part (text, image, or video) that you have specific feedback for."Thank your for your feedback.
Your feedback has been submitted successfully and is now awaiting review. We appreciate your input and will ensure it aligns with our guidelines before it’s published.
