K-Means Clustering GH Boxes
-
Intro
-
Dataset creation
-
Clustering by box dimensions
-
Visualizing the Clustered Results
-
Clustering the Boxes Based on Different Features
-
Conclusion
Information
| Primary software used | Grasshopper |
| Course | K-Means Clustering GH Boxes |
| Primary subject | AI & ML |
| Secondary subject | Machine Learning |
| Level | Intermediate |
| Last updated | February 25, 2025 |
Responsible
| Teachers | |
| Faculty |
K-Means Clustering GH Boxes 0/5
K-Means Clustering GH Boxes
K-Means Clustering GH Boxes 1/5
Dataset creationlink copied
First you create a basic dataset. In this tutorial, we create 100 randomly sized boxes using a random point generator. These 100 boxes will serve as our data set.
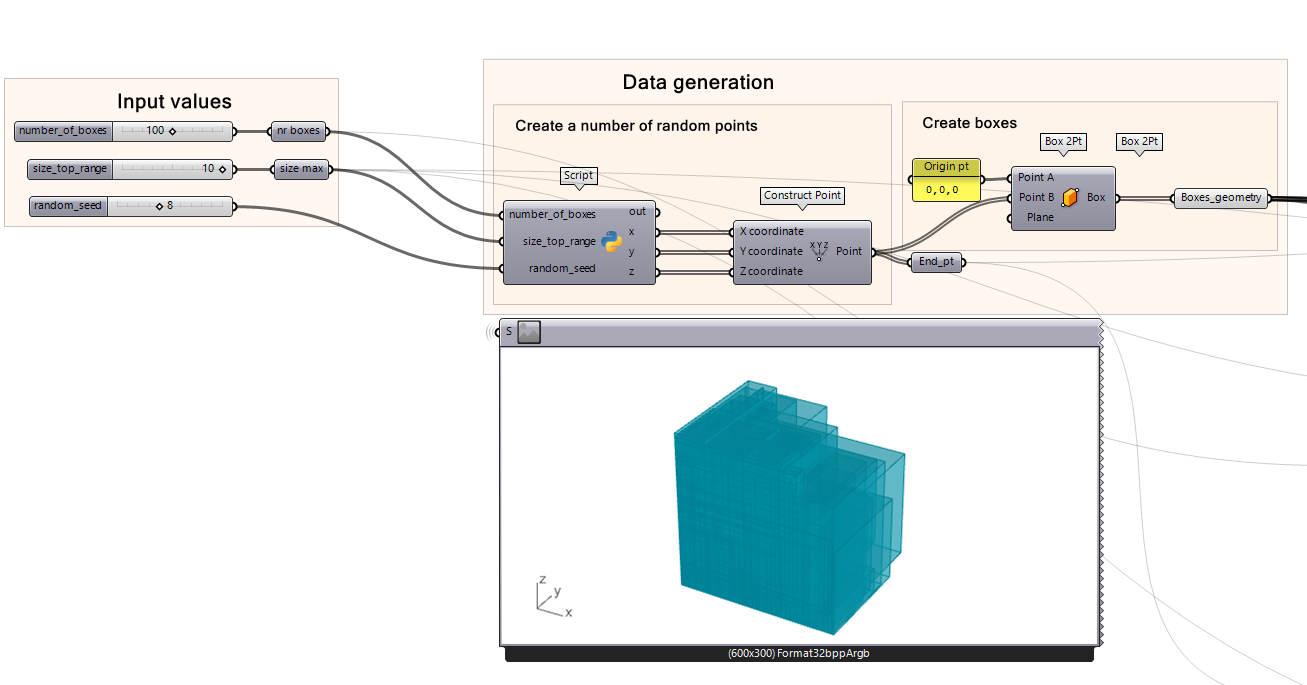
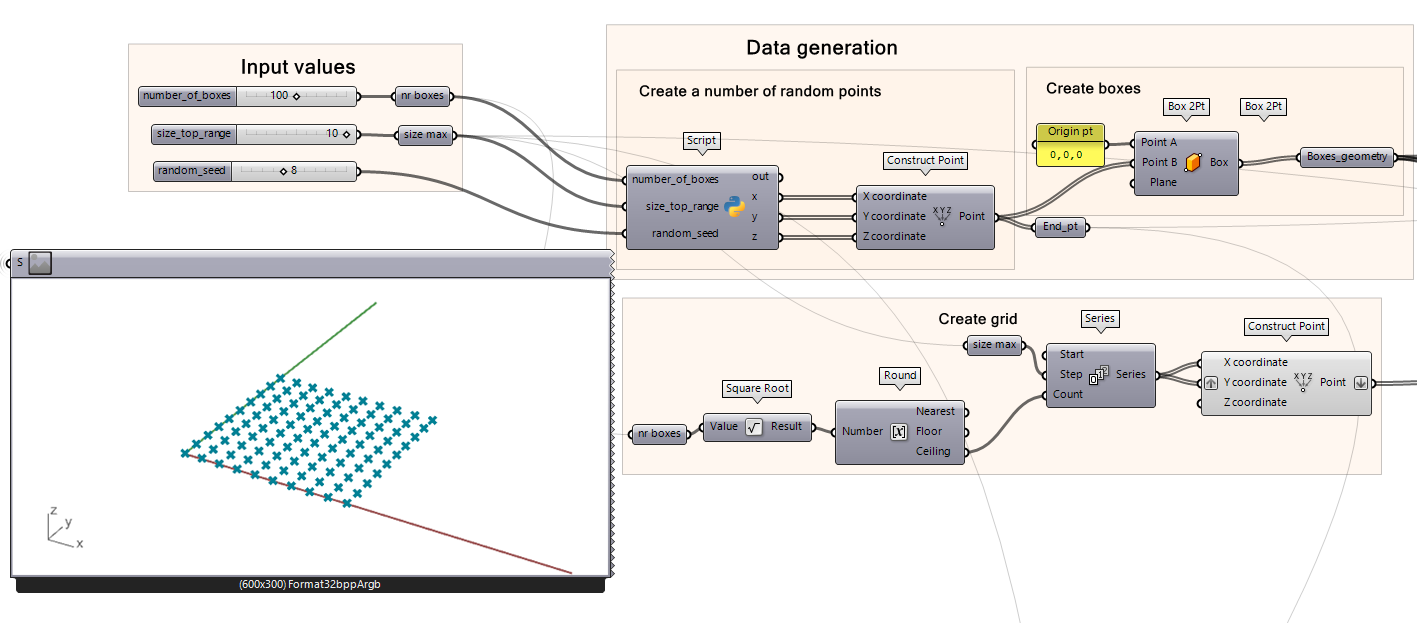
To create the boxes, first create 3 Number Sliders for the inputs. In this case we define the number of boxes, the maximum size of each box and the random seed. A random seed is a starting value used by the random number generator algorithm to generate a random sequence of numbers. Next, place a Python 3 Script component containing the script that generates x, y, and z coordinates. With those coordinates, points are constructed. With the 100 randomly constructed point a box can be created from the origin. This will result in 100 boxes located on the origin with different shapes and sizes.
-
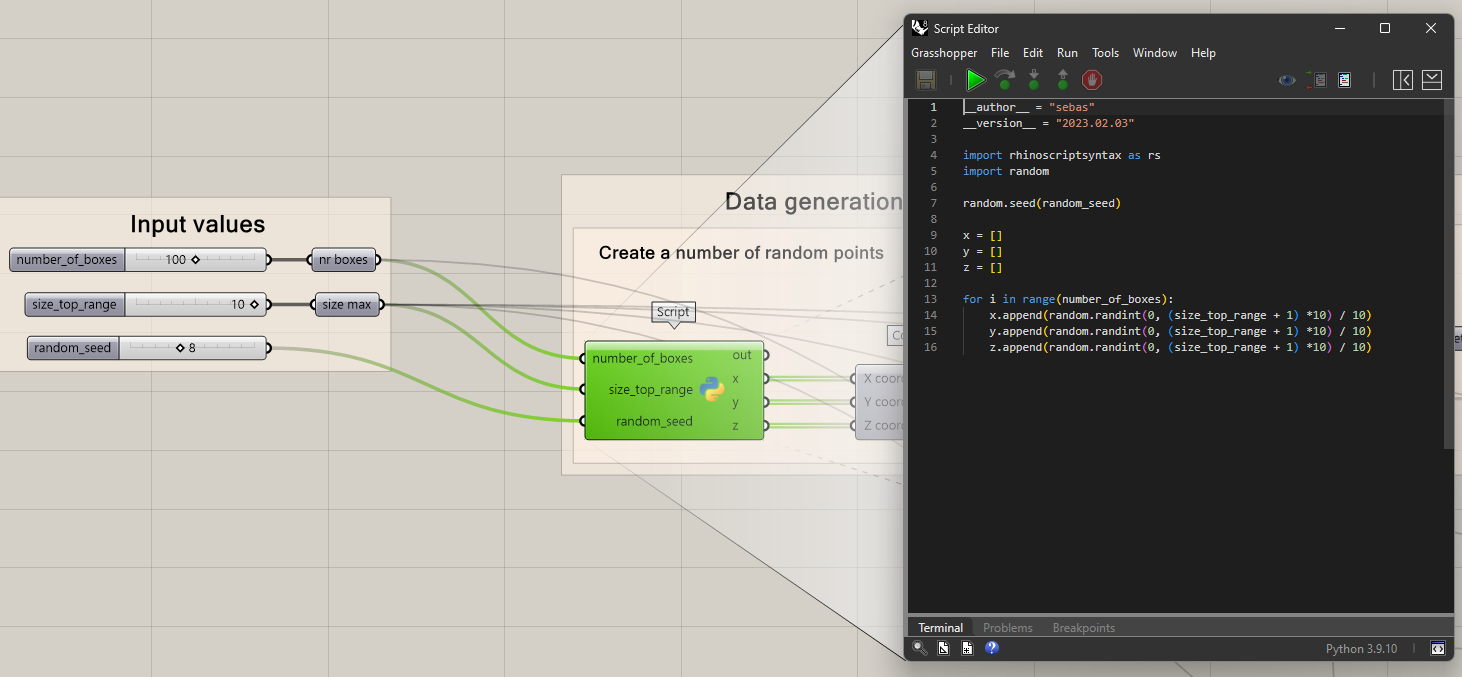
Create 3 input sliders.
-
Add a Python 3 Script component.
-
Adjust input and output names of the Python 3 Script component by right-clicking on them. You can create more input variables by clicking on the “+” plus sign when you zoom in to the component.
-
Double click Python 3 Script component and paste the code provided in the tutorial Python Code Setup.
-
Construct points by connecting the x, y, and z outputs into the Construct Point component.
-
Construct boxes from origin by connecting the outputs of Construct Point into the Box 2Pt found under Box 2PT, which creates a box from two defined points. In our case, the first point is the origin (0, 0, 0).
Python Code Setup
The Python 3 Script generates boxes based on the code below. The script generates random X, Y, and Z coordinates where boxes will be placed and repeats this until it has created the correct number based on the number_of_boxes input.
First, we import the libraries needed to run the script, which are rhisnoscriptsyntax and random.
We define the variables by right clicking the inputs on the Python 3 Script component and renaming the input. You can zoom into the component until you see a small “+” icon to add a third input.
- ‘random_seed’: An integer to initialize the random number generator.
- ‘number_of_boxes’: The total number of boxes you want to create.
- ‘size_top_range’: The maximum value of the length of any side.
The random.seed(random_seed) ensures that the random numbers generated are reproducible. If you use the same random_seed value, you’ll get the same sequence of random numbers each time. We then create three empty lists for the center point of each side, x = [] y = [] z = []; These lists will be used to store the randomly generated x, y, and z coordinates for the boxes. We then make a loop using the for I in range(number_of_boxes) which starts a ‘for loop’ that iterates number_of_boxes times. Each iteration will create coordinates for one box. Finally, the random.randint(0, (size_top_range + 1) *10) generates a random integer within a range determined by size_top_range then scaled down by dividing it by 10. The generated values are appended (added) to their respective lists. The outcome is a list of numbers for x, y, and z to be used for locating the boxes.
import rhinoscriptsyntax as rs
import random

random.seed(random_seed)

x = []
y = []
z = []

for i in range(number_of_boxes):
    x.append(random.randint(0, (size_top_range + 1) *10) / 10)
    y.append(random.randint(0, (size_top_range + 1) *10) / 10)
    z.append(random.randint(0, (size_top_range + 1) *10) / 10)
These random coordinates are used as an input to first create a coordinate and then to create a 2-point box using these points as the corner that is placed opposite the origin.
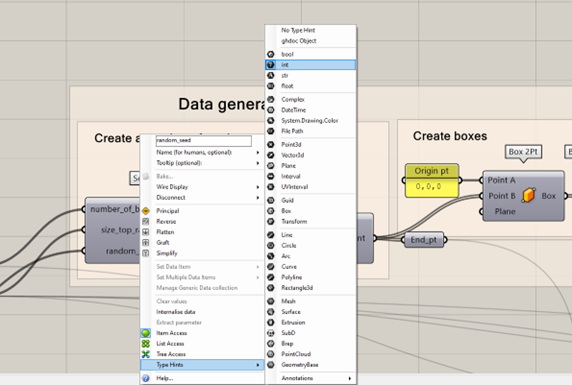
Note: When you write your own Python 3 Script component, make sure to rename the inputs and outputs accordingly. It is also important to right click the input and check that the access is set correctly (between item access, list access, and tree access) and that the type hint is correct, if applicable. In this tutorial, we will work with integer values. Therefore, the type hint selection should be “integer”.
For more information refer to tutorial –>GHPython Introduction.
Boxes on grid
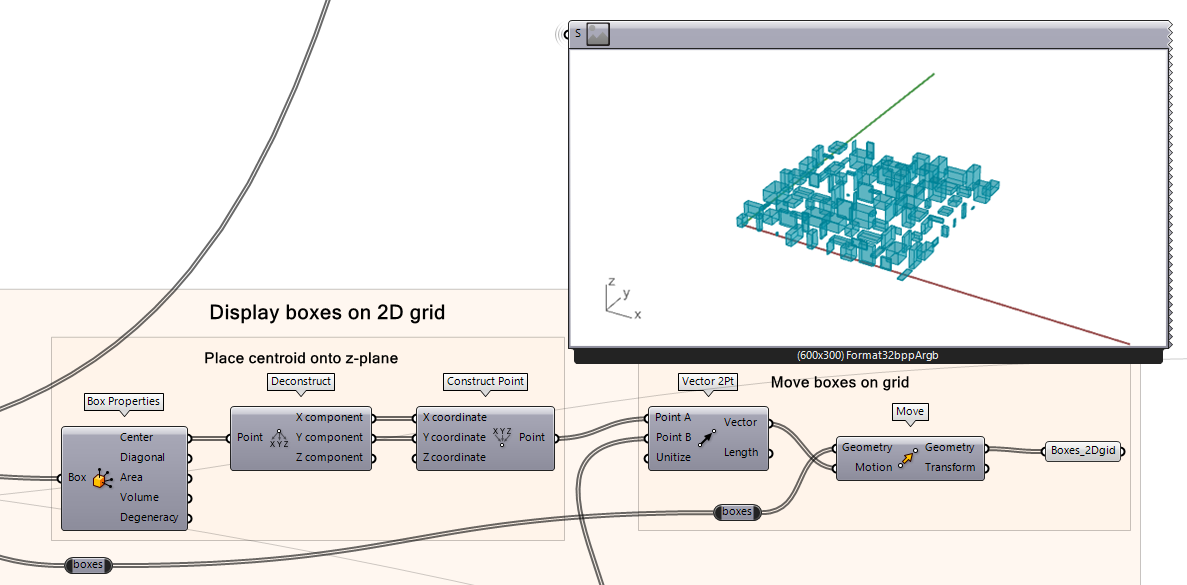
To visualize the box variations, the boxes can be placed on a 2D grid. Placing different box variations on a 2D plane using a grid of points allows for each box to be positioned so boxes do not overlap. This step is only for visualization purposes, so it is possible to see the data we are working with.
-
First, create a 2D grid based on the number of boxes and their maximum size. The grid will be set-up based on the input Number Sliders that you placed earlier in the script to create the boxes, therefore, the grid will adjust when you are changing the input.
-
Connect the number_of_boxes slider to a square root function component and round up the result to find the needed grid size.
-
Using a series component to create the points at the correct location. The size_top_range slider will be connected to the Step input and the Ceiling output from the Round component will be the Count input.
-
The series is now the input for the x and y coordinates in the construct point component to create a grid. Don’t forget to graft the Y-coordinate input when constructing points.
Then we move all the boxes from their centre point to each point to populate the entire grid with the boxes.
-
First we need to find the centre points of each box and placing each centroid on the world Z-plane. Using the Box Properties component you can get the Centre of the box as an output which in can be deconstructed using Deconstruct and then reconstructed using the Construct Point component. That newly constructed point from the centre of the box will be used for creating a move vector.
-
Then, we use the Vector 2Pt component, which moves 1 point to target point for all 100 items. In this case we create a vector from the center of box to the point on a grid by taking the first point from center of box to each of their respective point on the grid.
-
Lastly, with a Move component we can move the box geometries to the points on the grid using the vectors we created.
-
Note: save the output of the Geometry “Boxes_2Dgrid” which will be used later for previewing the clustered results.
K-Means Clustering GH Boxes 2/5
Clustering by box dimensionslink copied
Clustering is a machine learning method that organizes similar data into groups based on characteristics that are defined by the individual using the algorithm. The characteristics are called features.
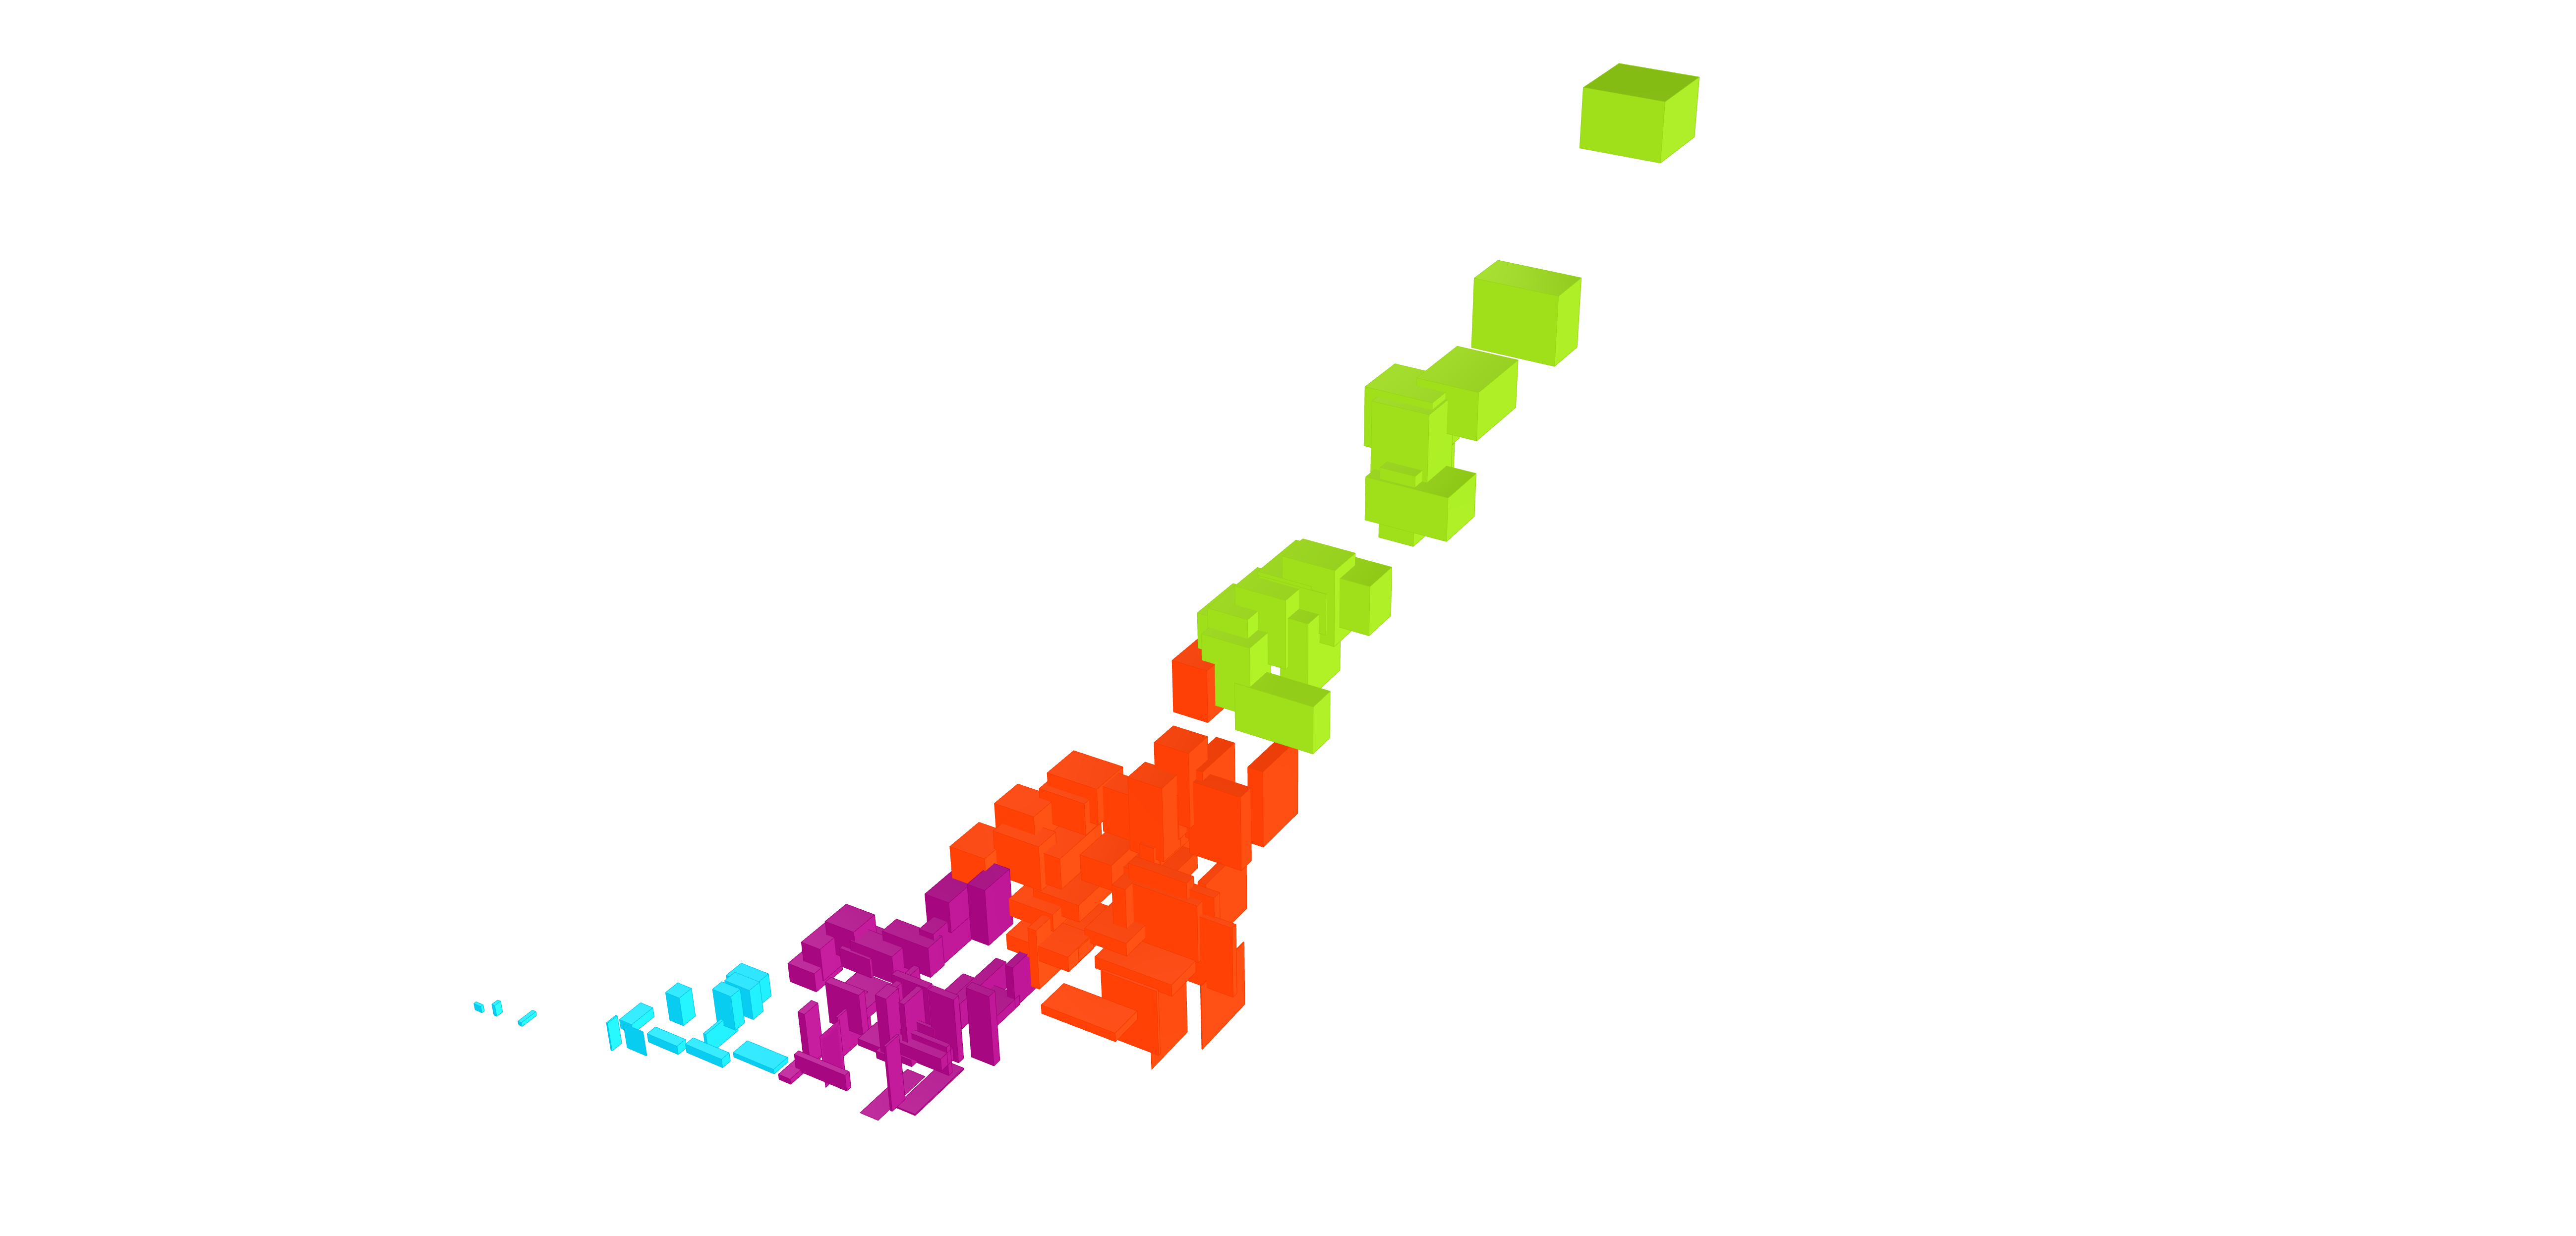
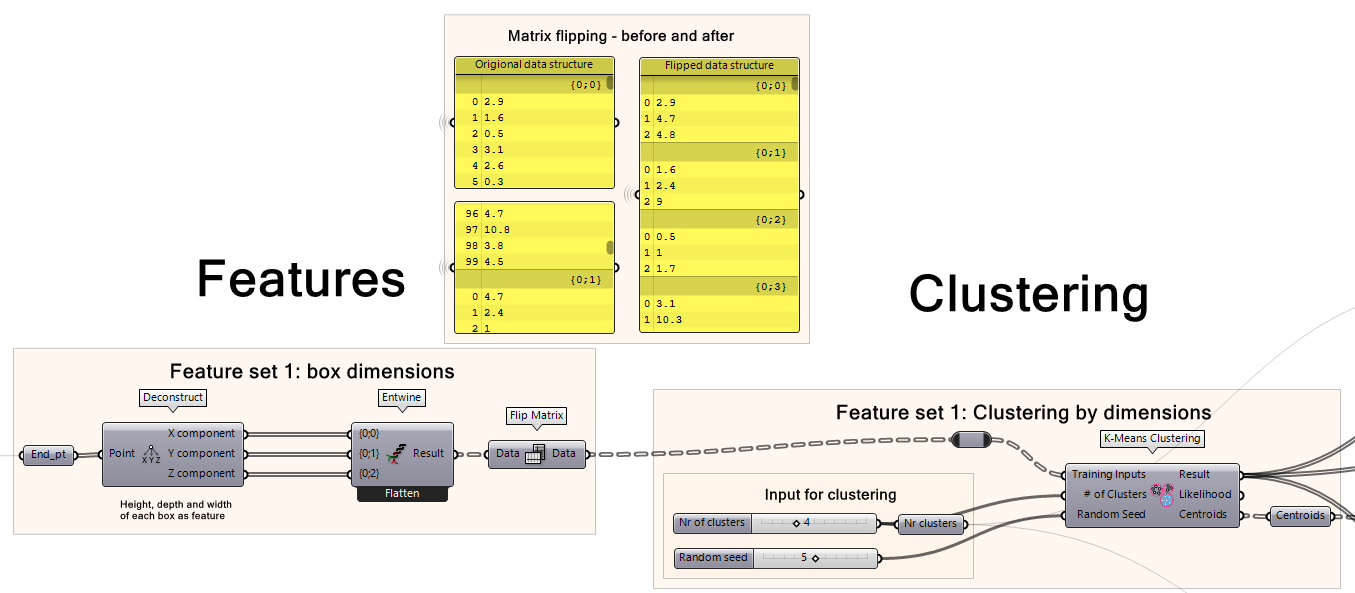
To show how the clustering works we will be clustering the boxes based on their dimensions. The dimensions of the box along the X, Y, and Z axis are our features. The algorithm will cluster the boxes together with others that have similar features. We need to take the following steps.
-
First, we take the points from each box and entwine those to a list. But before clustering, we need to flip the matrix. This is because initially, the data is structured as a tree where each branch is equal to one coordinate so branch [1,0] contains all the X coordinates, branch [2,0] contains all the Y coordinates, and branch [3,0] contains all the Z coordinates. Instead, we want each branch to define one cube and to list the X, Y, and Z coordinates of that one cube. Flipping the matrix restructures the data in this way because it takes item 0 of branches [1,0] [2,0] and [3,0] and places those as items 0, 1, and 2 of the first branch. It then continues down the lists and combines all the item 1s and so on.
-
Then, each box’s coordinates is plugged into LunchBox’s K-Means Clustering component as the Training Inputs. The component will group similarly-sized boxes to one another. You can define the number of clusters you want, for example 4 clusters. The random seed here is to initiate the random number sequence and can be assigned to any random number.
K-Means Clustering GH Boxes 3/5
Visualizing the Clustered Resultslink copied
To view how the algorithm clustered the results, we can use a color gradient and impose that on the geometry we have created from the dataset (the 100 boxes). We can also move similarly sized boxes next to each other on the grid.
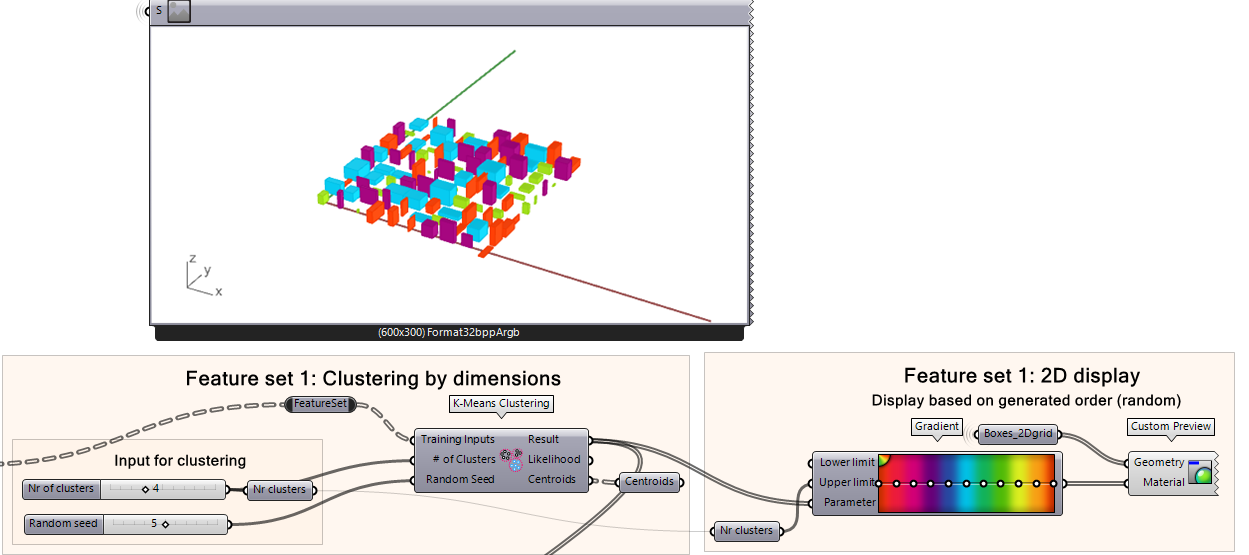
To view the clustering results:
-
Plug your K-Means Clustering Result output into the Parameter input of Gradient.
-
Plug the number of clusters in the Upper Limit input of Gradient.
-
Plug the “Box_2Dgrid” data into the Geometry input of a Custom Preview component.
-
Plug the output of the Gradient into the Custom Preview.
If we look at the results here, can you tell how the algorithm arranged the boxes? Because the boxes are laid out on a 2D grid, we can sort of tell what the logic is behind the clustering, but it is not very clear.
Visualizing Clustering Results in 3D Based on Similarity
Let’s re-organize the boxes to visualize the boxes from the same cluster physically near each other in the model. This will make seeing the boxes easier than to just randomly placing them on a 2D grid.
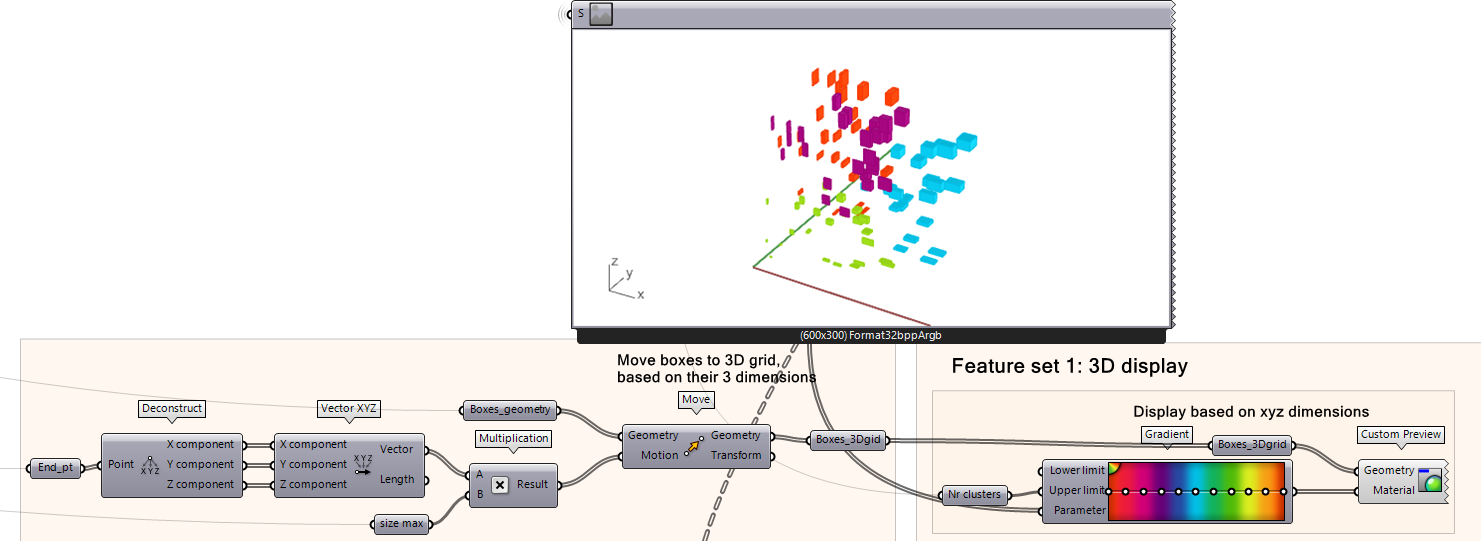
This script (Move Boxes to 3D Grid based on their Dimensions) organizes the boxes according to their sizes (see below).
To move the boxes in their correct position, we do the following:
-
Use Deconstruct to extract the end points to their respective x, y, and z coordinates
-
Get the XYZ Vector by using the component VectorXYZ.
-
Multiply the vector by the maximum size of the box, then use that as the vector input for the Move component.
-
Now plug the output of the geometry into the custom preview similar to view the color-coded clusters.
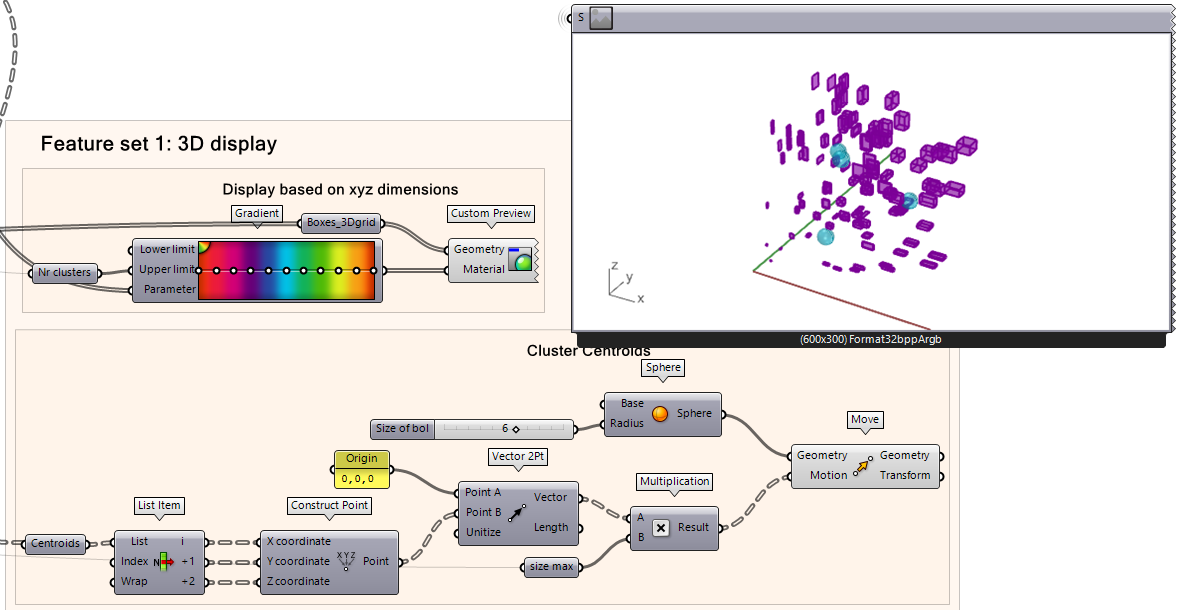
We can also visualize the centroid of each cluster.
To visualize the centroids of the clusters:
-
Take the output of Centroids from the K-Means Clustering component as the input of a List Item component. In this example, we have 3 clusters, so we separate each cluster by their item index value (i, +1, +2, etc.)
-
Construct a point based on the centroid of each cluster.
-
Create a Vector 2Pt component where point A is an origin point of 0,0,0 and point B is the centroid point. Multiply it by the maximum size of the box, then plug the results as a Motion vector input for a Move component.
-
Create spheres with the Sphere component and plug that geometry into the Move component’s Geometry input.
Play around with the number of clusters and the random seed. You will notice that the random seed sometimes assigns a box in two different clusters depending on the random seed state. This is because it is a local minimum and it does not settle with the same answer in all cases and it may not be the global optimum (something to be aware of).
K-Means Clustering GH Boxes 4/5
Clustering the Boxes Based on Different Featureslink copied
Feature engineering is an important part of using machine learning methods. A machine learning model can only train on the information that you provide in the form of data. Selecting enough features and meaningful features will give better results. You can read more about it in the Feature Engineering tutorial.
In this case, we only have certain features we can extract from boxes. The boxes are also randomly created and therefore have no pattern on which the algorithm can distinguish them. In this second part of the tutorial, we will extract other features from the boxes to show how features impact the way they are clustered. When selecting features for your project, ensure that you review how to select meaningful features.
The new feature set will be called “Feature Set 2”. We will explore different ways to describe the features of the boxes aside from simple dimensions.
Feature Set 2
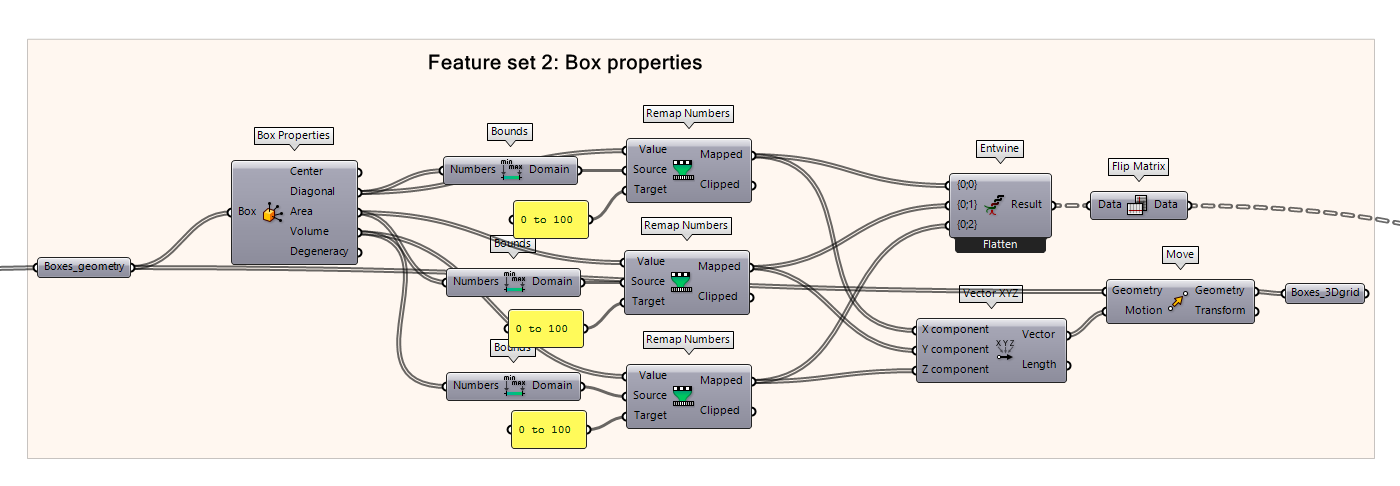
This following script uses the Box Properties component as was used in Feature Set 1. But instead of taking the center of the boxes, we take:
- Box diagonal
- Box area
- Box volume
Because we have multiple features, we need to first re-map the values from 0 to 100 and entwine the data as a tree structure for the clustering.
-
First, plug the feature into a Bounds component found in Bounds. This will create a domain of the features from 0 to 100.
-
Then using the Remap Numbers component, add the feature input from Box Properties into the Value input of Remap Numbers. Then, add the new Bounds Domain output into the Source input. Add the target range from 0 to 100 using a panel “0 to 100”. This will effectively map the features into a range from 0 to 100. Do this for every feature!
-
Entwine the data, then flip the matrix (explained earlier in the tutorial why that is important) and that will be our input for the Training Input in the K-Means Clustering component.
Final step for visualization is to the data based on their features. To do that:
-
Take the Mapped feature from Remap Numbers into a Vector XYZ component.
-
Use that as a motion vector in a Move component, adding the Boxes_geometry as input. This will organize the boxes based on their features which will be used for displaying the clustering results via the Custom Preview later on.
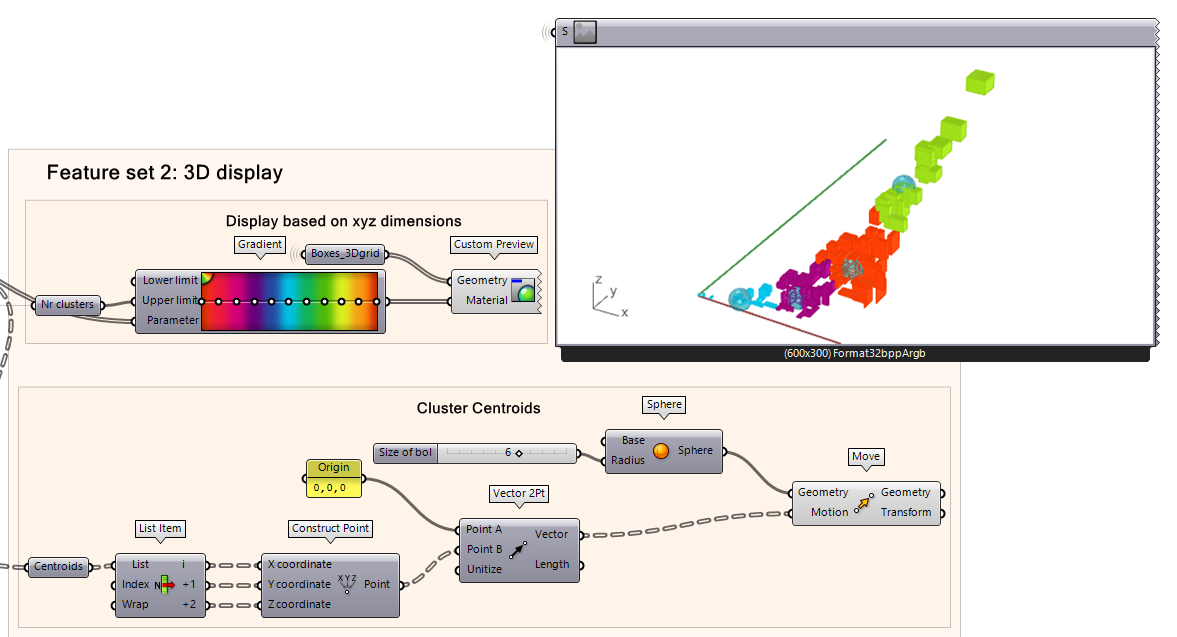
We notice that the spacing of the boxes is not as even as it was from “Feature Set 1” which tells us about our feature selection for this one and the dataset and they are somewhat correlated judging from how the features grows at the same rate. Perhaps this is not the best features to be used for clustering our data. Orbit around the viewport to inspect the results and play around with the cluster size and seed value. The data is organized on a 3-axis plane representing diagonal size (x), area (y), and volume (z). This is not giving us a lot of useful information here based on their new feature set, perhaps “Feature Set 1” was more suitable. This demonstrates that the clustering results depend on how you describe your geometry (data) and which algorithm you choose. The features are as important as the clustering algorithm.
K-Means Clustering GH Boxes 5/5
Conclusionlink copied
After this tutorial, you understand how to cluster data based on selected features and how feature selection is an important process to get meaningful results.

Final exercise file
Below you can download the final Grasshopper file of this tutorial.
Write your feedback.
Write your feedback on "K-Means Clustering GH Boxes"".
If you're providing a specific feedback to a part of the chapter, mention which part (text, image, or video) that you have specific feedback for."Thank your for your feedback.
Your feedback has been submitted successfully and is now awaiting review. We appreciate your input and will ensure it aligns with our guidelines before it’s published.
