Curve Frames and Arrays
-
Intro
-
Horizontal and Perpendicular Frames
-
Curve Array
-
Distance based Scaling using Remapping
-
Distance-Based Scaling using Graph Mapper
-
Conclusion
Information
| Primary software used | Grasshopper |
| Course | Curve Frames and Arrays |
| Primary subject | Parametric Modeling |
| Level | Beginner |
| Last updated | May 27, 2025 |
| Keywords |
Responsible
| Teacher | |
| Faculty |
Curve Frames and Arrays 0/5
Curve Frames and Arrays
Learn how to array a design along a path and aligning them using frames.
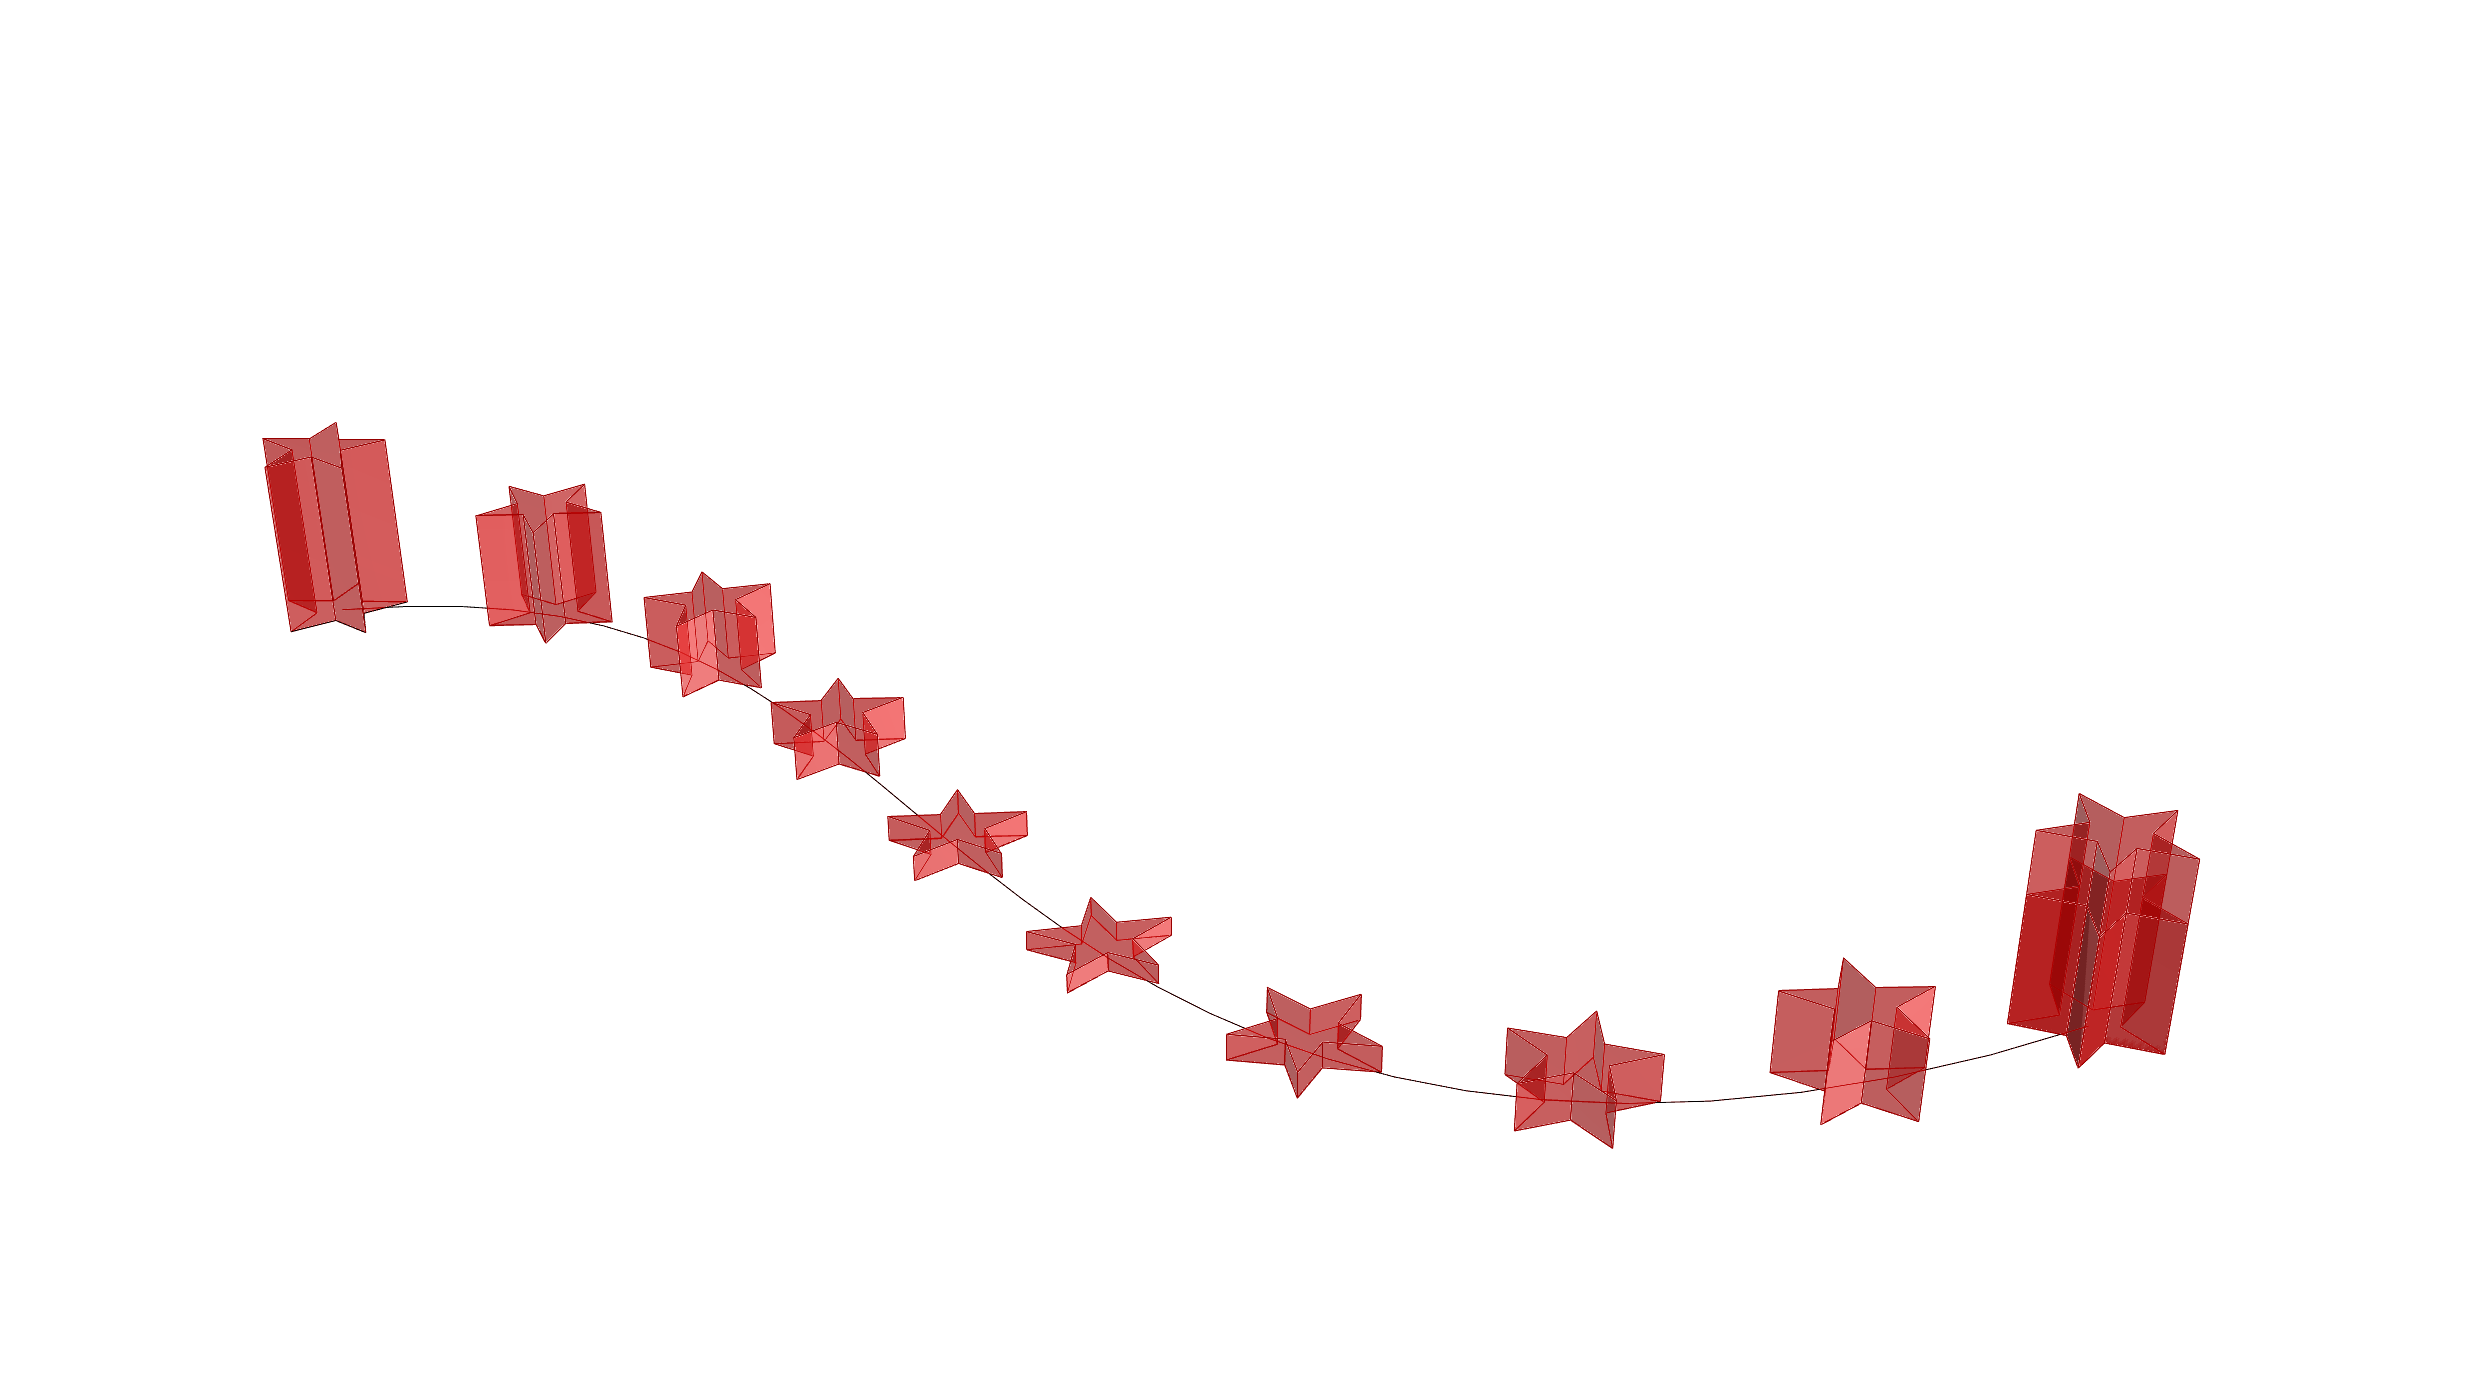
In this tutorial, you will learn using the remap tool in Grasshopper and controlling a set of geometries with the Graph Mapper. In the first section a recap will be given about planes. Next, you will learn some components relating to arrays. Finally, the concept of mapping will be explained.
Curve Frames and Arrays 1/5
Horizontal and Perpendicular Frameslink copied
In this first example, horizontal frames will be demonstrated. There is a difference between dividing a curve and connecting those points with a line versus creating perpendicular lines from the curves. This can be useful in creating stairs along a curve, for example.
Basic Offset method
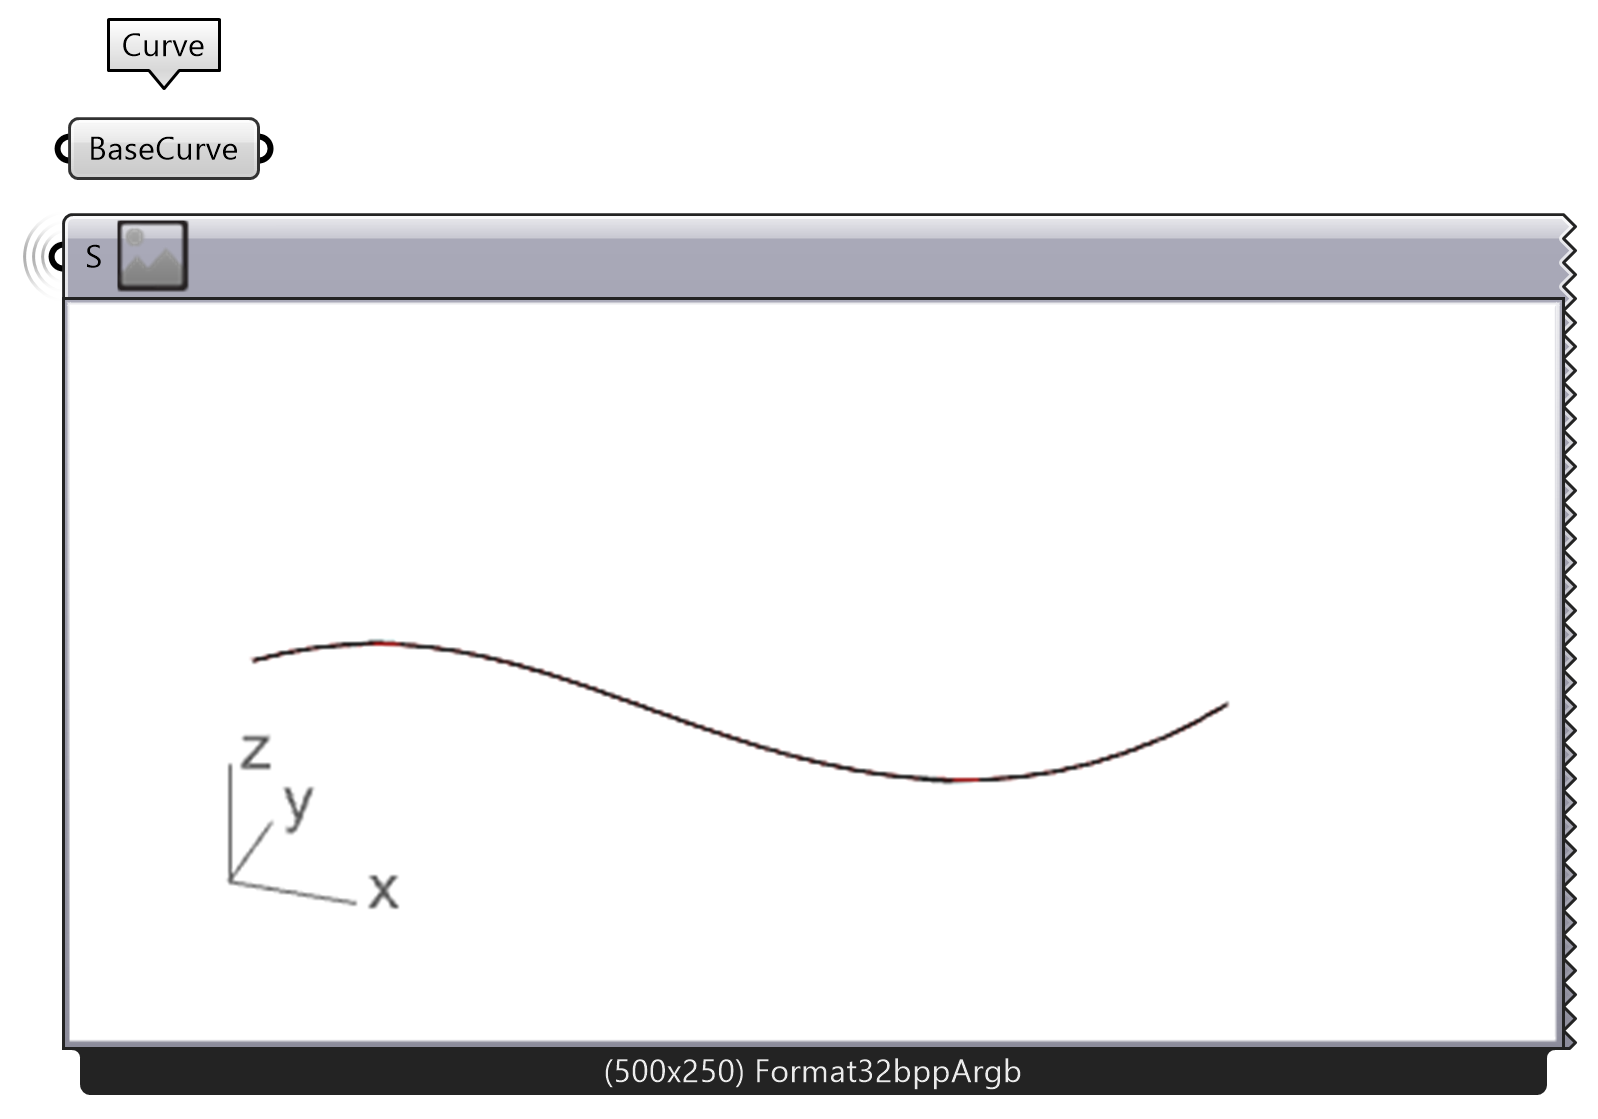
- The first thing we need to do is create a curve in Rhino. Then we add a Curve component in Grasshopper and set the curve in Rhino to the Curve component in Grasshopper by right-clicking and “set one Curve” . You can also rename the component to BaseCurve.
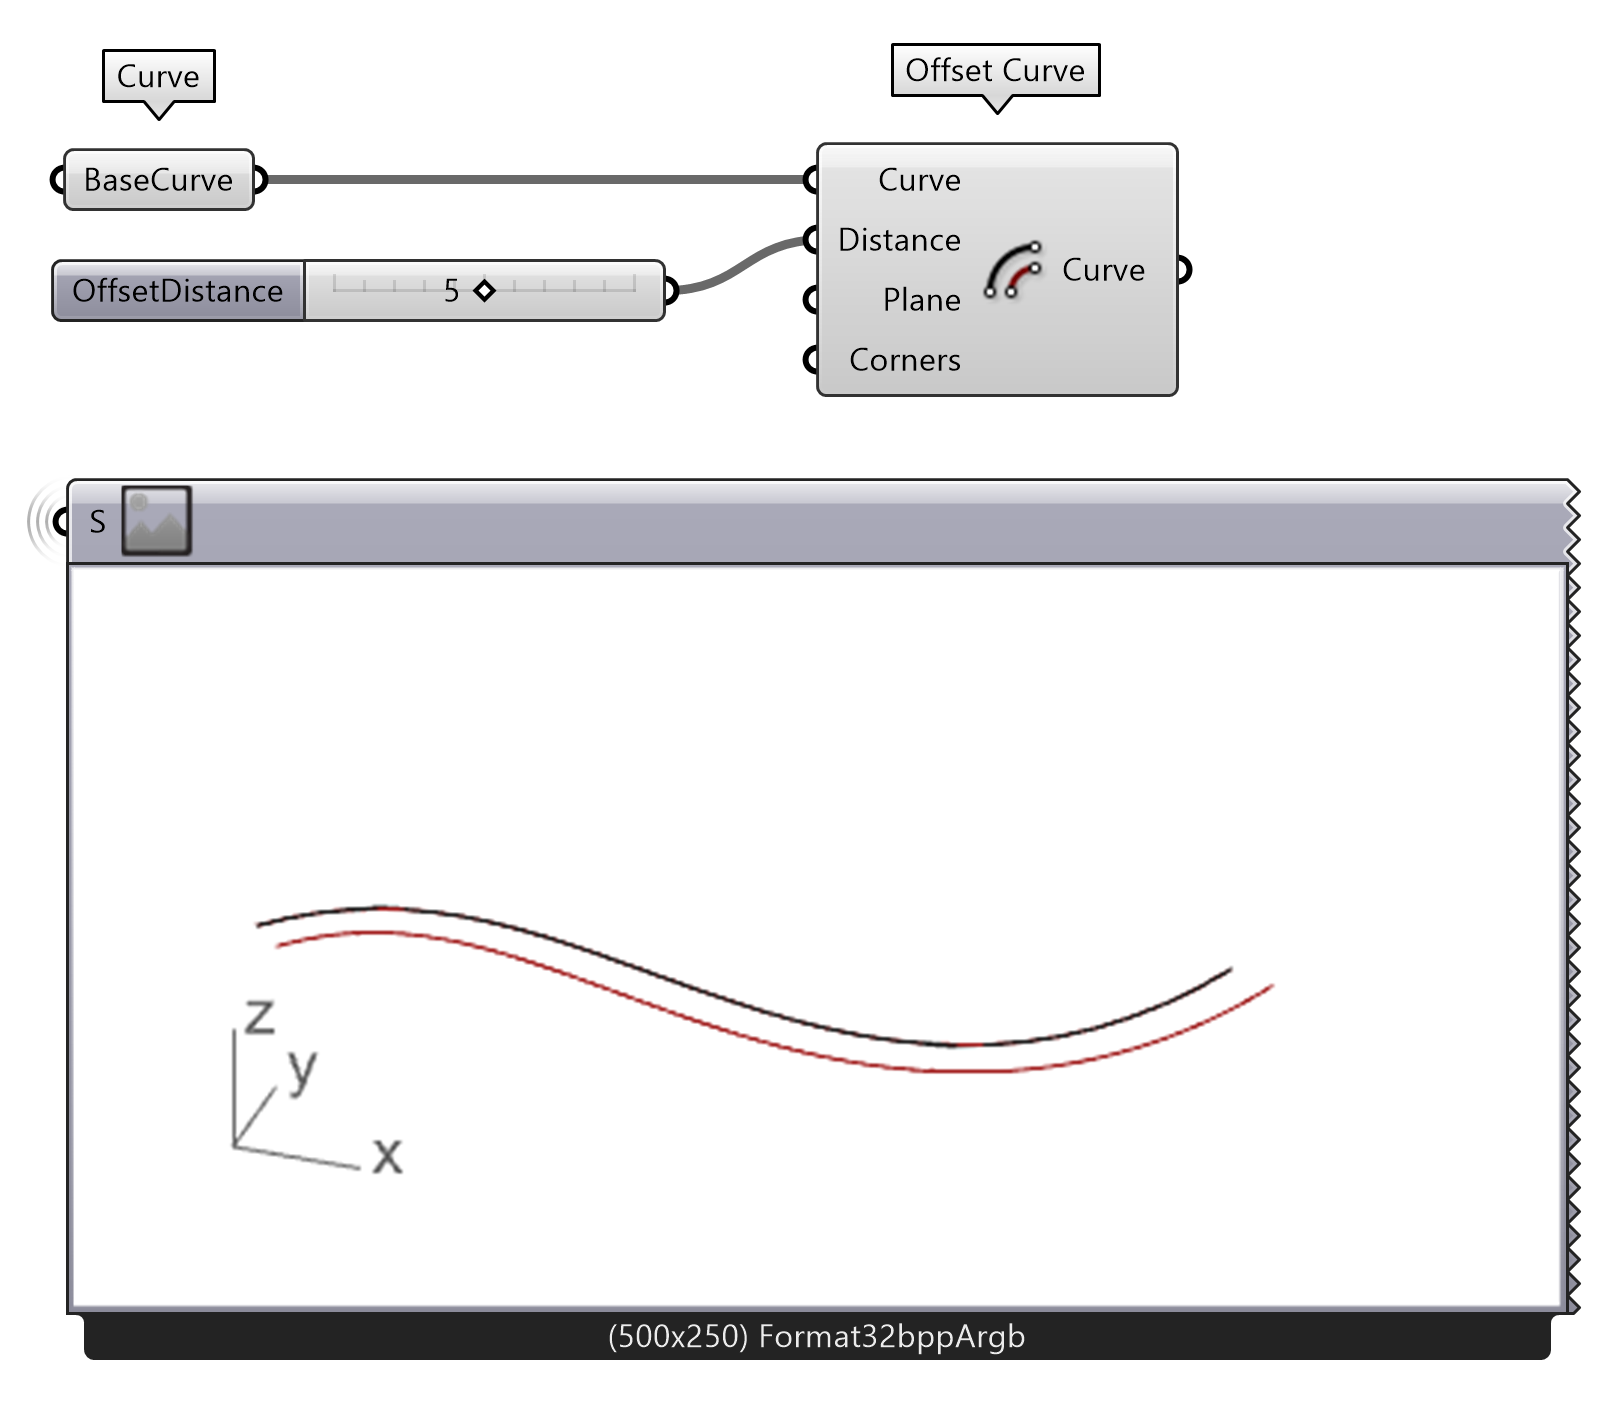
After that, we use the Offset Curve component to offset the curve with a Number Slider for Distance input. Plug the BaseCurve into the Curve input.
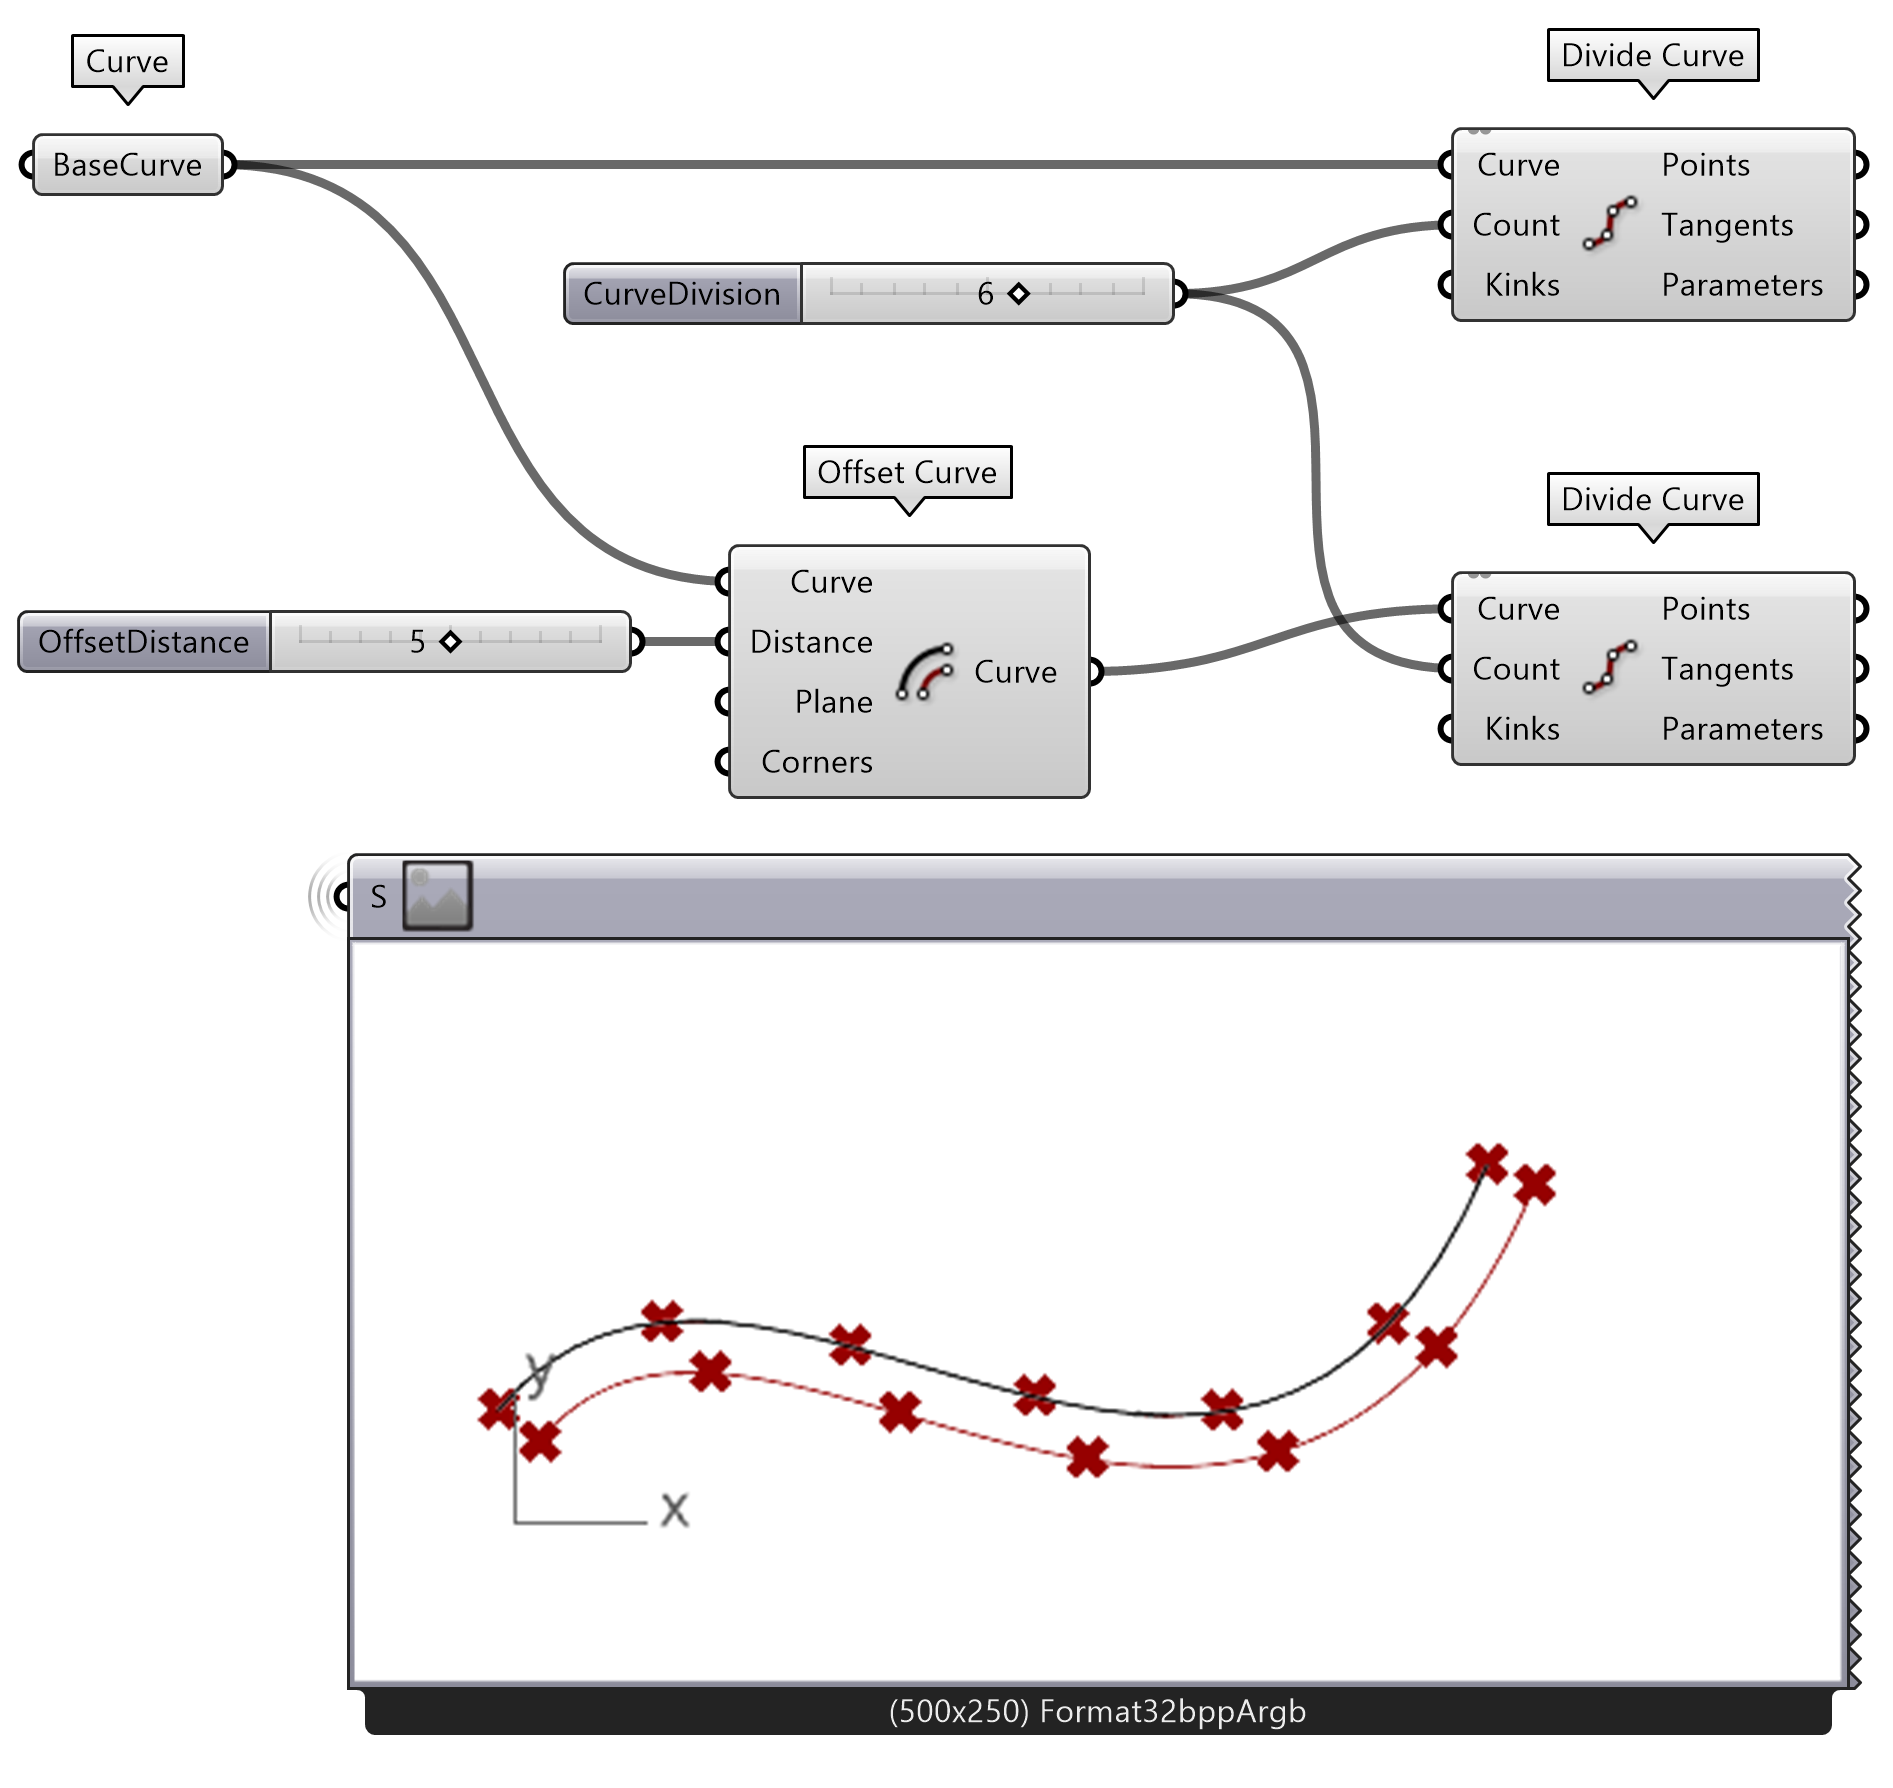
Using the Divide Curve component, we then divide both curves with the same number of divisions using a Number Slider. Plug the Offset Curve output and BaseCurve into the Divide Curve component.
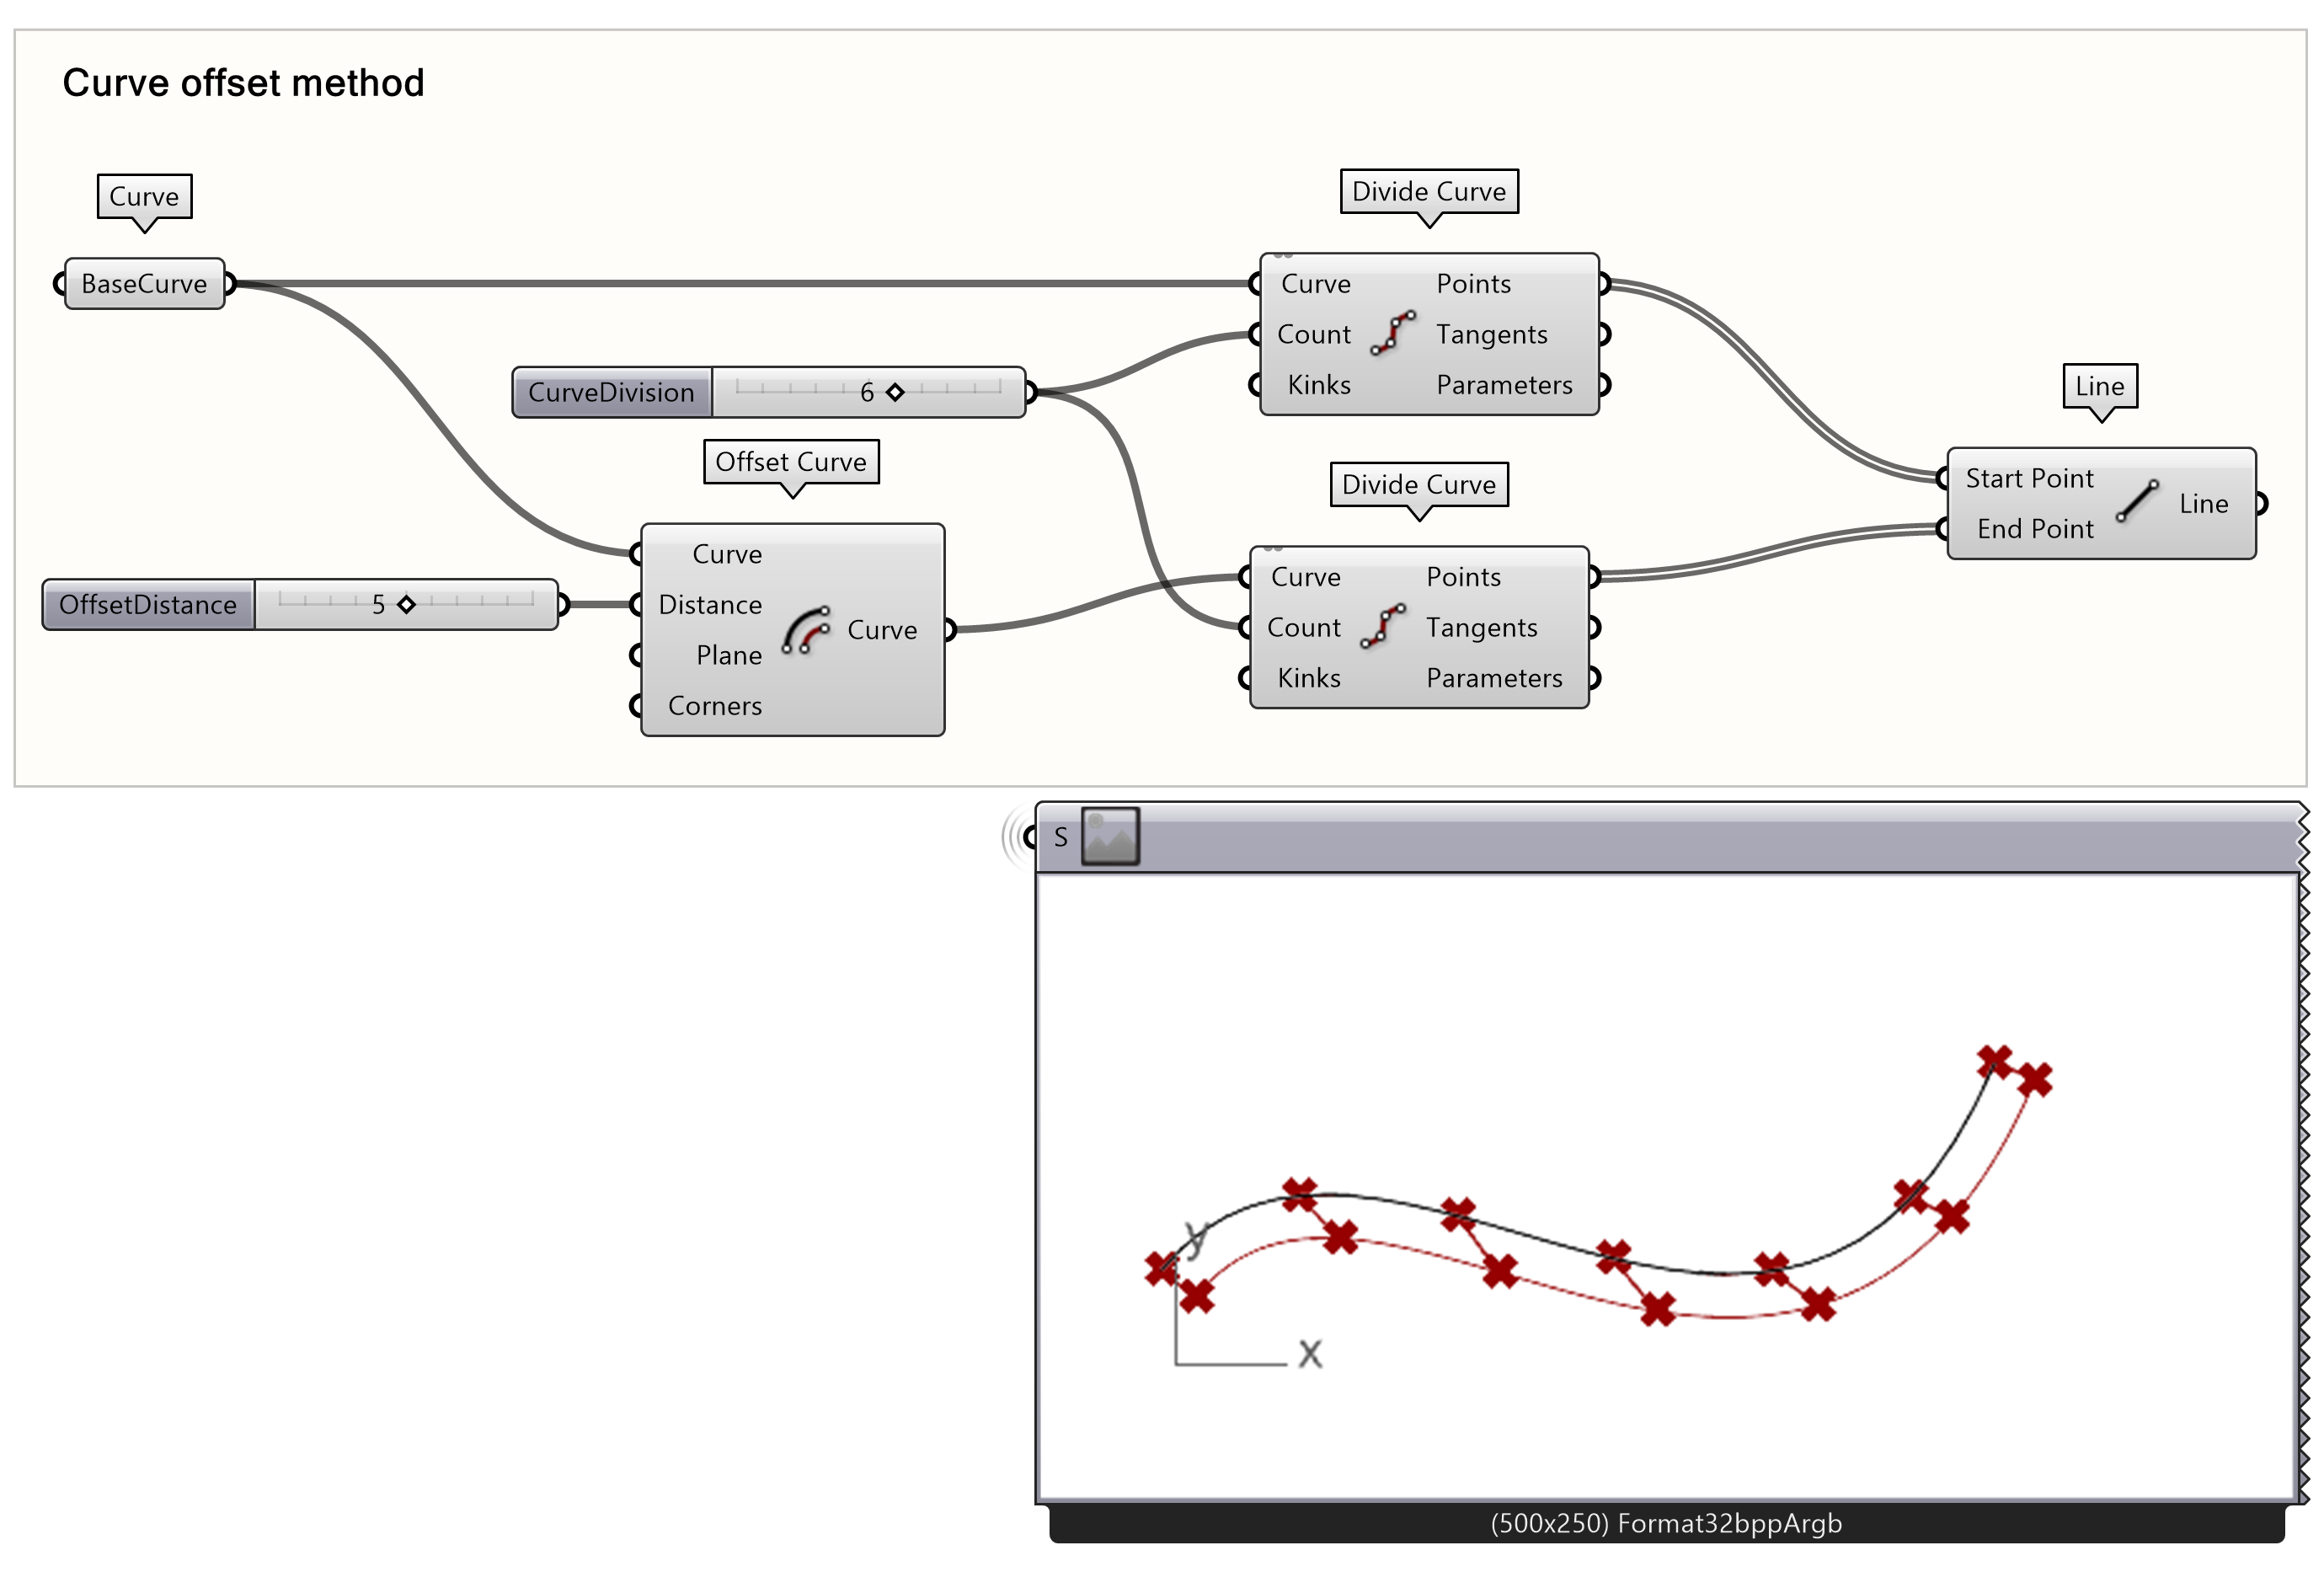
Using a Line component you can connect the two point outputs from Divide Curve. Notice that the connecting lines are not perpendicular. This is because the equal divisions of the curve are not perpendicularly placed across each other.
For more information you can check the following tutorial (access through TU Delft campus):
Using Horizontal Frames
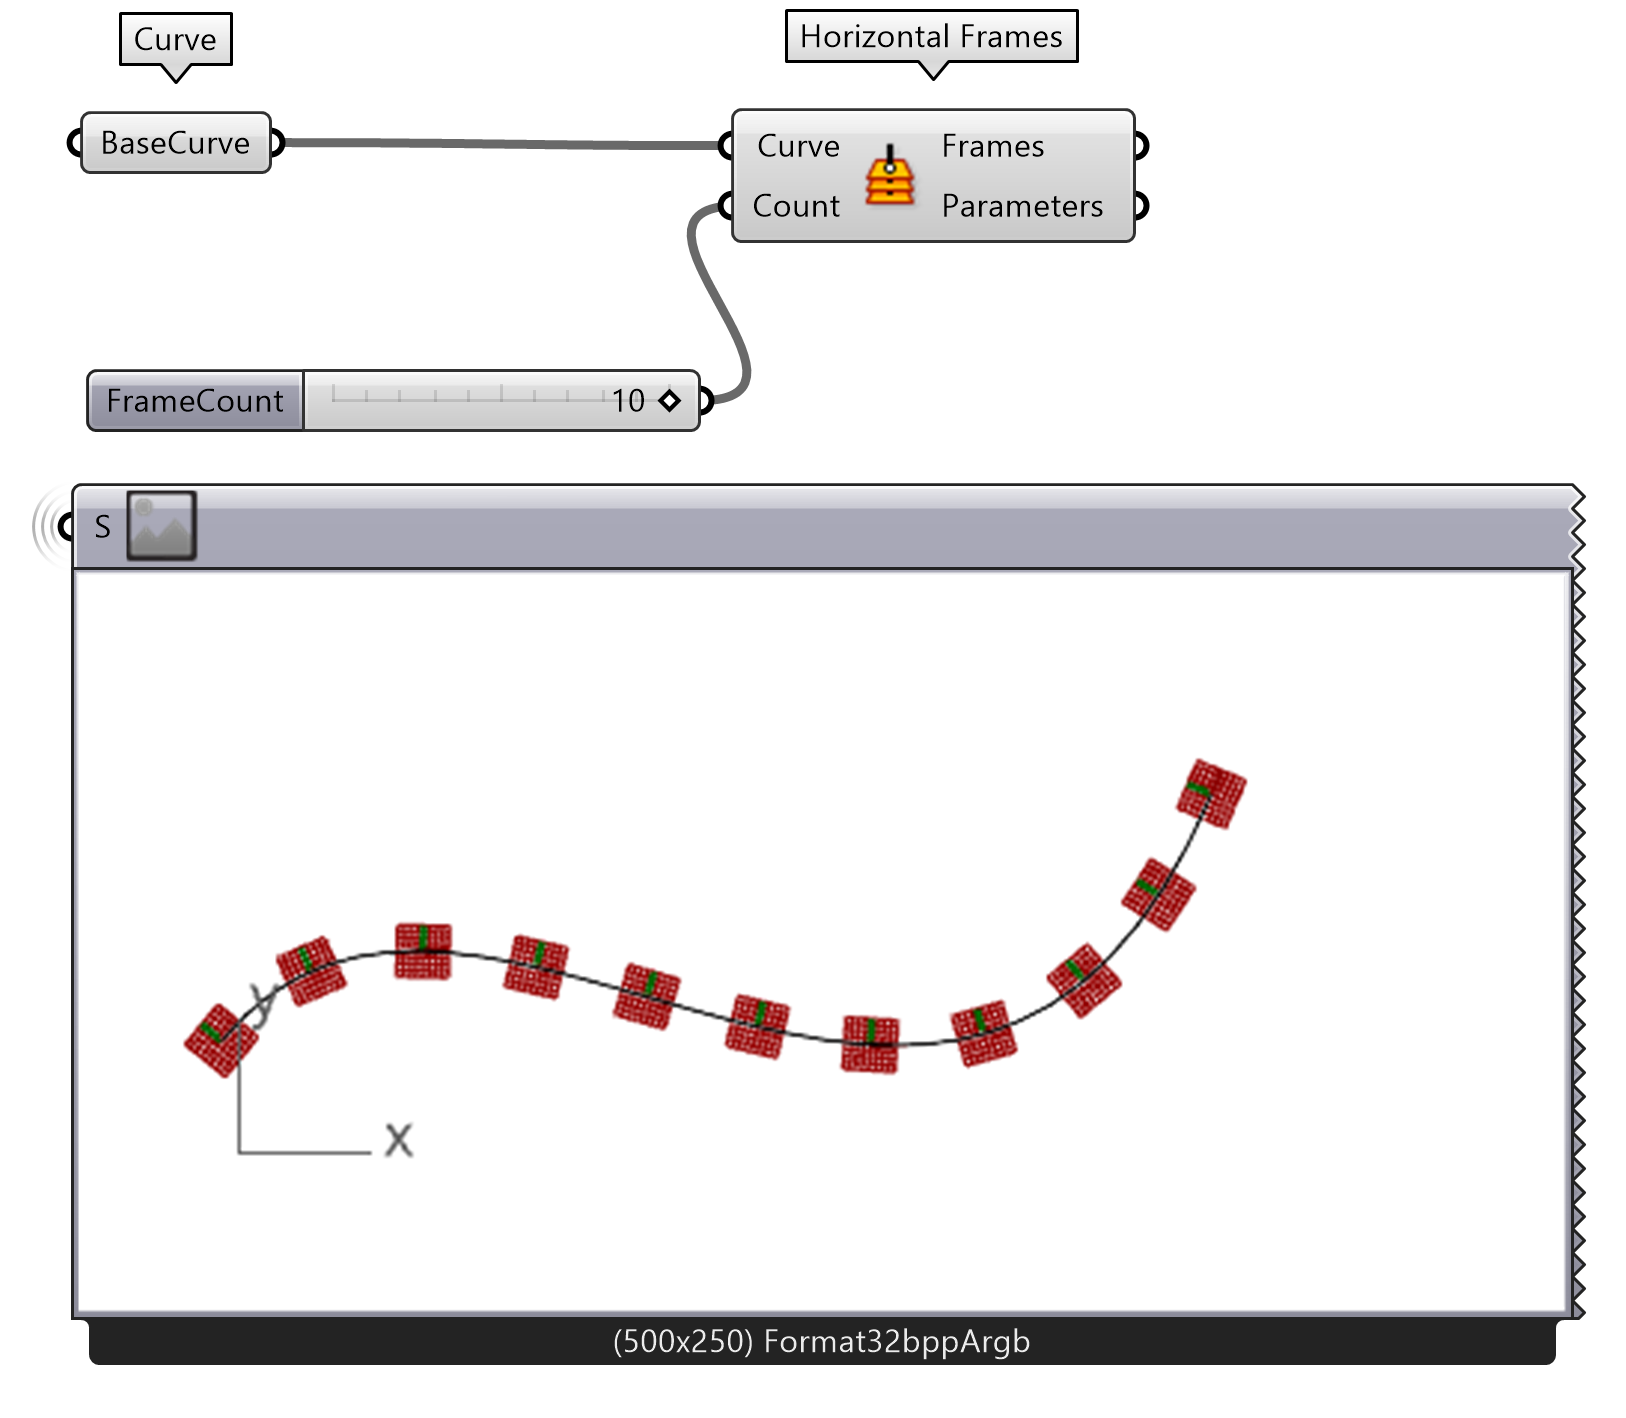
If you want perpendicular lines to the curve, you can use the Horizontal Frames component instead. Instead of returning a point, the Horizontal Frames returns a plane, oriented in the x-direction tangent to the curve and a y-direction perpendicular to the plane. Use a Number Slider or set a number to control the number of Horizontal Frames.
Note: these are called Frames because they are planes derived from geometry.
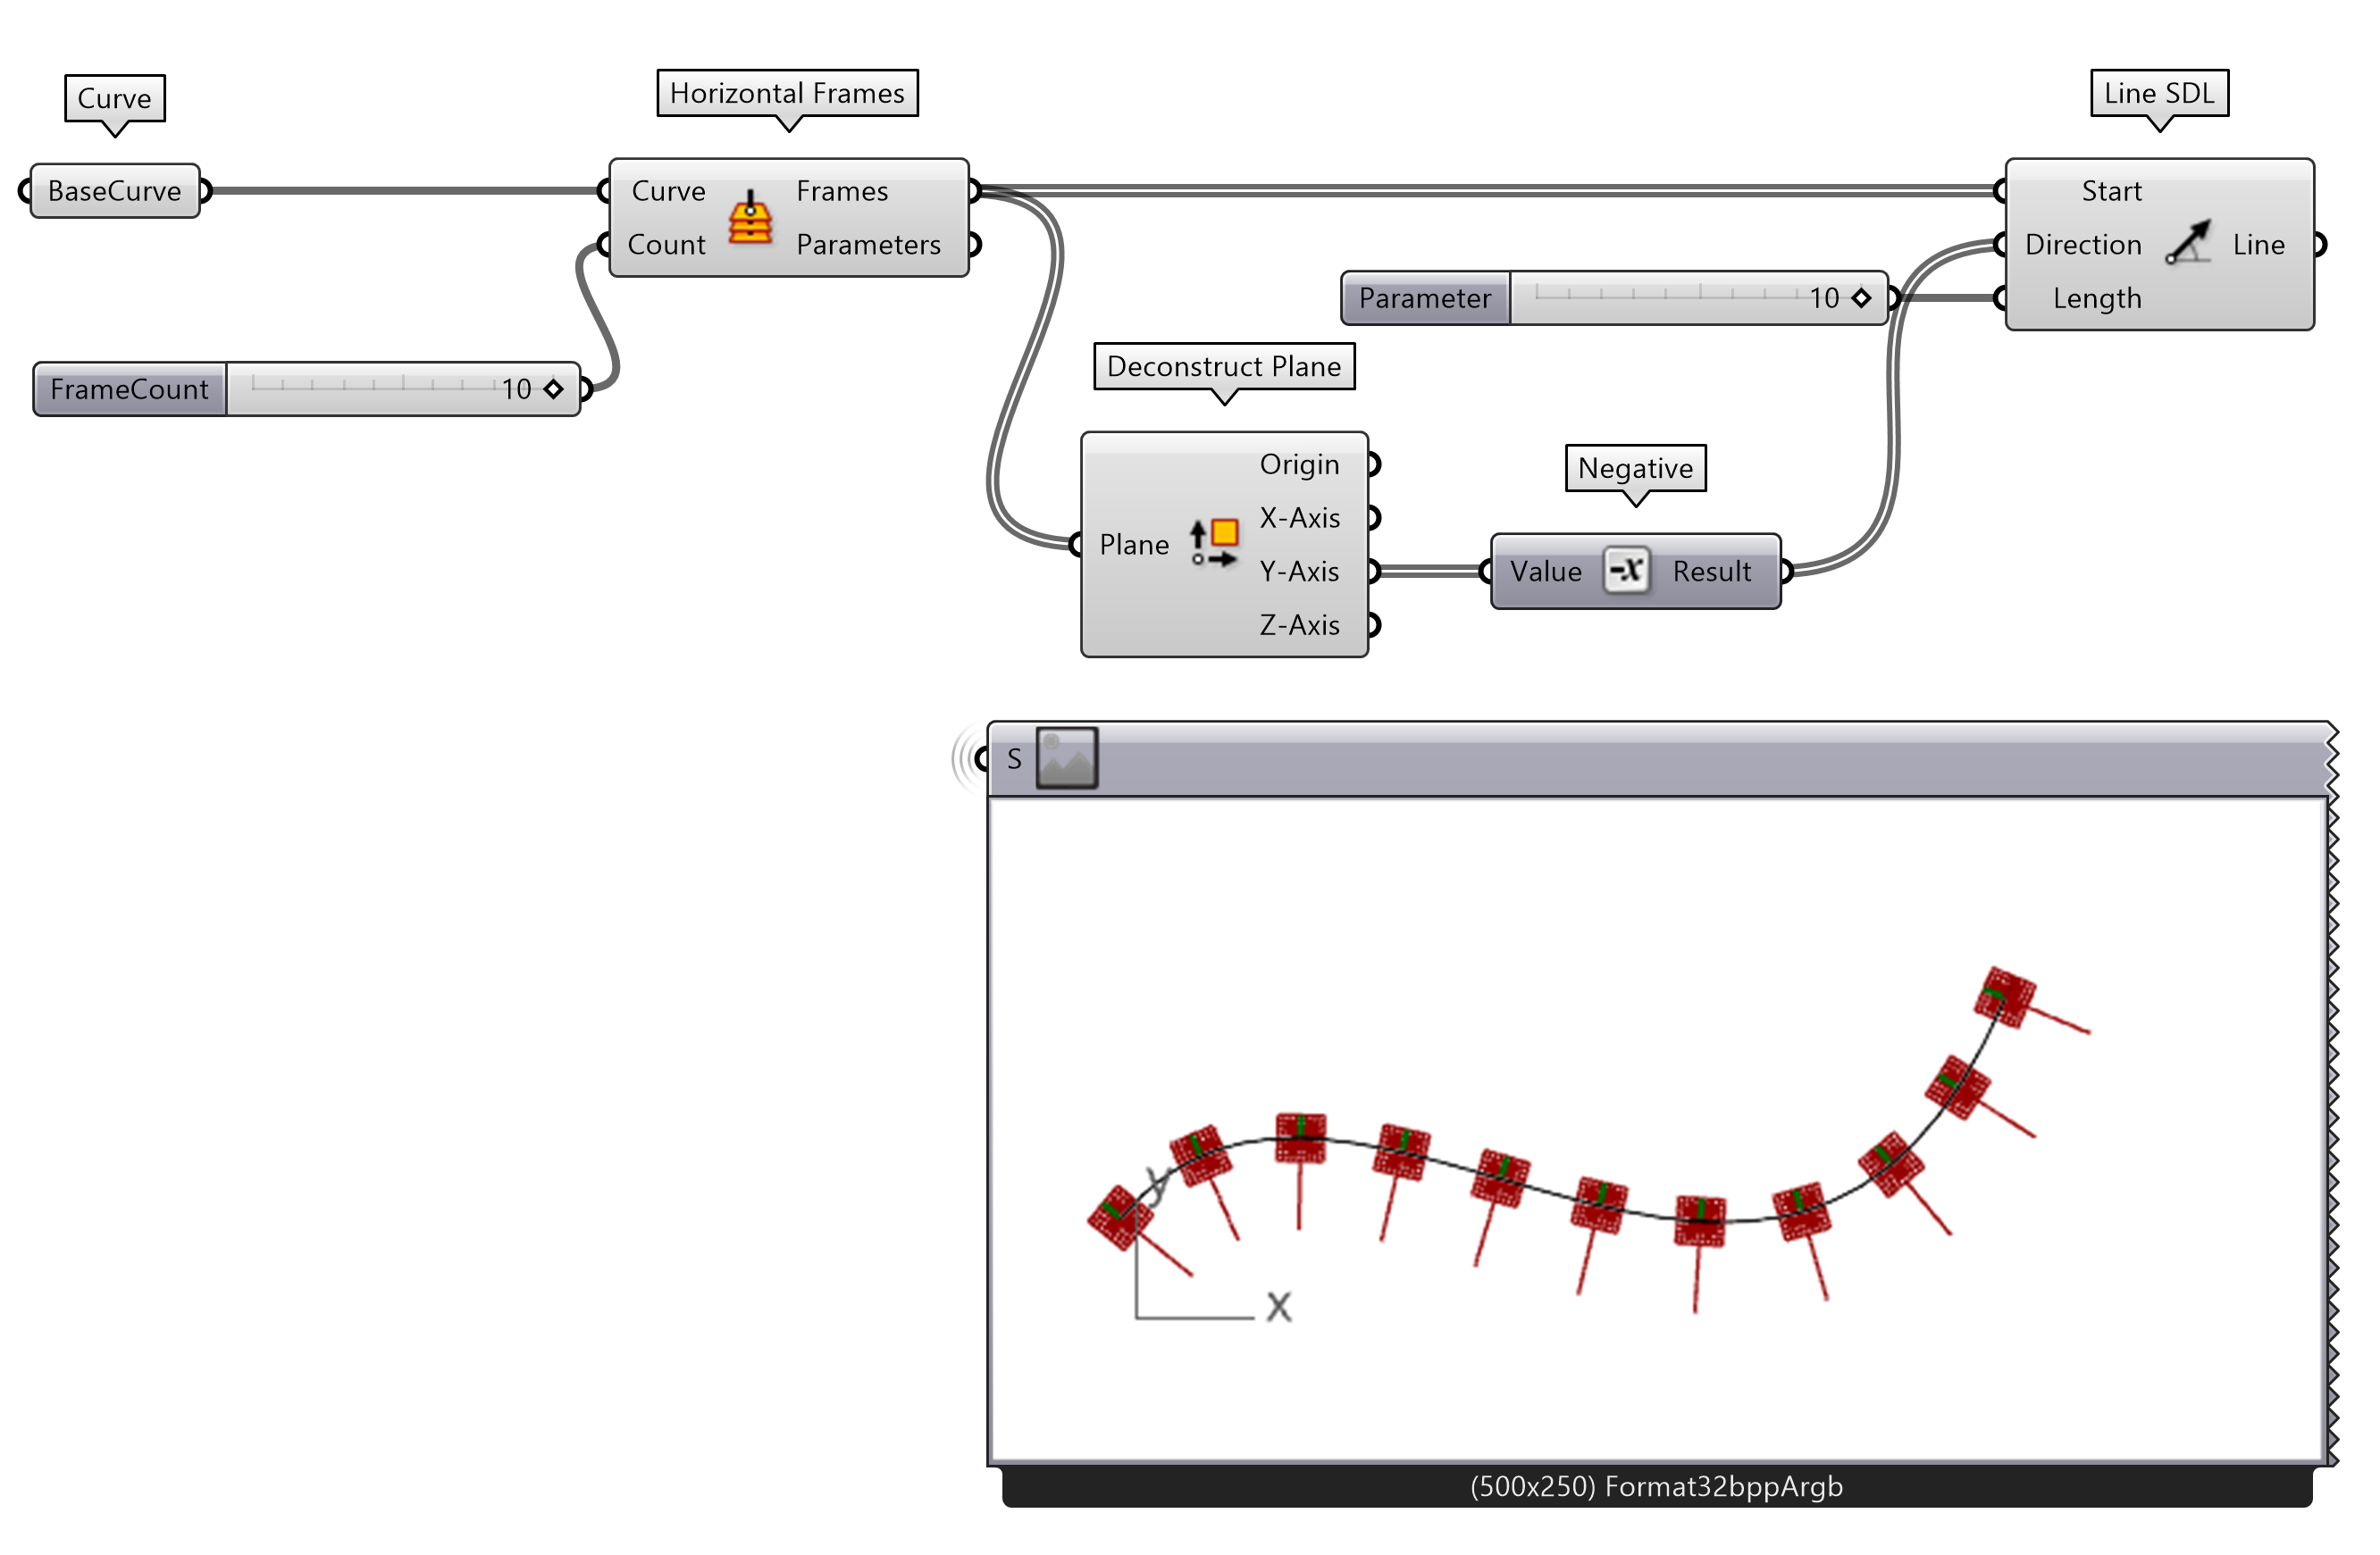
To draw a line along the y-axis of the planes, use the Deconstruct Plane component to extract the directions of the vector by connecting the Frames output from Horizontal Frames. Now use the Line SDL component with the starting point at the origin of the Frame output and the y-direction of the deconstructed vector from Deconstruct Plane into the Direction input. The Length of the line can vary, use a Number Slider.
If the direction of the offset and the SDL do not match, you can invert one or the other by using the Negative component of the y-axis output. To complete the example, use an Offset Curve component and connect the Basecurve. The offset Distance should equal the length of the SDL line by connecting the same Number Slider. If you want to retrieve the intersection points at the offset curve, use Curve-Curve.
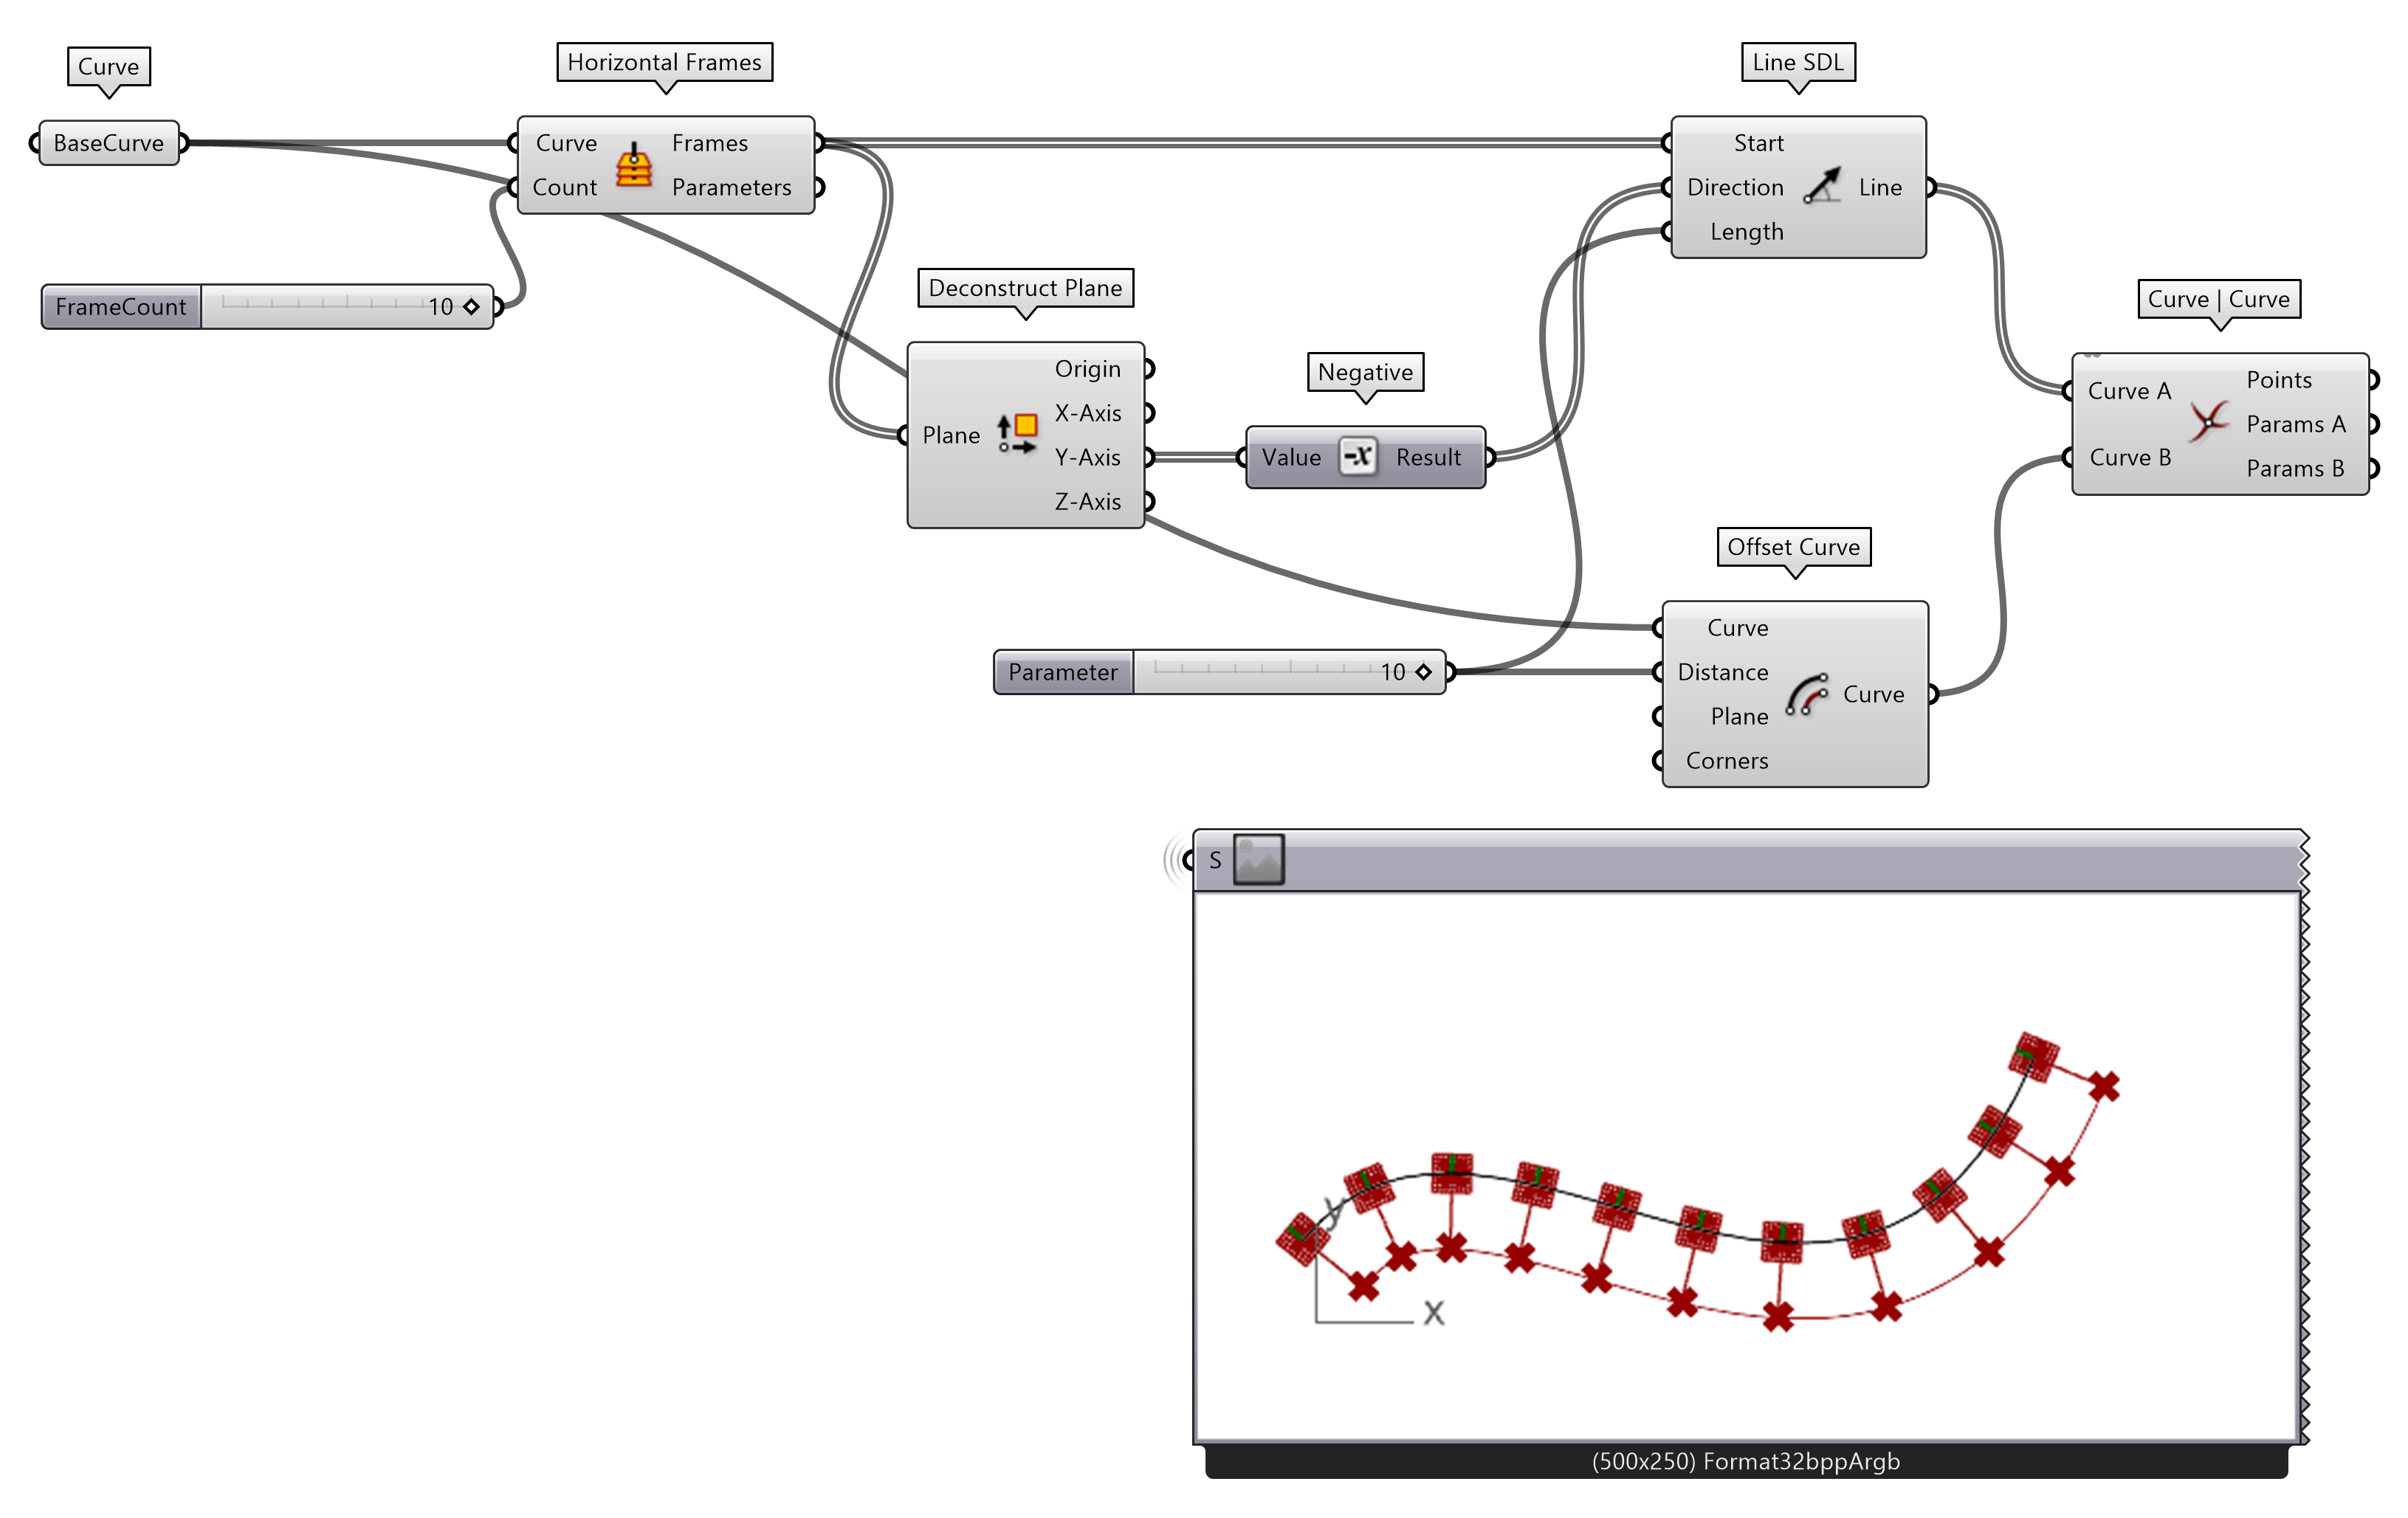
You can now delete or save this script for future use. We will continue with another example.
Using Perpendicular Frames
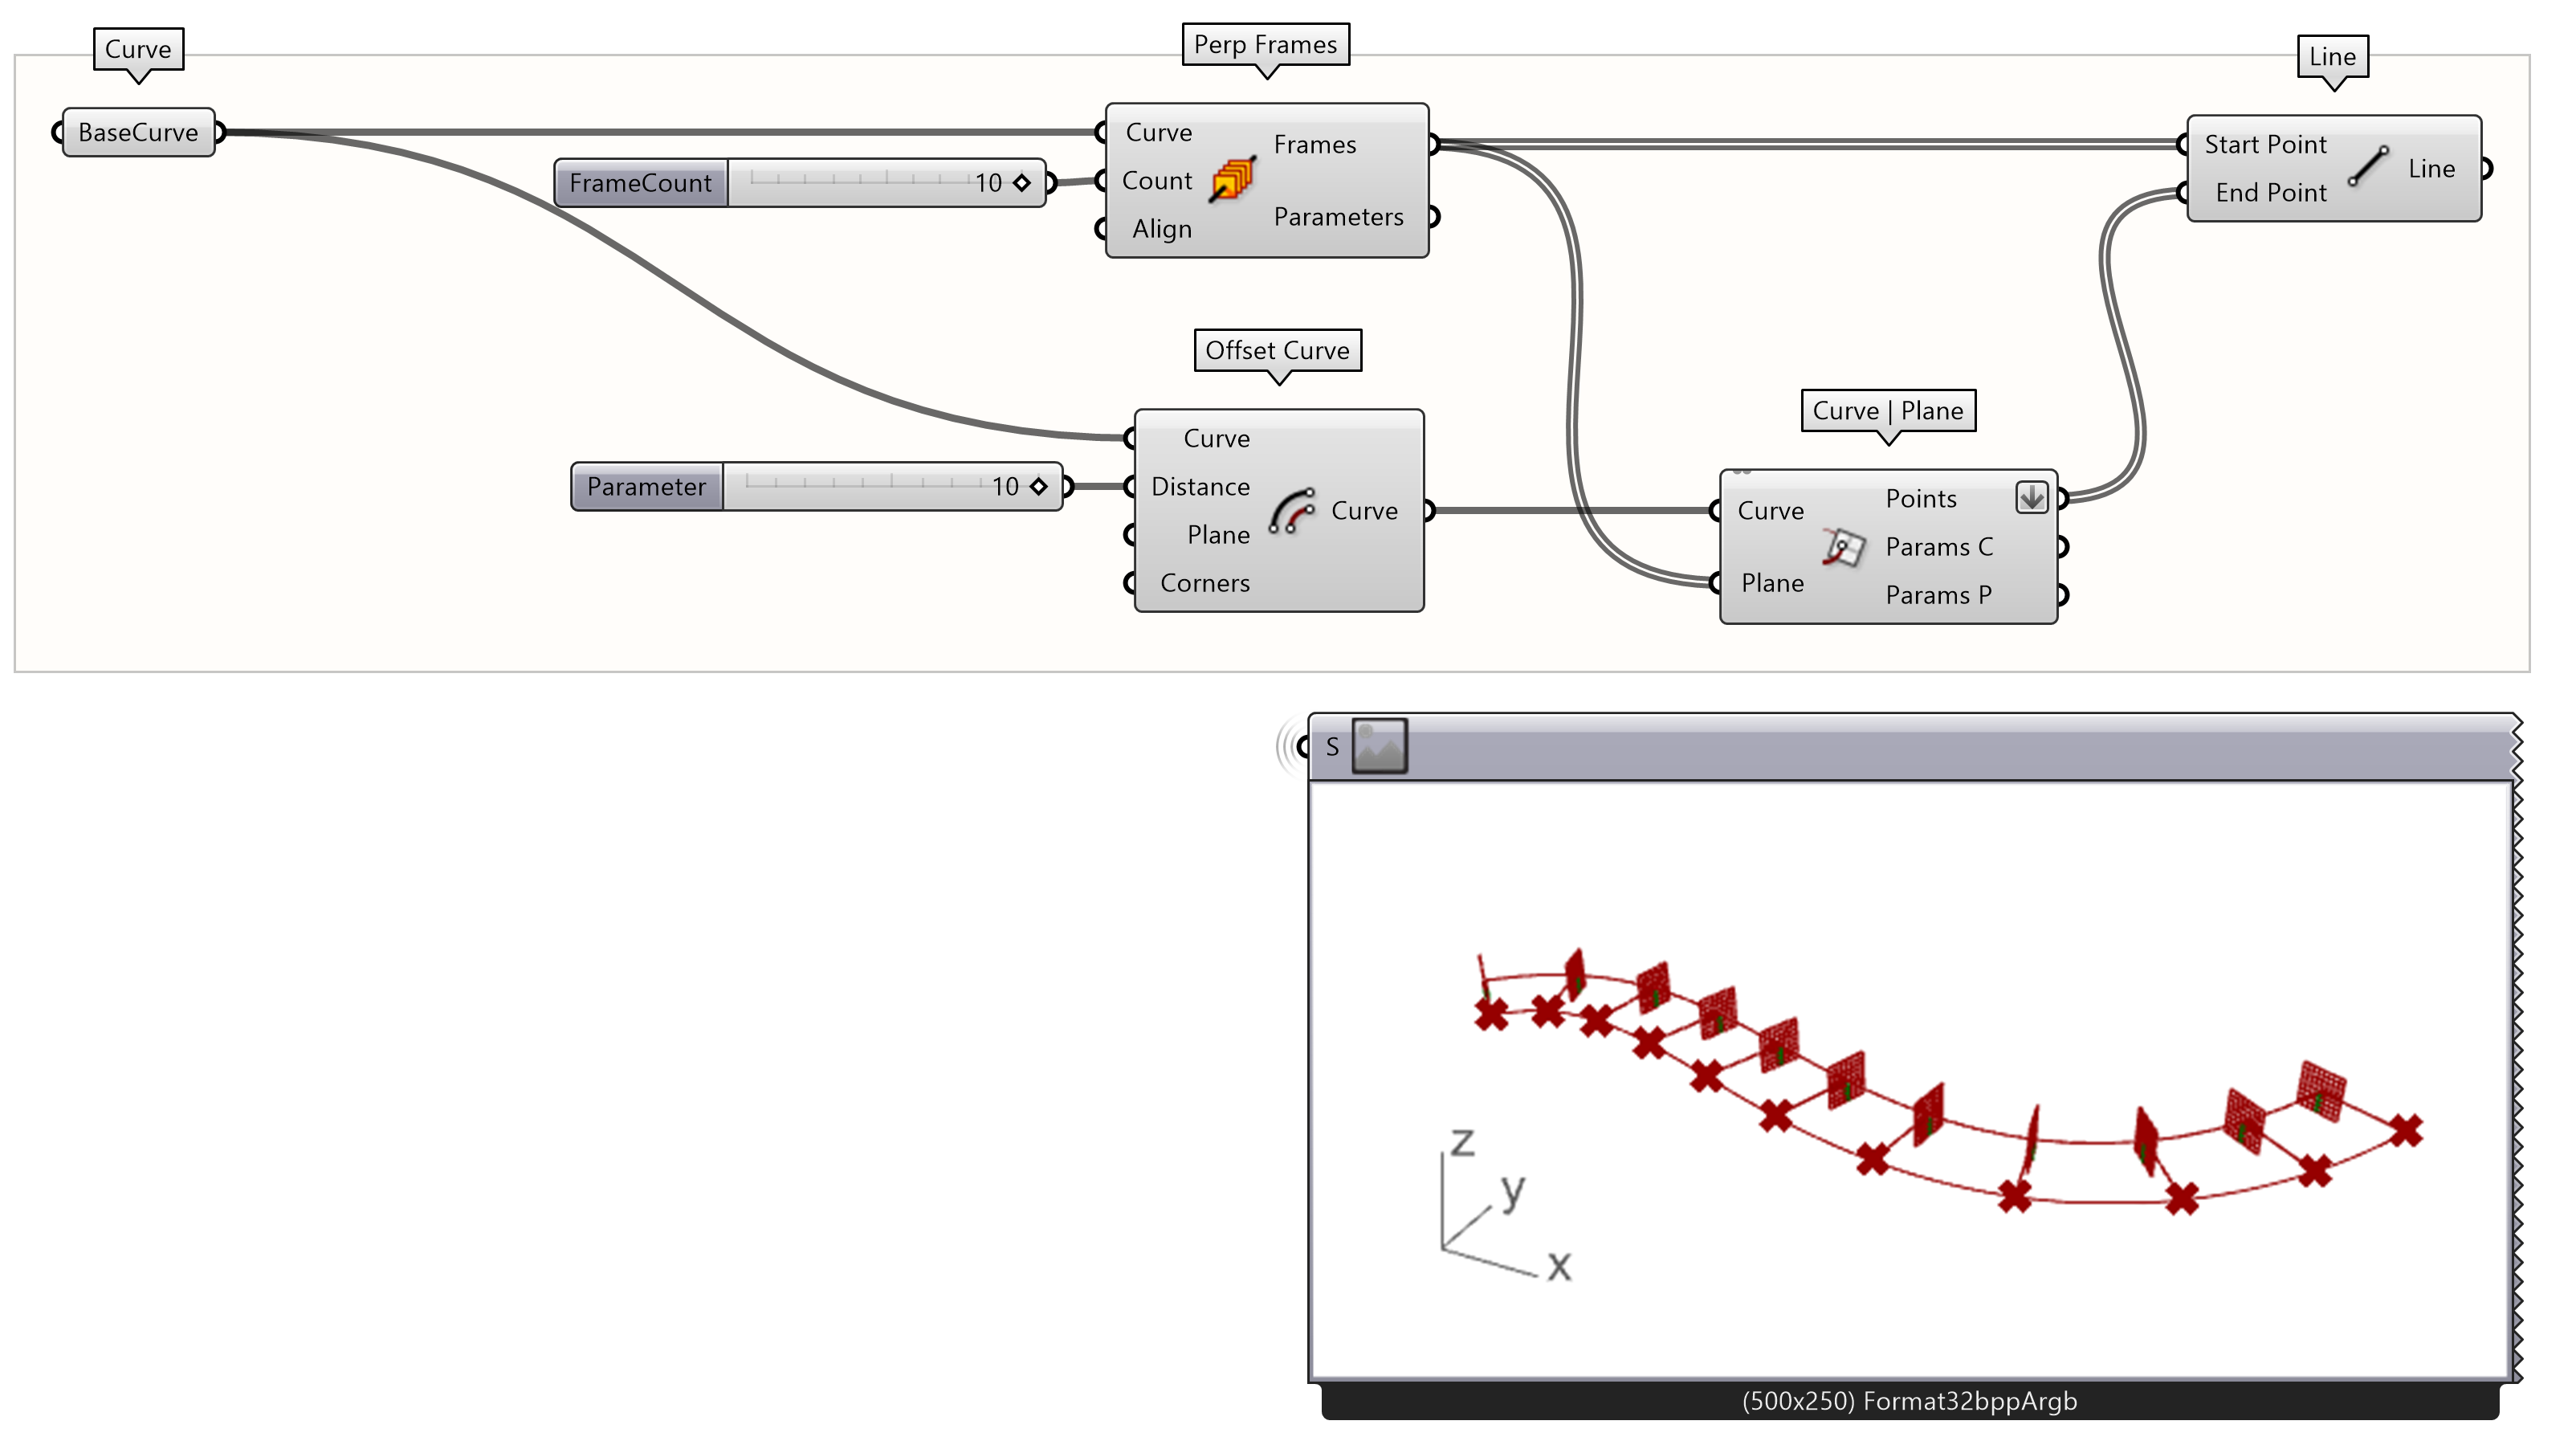
In addition to Horizontal Frames, Grasshopper also has a tool to distribute Perpendicular Frames with the Perp Frames component.
If you follow the same steps as above, you’ll see that in this case the y-direction of the plane follows the z-direction of Rhino’s world coordinate system and the x-direction is perpendicular to the curve. Notice that we connected the positive X-Axis output instead of the Y-Axis output. This ensures that the vectors are in the same direction as the offset curve.
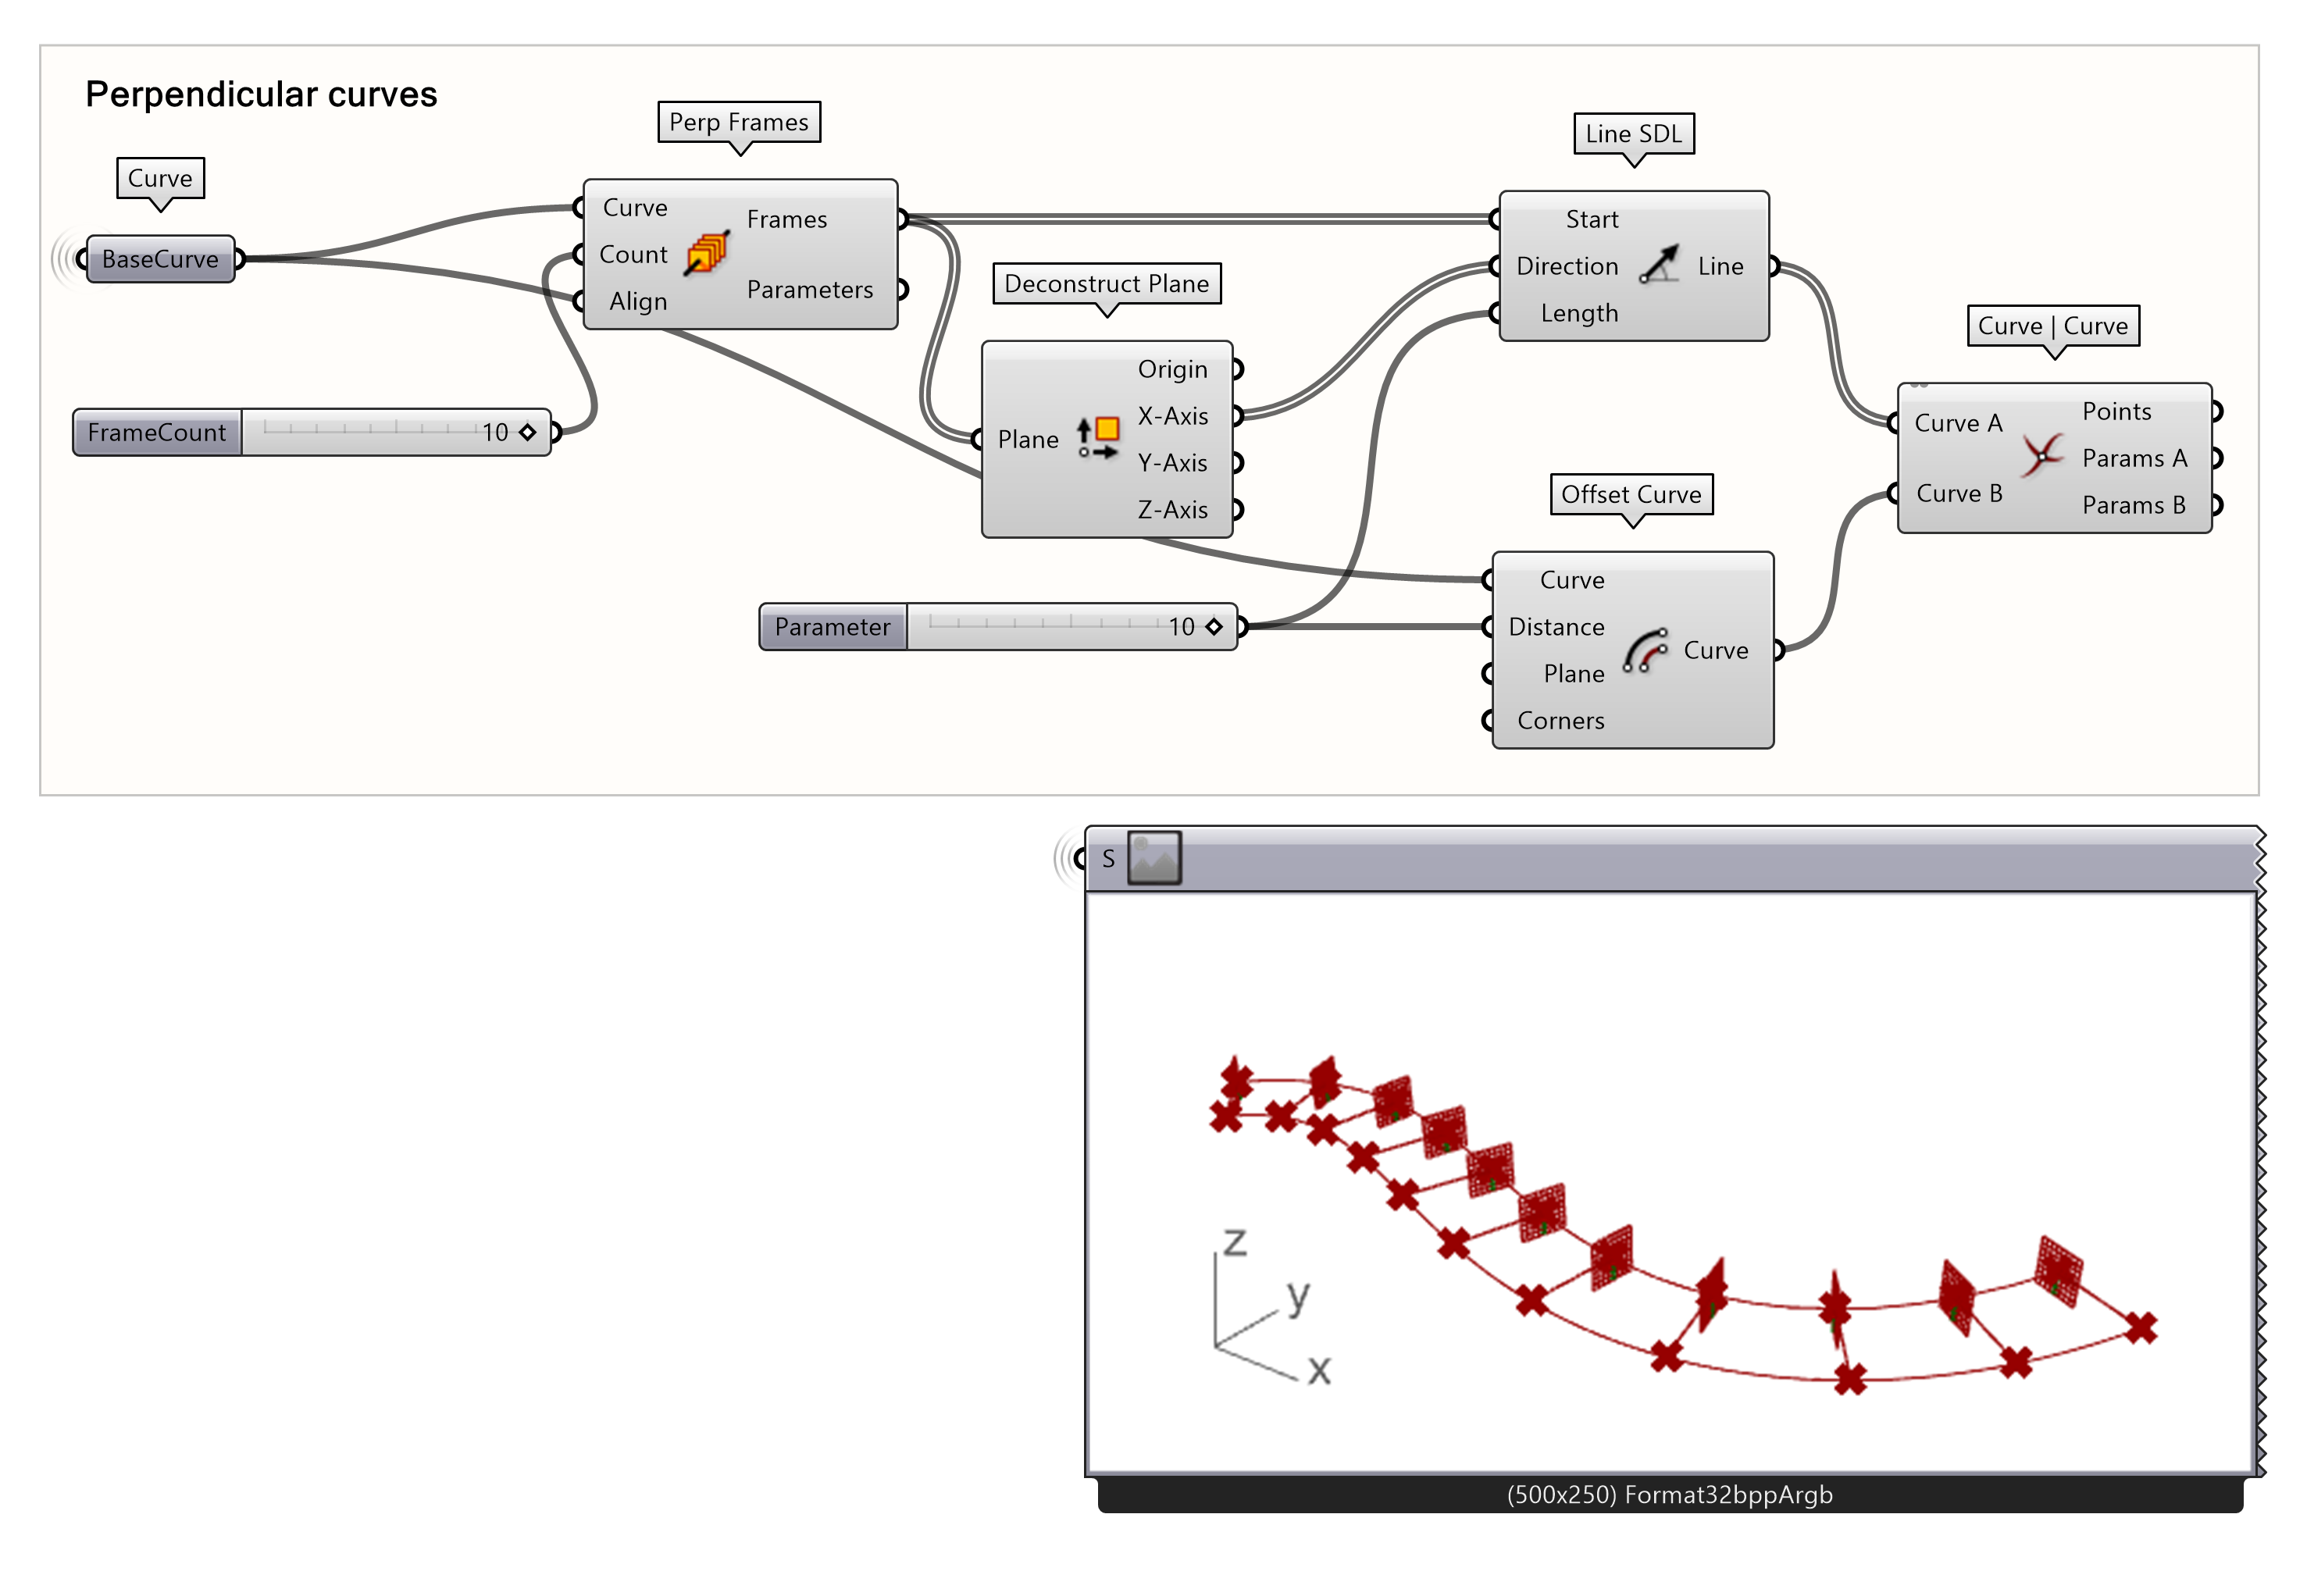
You can now delete or save this script for future use. We will continue with another example.
Curve Frames and Arrays 2/5
Curve Arraylink copied
The difference between this method and the previous ones is that here we define a geometry to distribute along a curve rather than defining a point or plane to draw geometry upon or move geometry to. In this example we start with curve-geometry to be converted into a solid, but you can start with any type of geometry (point, curve, surface, brep) or even multiple geometries.
Add the BaseCurve Curve components to the canvas from the earlier step. The first component should hold the base curve. The second parameter should hold a closed curve from Rhino, for example a star.
To create a star in Rhino:
- Type Polygon command
- Type S or click on Star
- Define the NumSides by typing N
- Type the number of sides, i.e. 5 followed by enter
- Click on the view port to define the first radius
- Click again to define the second radius
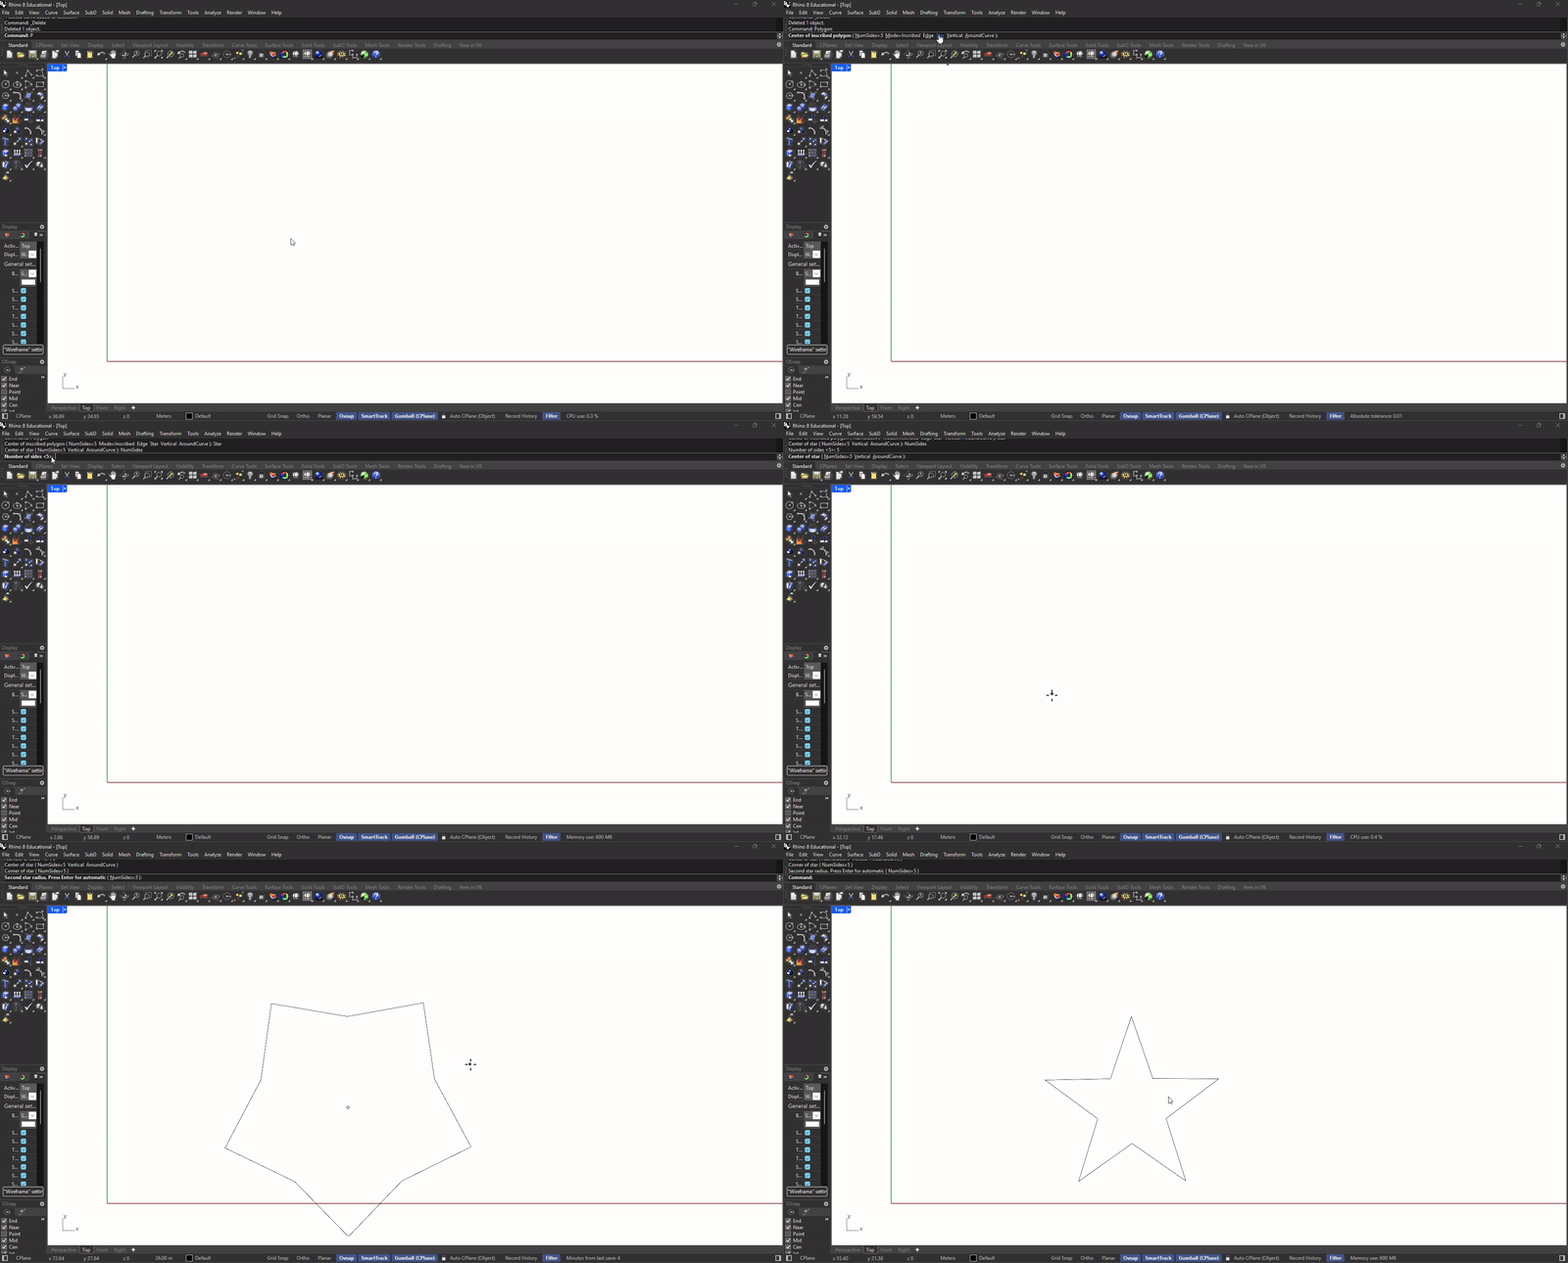
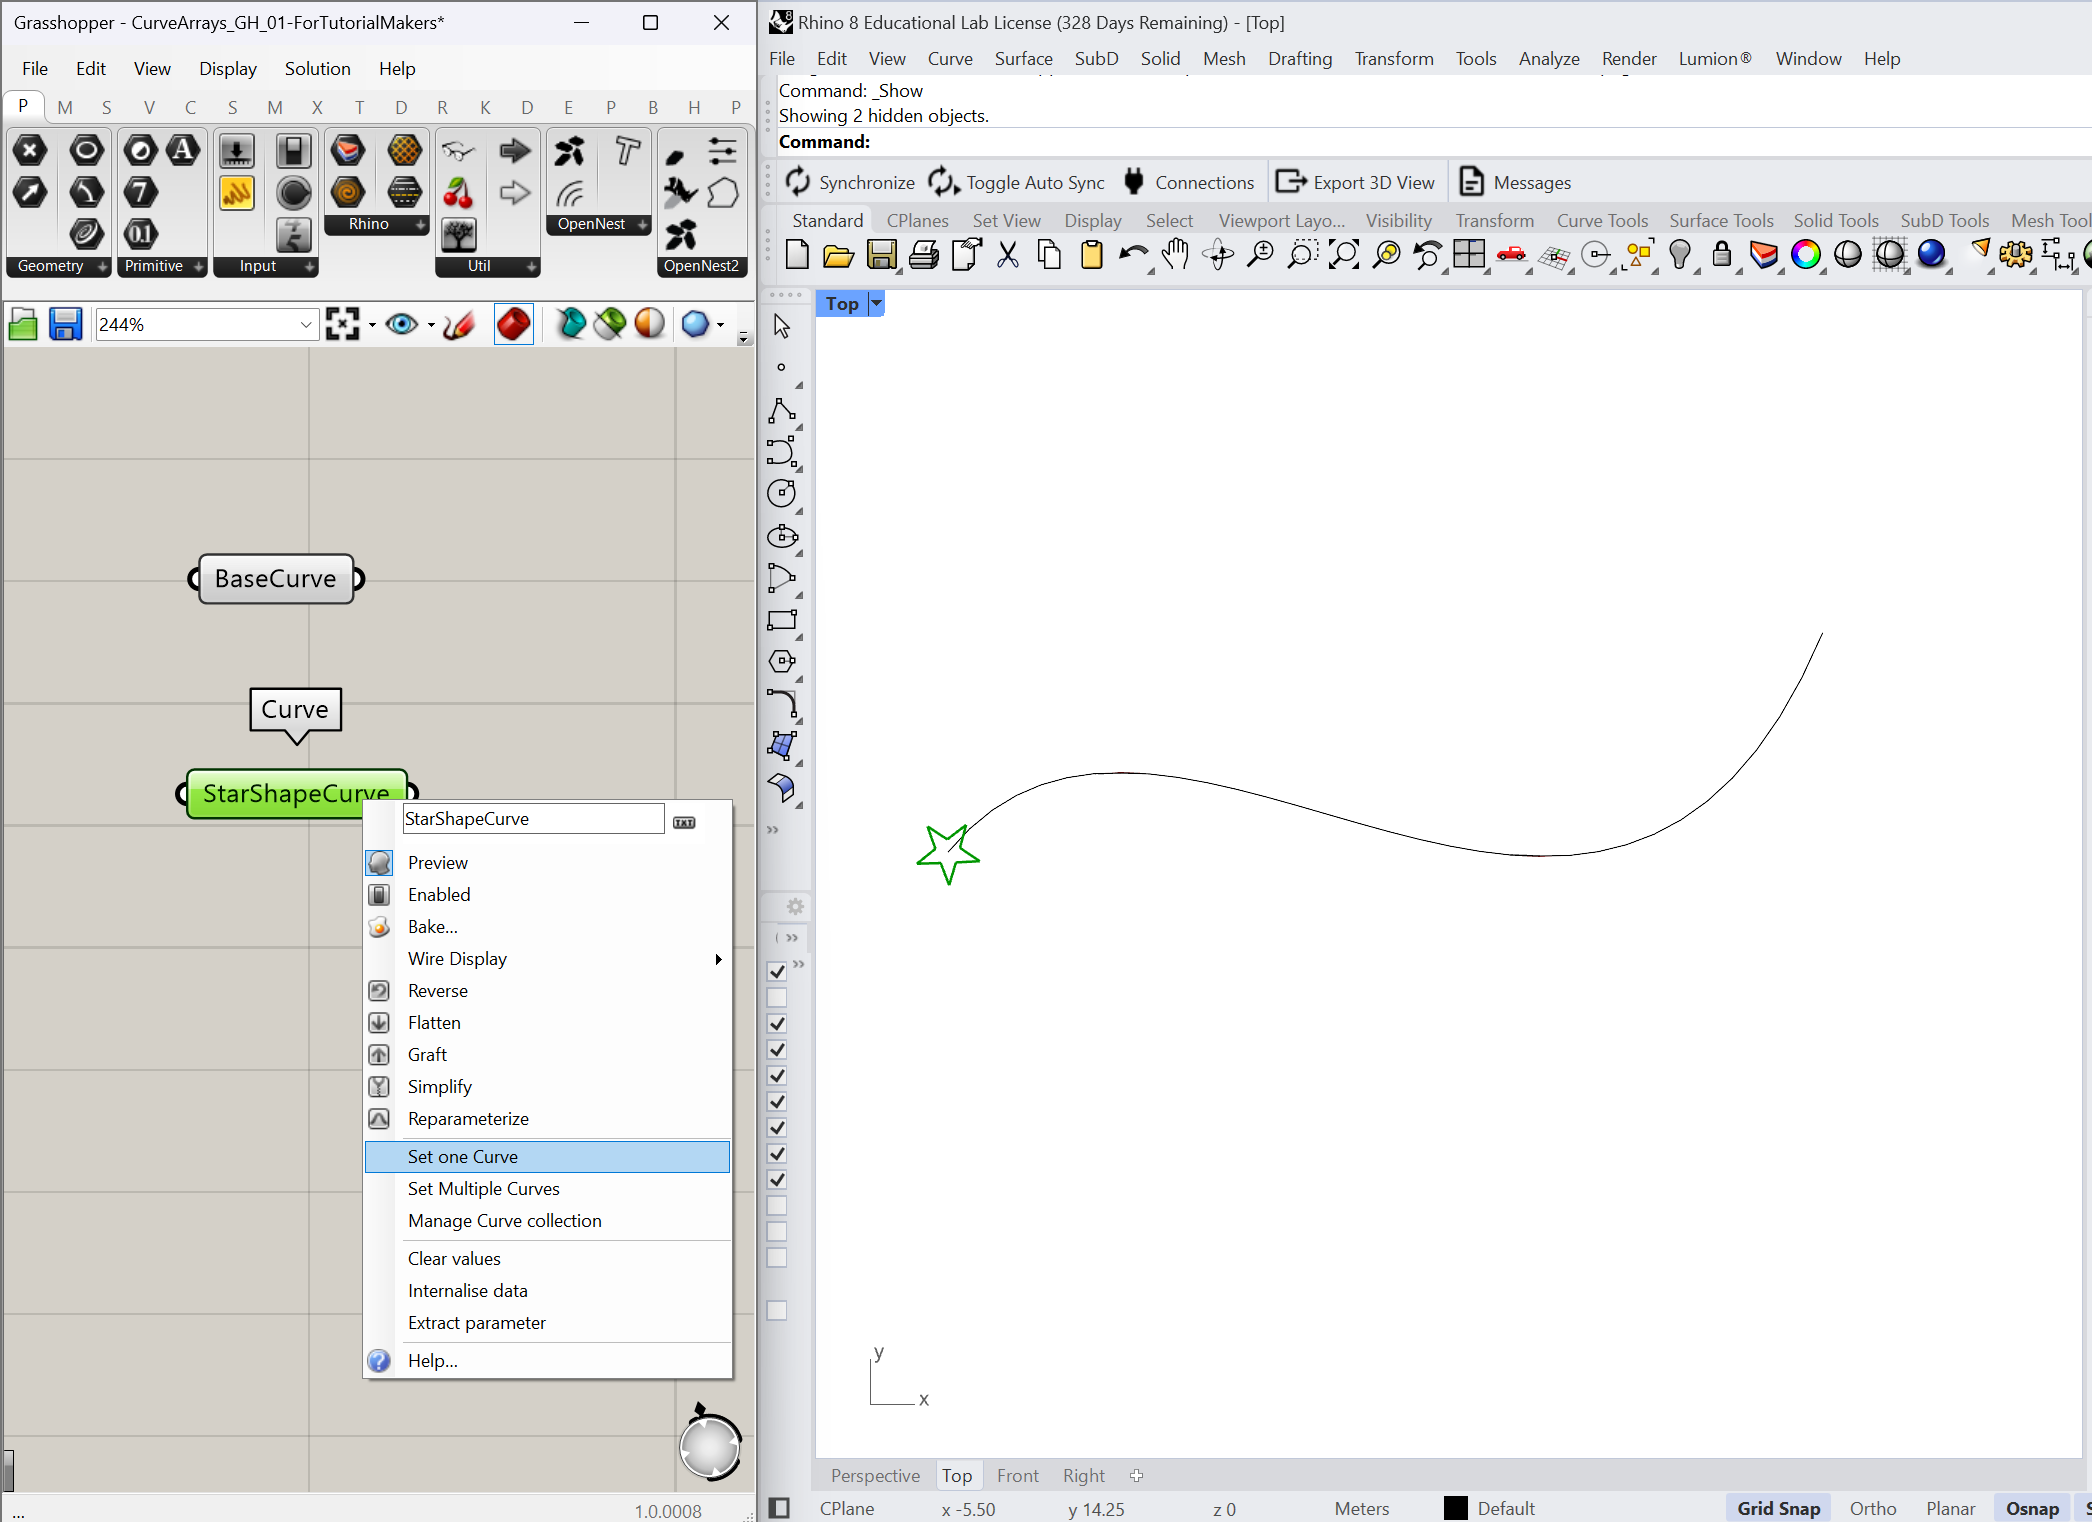
Add two curve components to the canvas such as the one provided earlier for this tutorial for base curve and star secondary curve.
- Set the base curve and the geometry to array on the parameter
- Right-click on Curve component then “Set one Curve”
Now that you have both curves defined, we can array the shape along the curve.
- First, in Rhino, define your geometry to be arrayed along the curve. In this case, we have drawn a star-like curve and set one curve. To convert this to a solid, we use:
- Connect the StarShapedCurve into the Extrude component and connected the extrusion output into Cap Holes component.
- For the extrusion, define the direction, in this case the z-direction by using Unit Z then define the vector distance using a Number Slider.
- If we connect the capped Brep to the Geometry input of the Curve Array command, it will distribute the geometry along the curve by a defined Number. This can be adjusted by using a Number Slider.
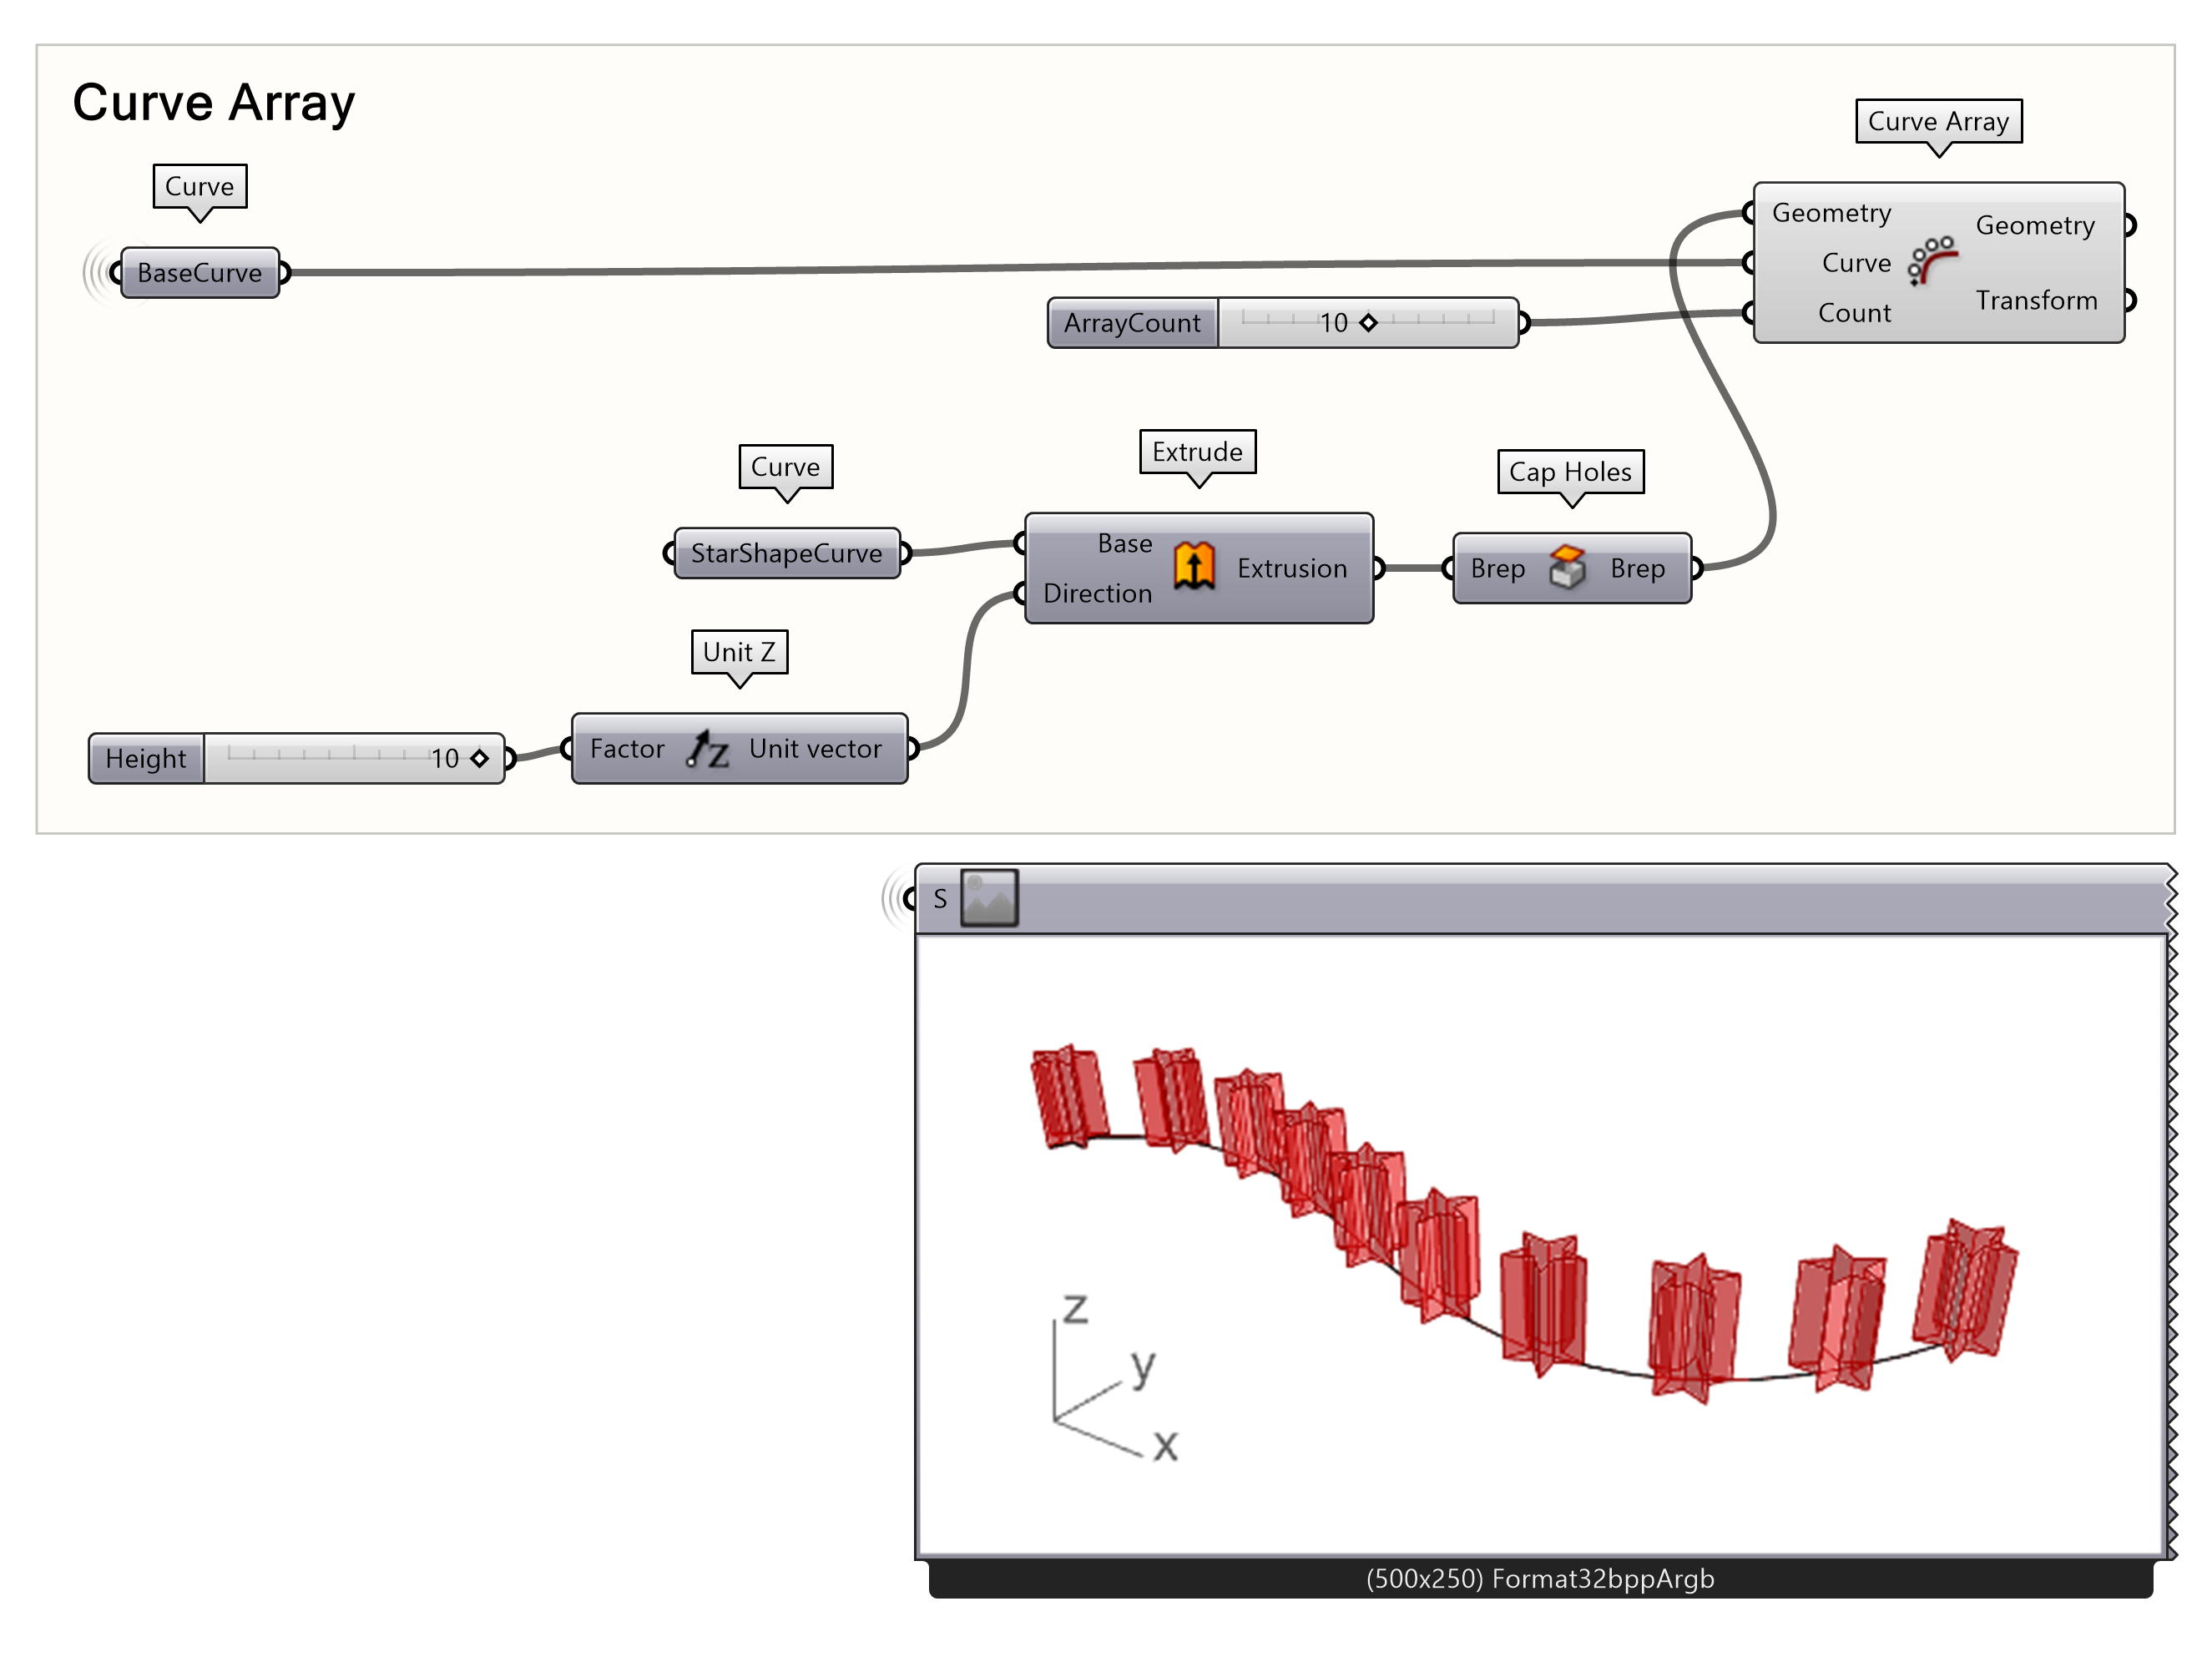
You can now delete or save this script for future use. We will continue with the next tutorial.
Curve Frames and Arrays 3/5
Distance based Scaling using Remappinglink copied
In this chapter, you will learn how to use the remap tool. This can be useful for example, if you want to change a parameter based on a relation to another parameter. Imagine the following situation: based on the curve we drew in the previous exercise we will extrude geometry along the curve. However, the extrusion should be larger when it is further from the start point. Furthermore, the extrusion should be at least 1 and have a maximum of 10. We will use the same base curve and star shaped curve until the of this tutorial.
First, create a curve array of geometries along the base curve.
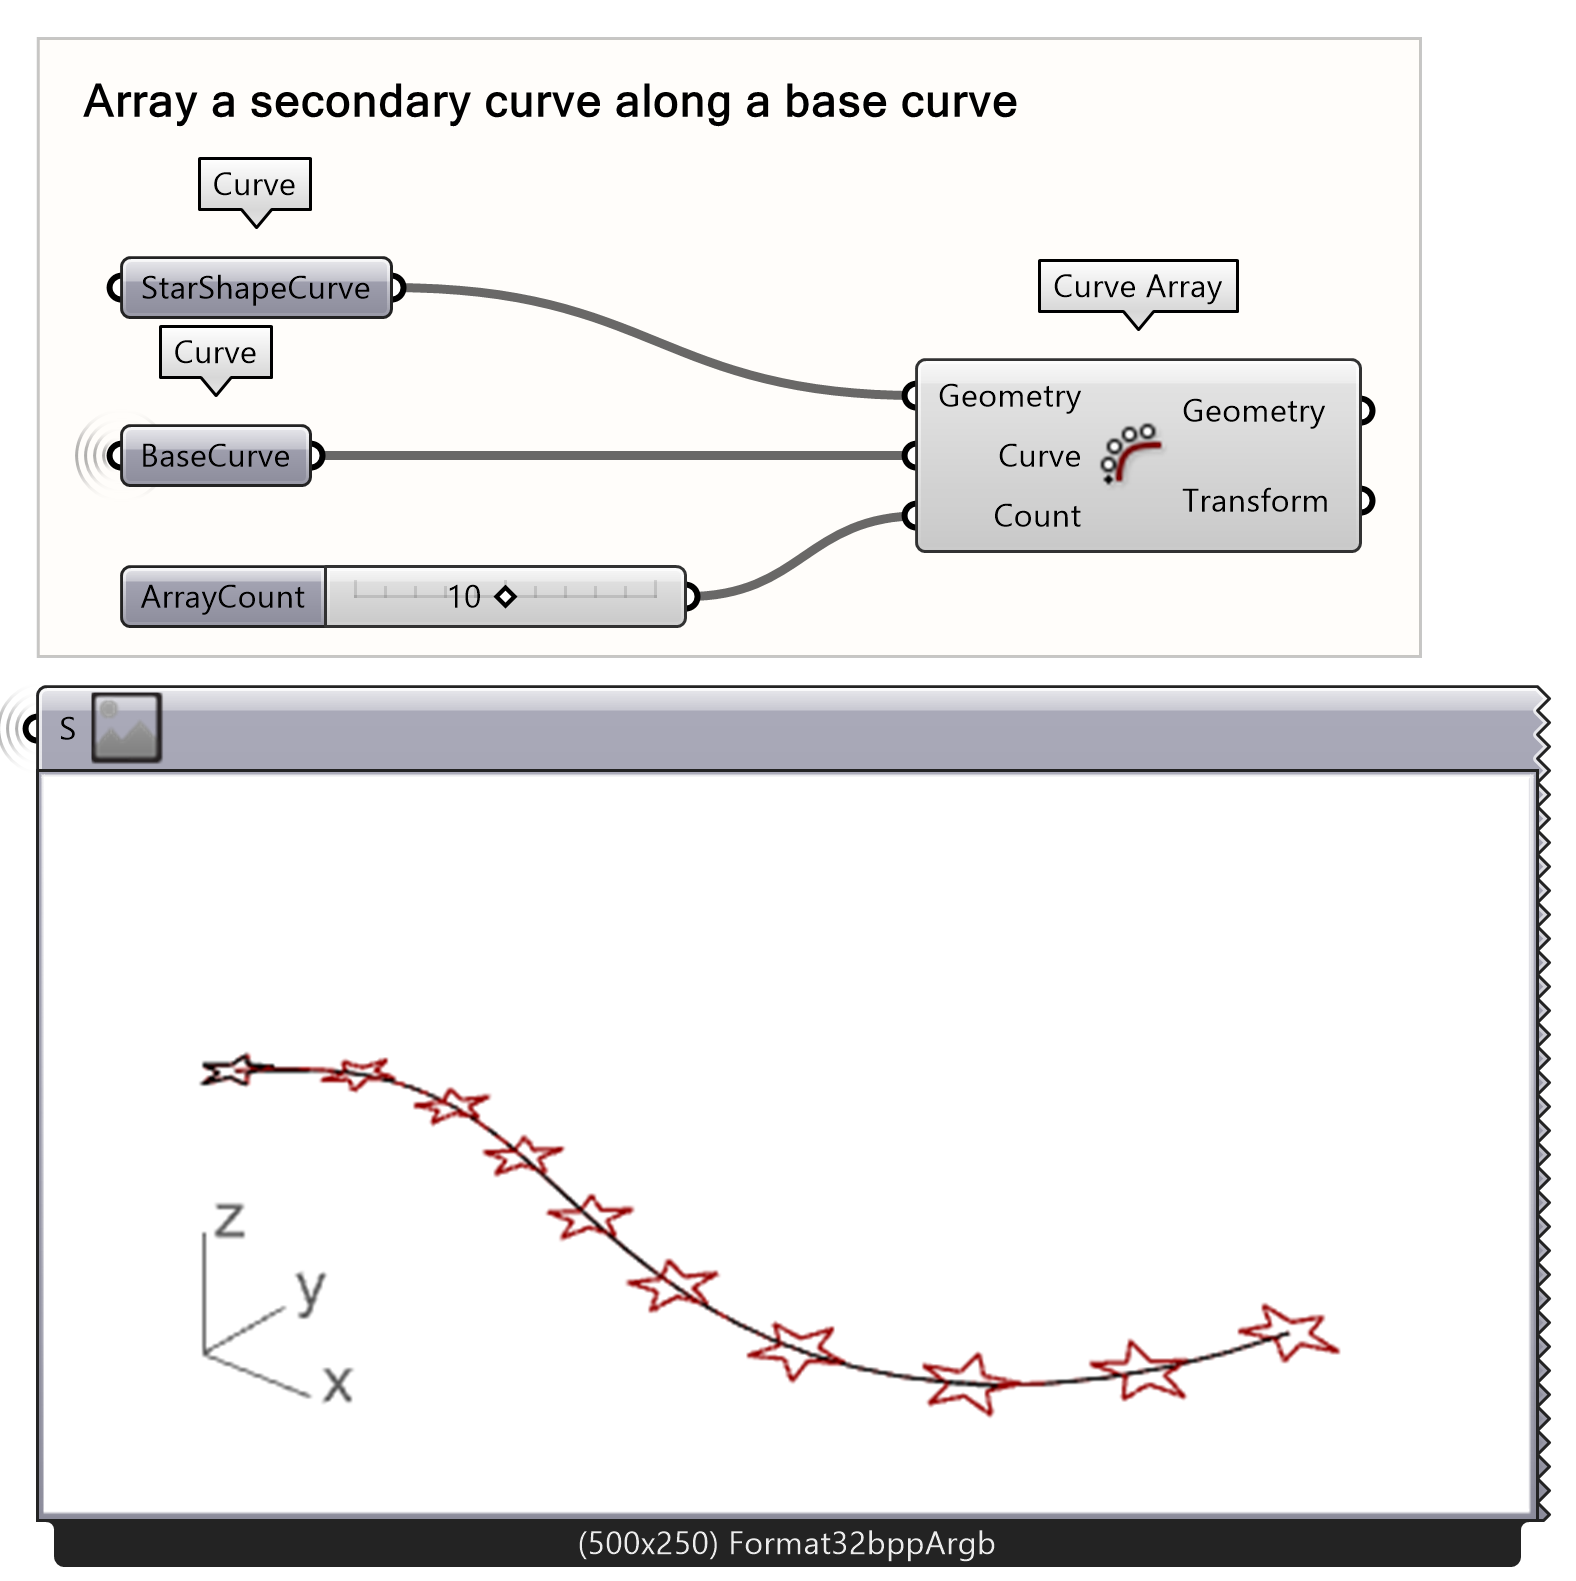
- Connect the curve parameters to a Curve Array as illustrated, where StarShapeCurve is the input for Geometry and BaseCurve is the input for Curve.
- Define the number of geometries with the count input using an integer Number Slider.
Now we need to find the location of the geometries, based on the curve length. First, use the Area component to find the Centroid of the geometries. After that, use the Curve Closest Point component to find the location. As you can see, the Curve Closest Point has three outputs: Point, Parameter and Distance. In our case, the Parameter output describes the location on the curve.
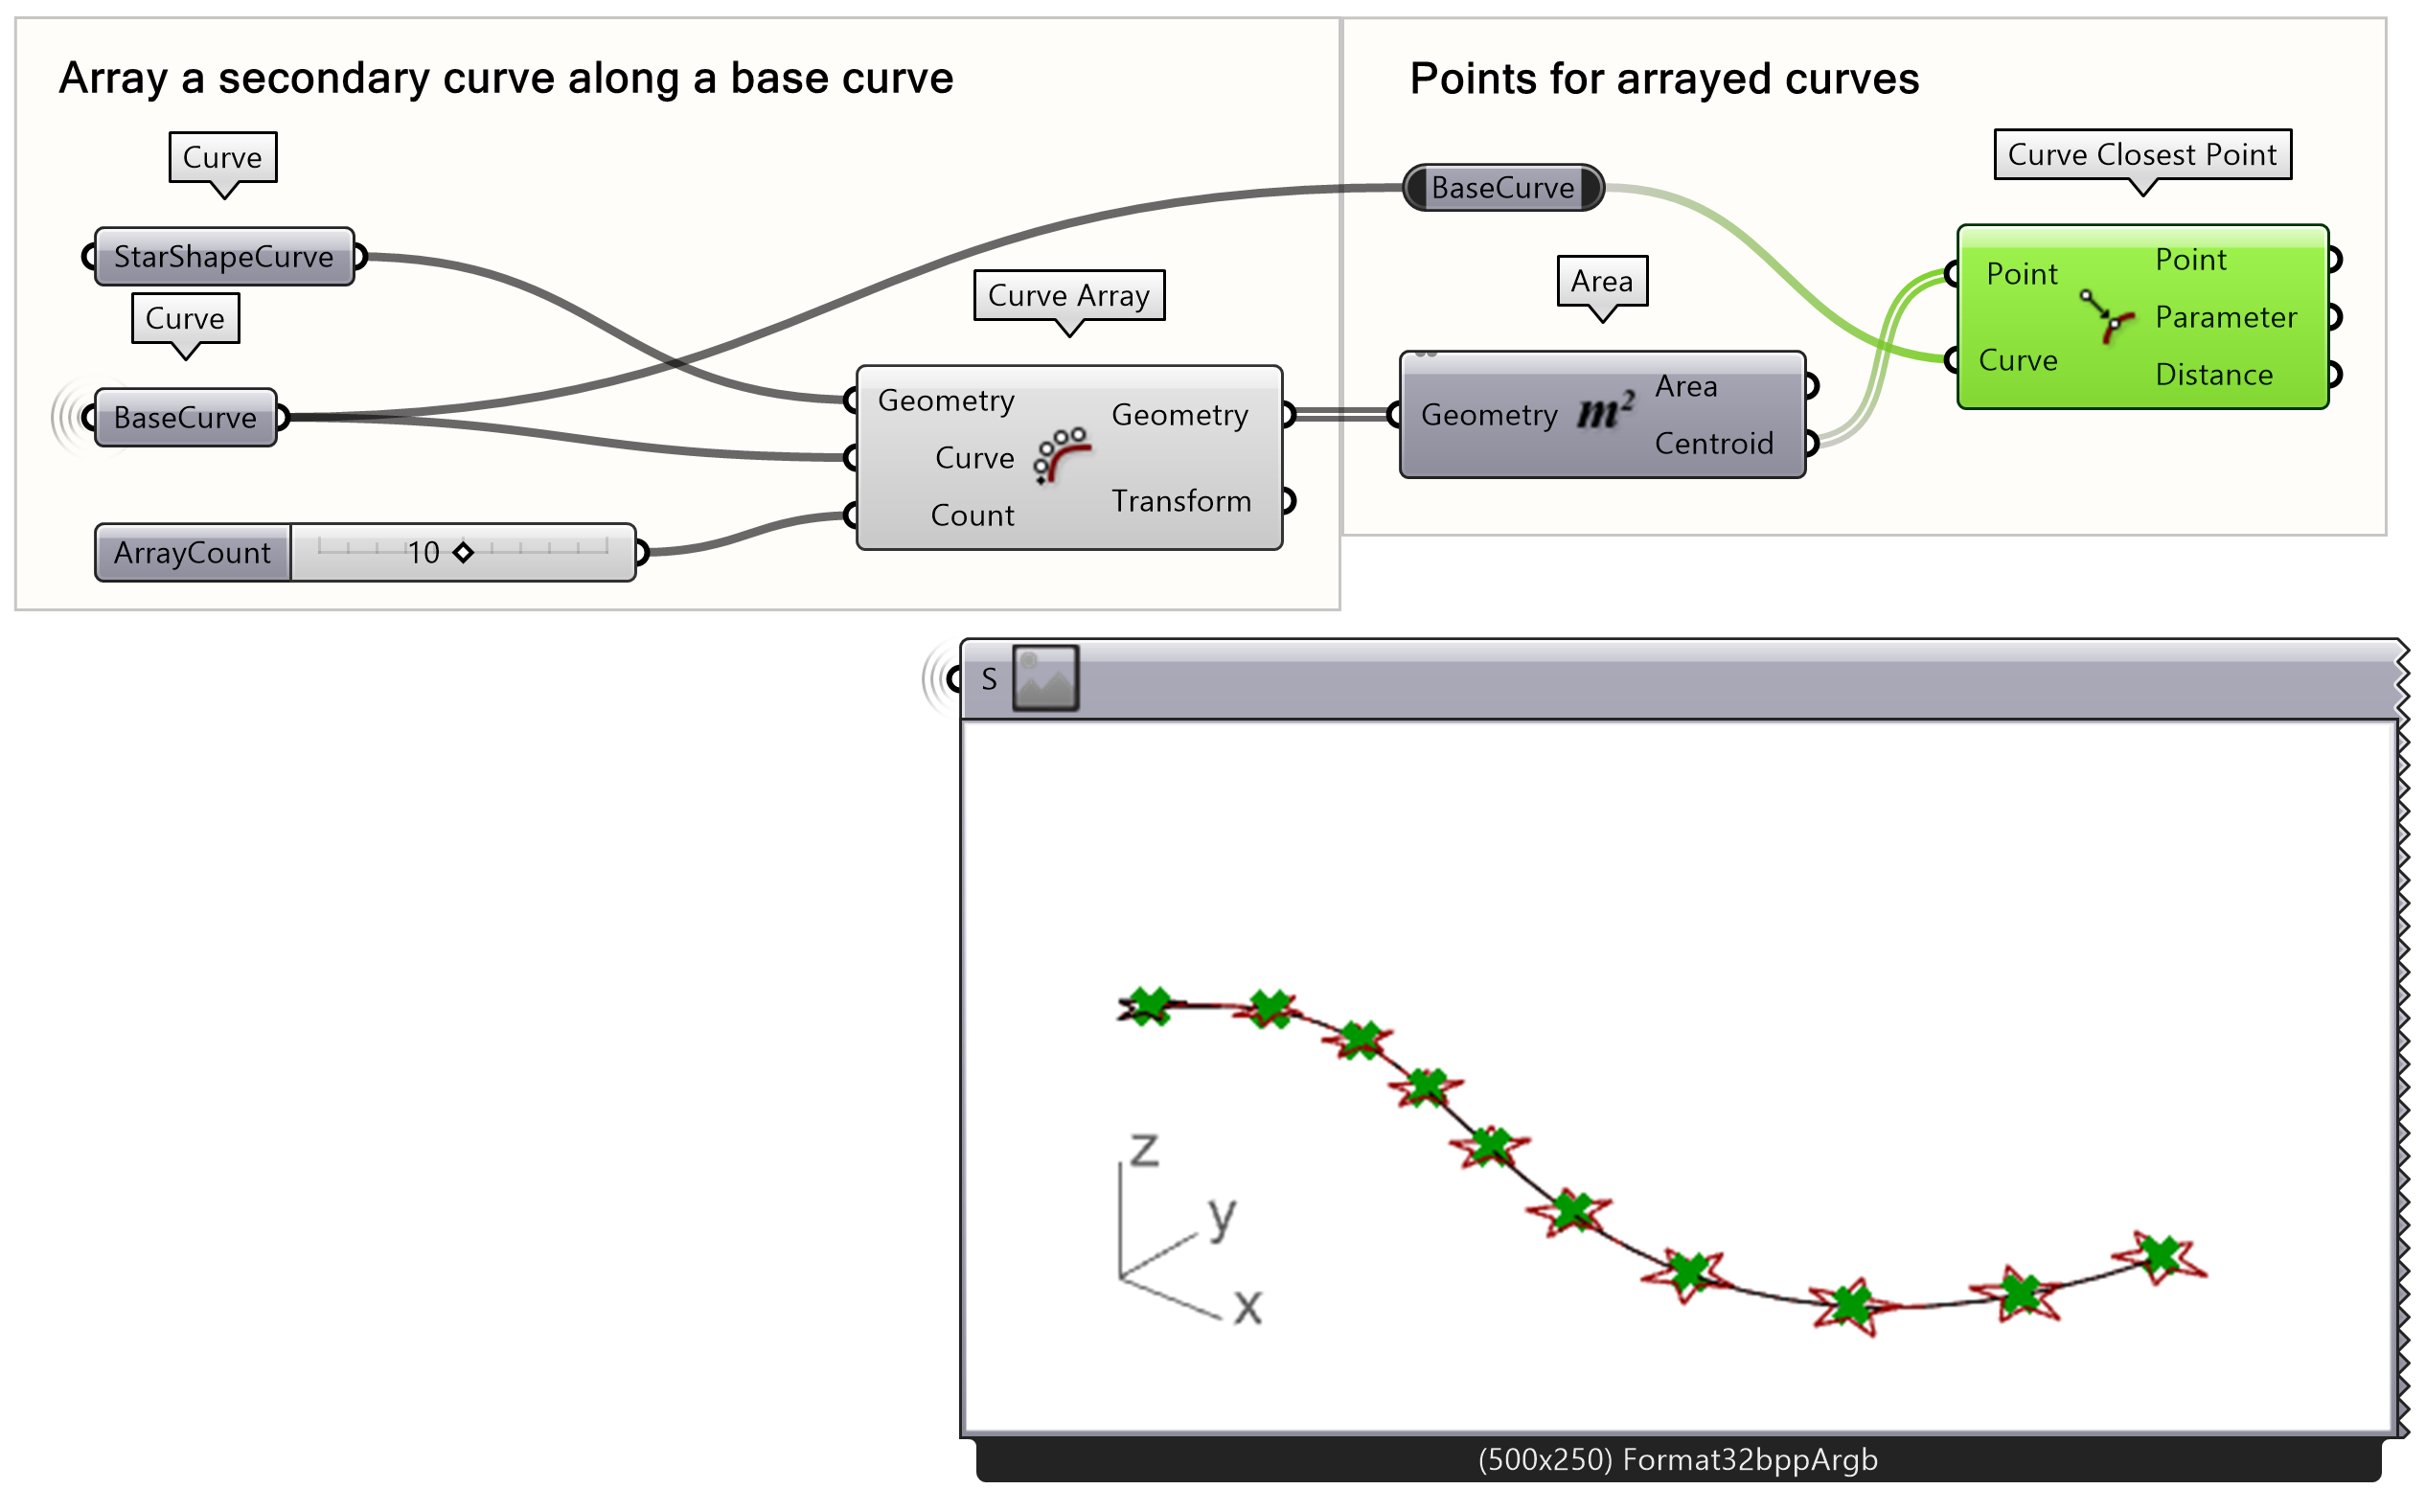
- Find the centroid of the arrayed Geometries by connecting the Geometry output into the Area component.
- Use the curve closest point to find the Parameter on the curve by inputting the Centroid as the Point input and BaseCurve for the Curve input of Curve Closest Point component.
Remap Numbers
Below is an illustration for what remapping does the a list of numbers. In Grasshopper, remapping takes each original number and scales it according to the new target range. For example, the number 2 in the original range (0 to 4) would become 5 in the new range (0 to 10).This script remaps a set of original values (0, 1, 2, 3, and 4) to a new target range (0 to 10). By calculating the minimum (0) and maximum (4) of the original values, the script scales each value accordingly: 0 maps to 0, 1 to 2.5, 2 to 5, 3 to 7.5, and 4 to 10.

Now we are going to use the remap approach mentioned above to create a height range for our stars.
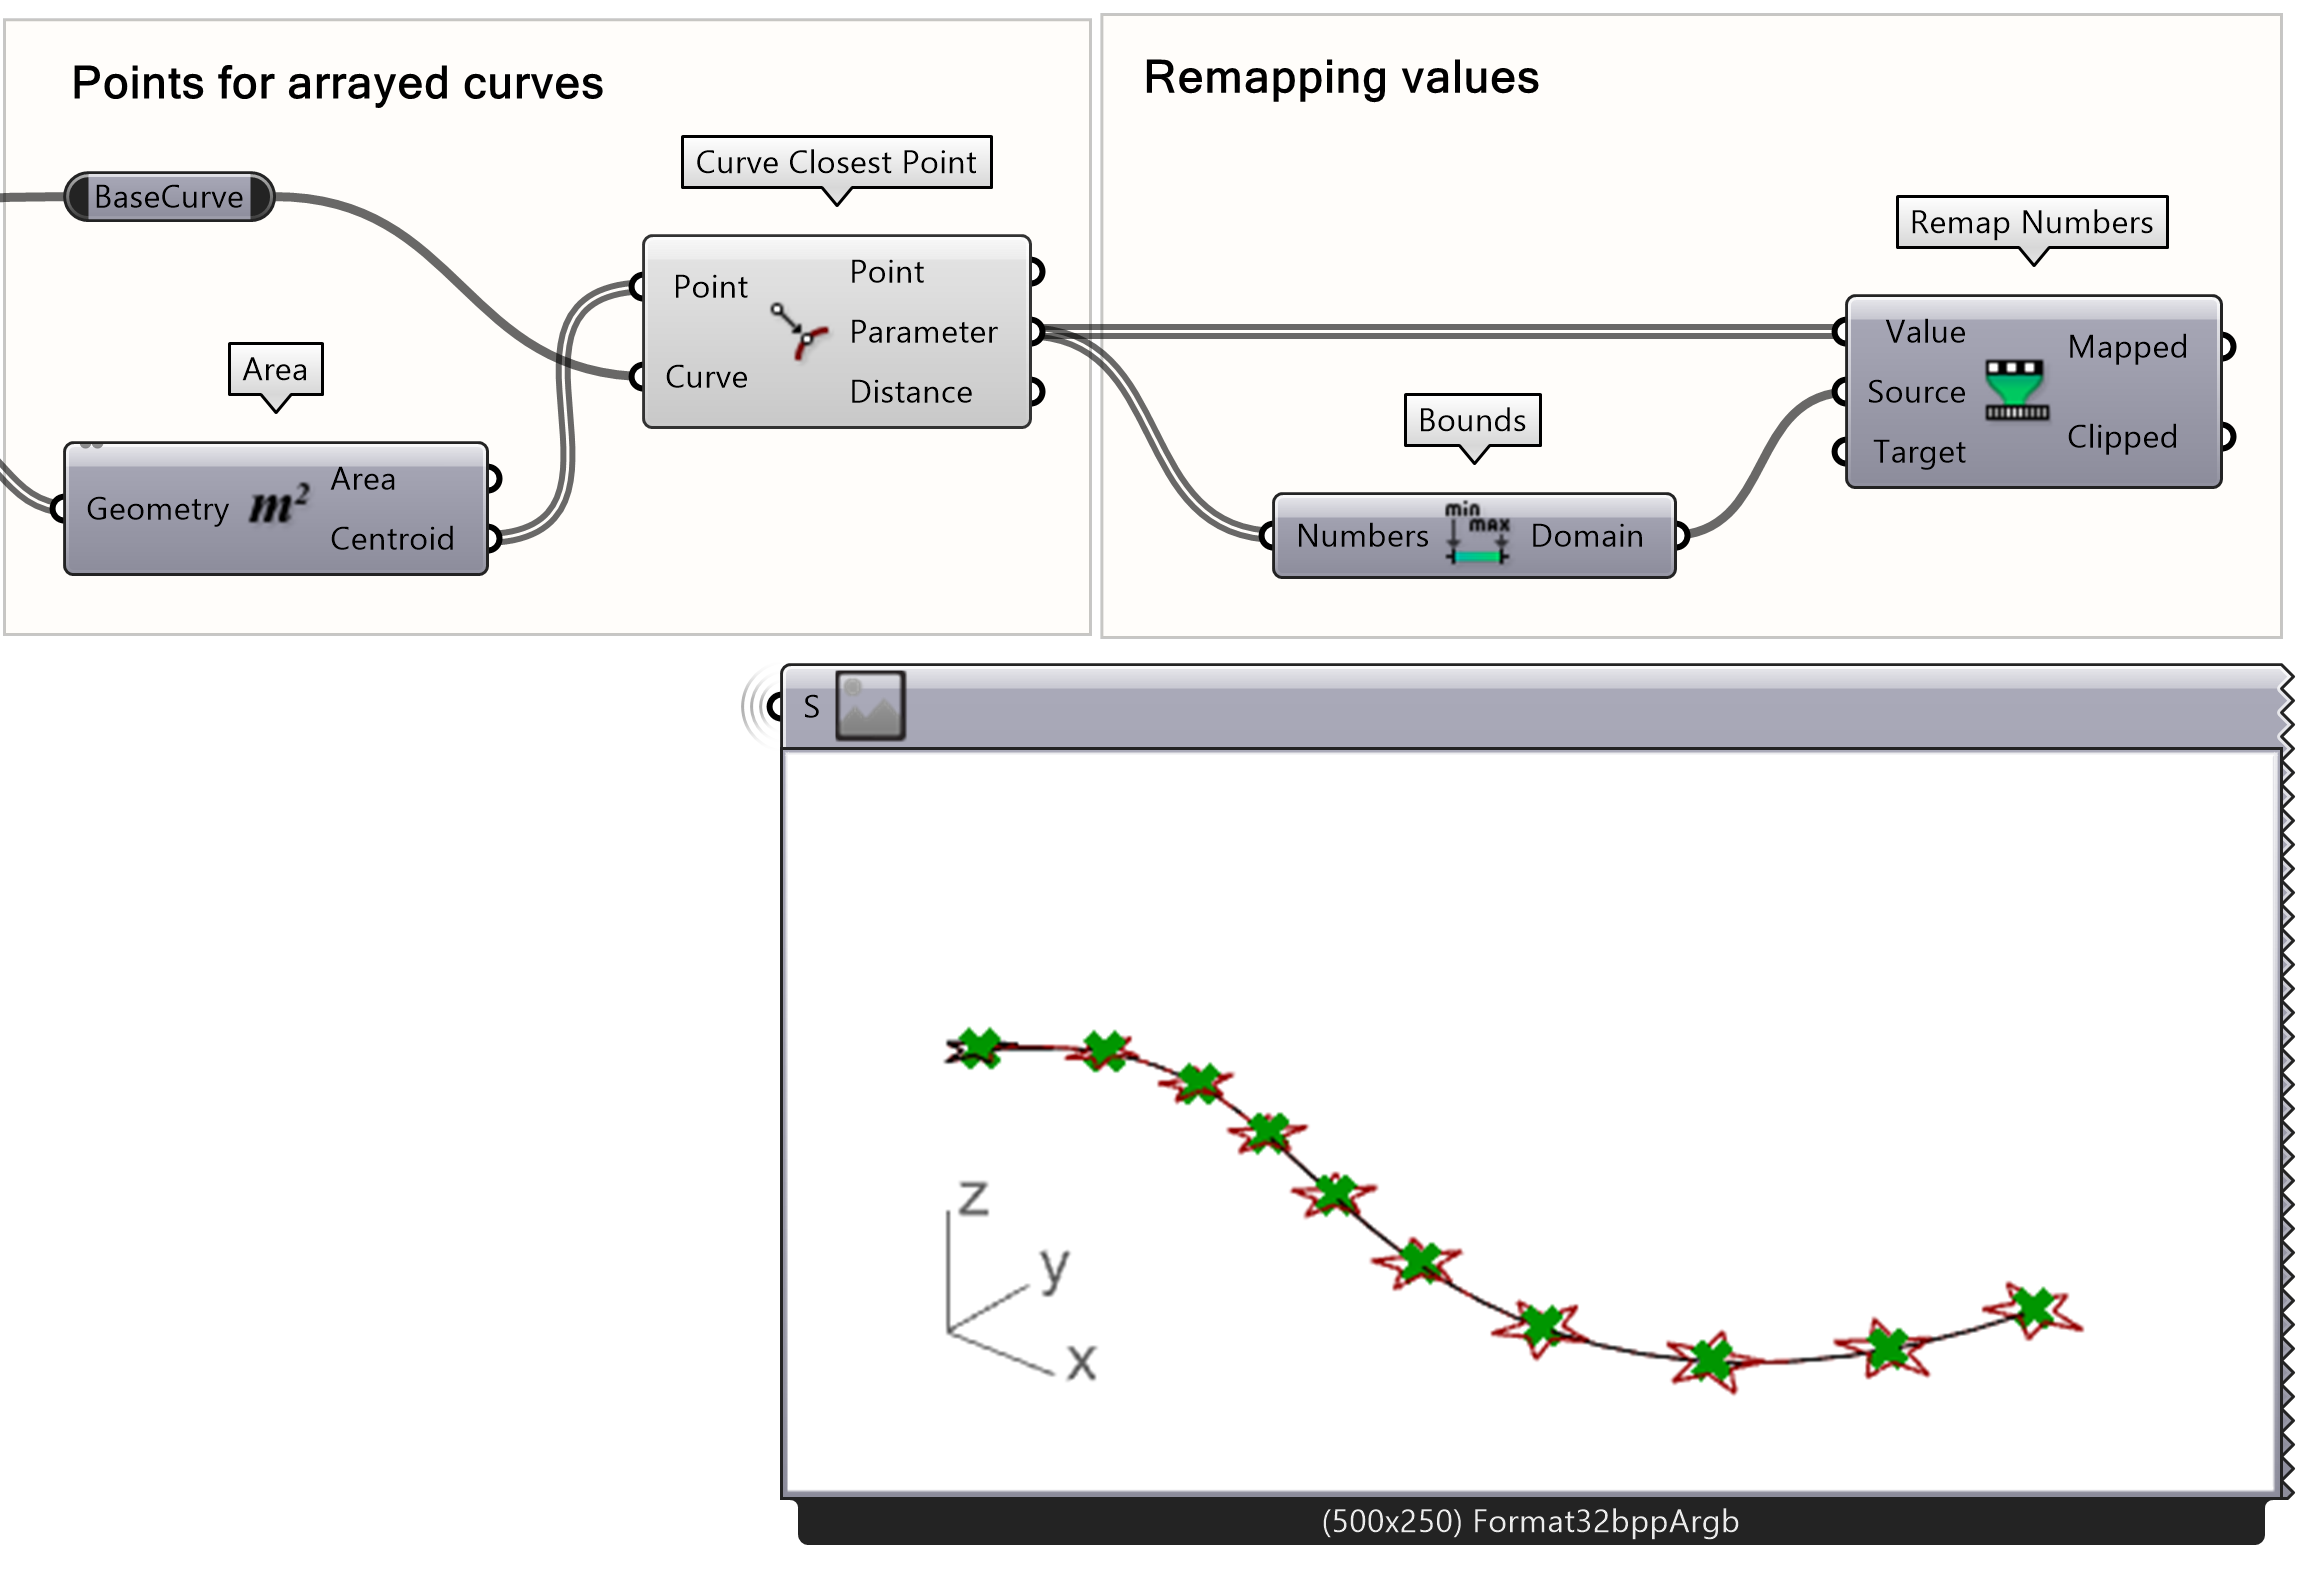
- Add a Remap Numbers component to the canvas
- Connect the Parameters of the Curve Closest Point to the Value input of the Remap Numbers component.
- Add a Bounds component between the parameters output and the Remap Numbers Source input
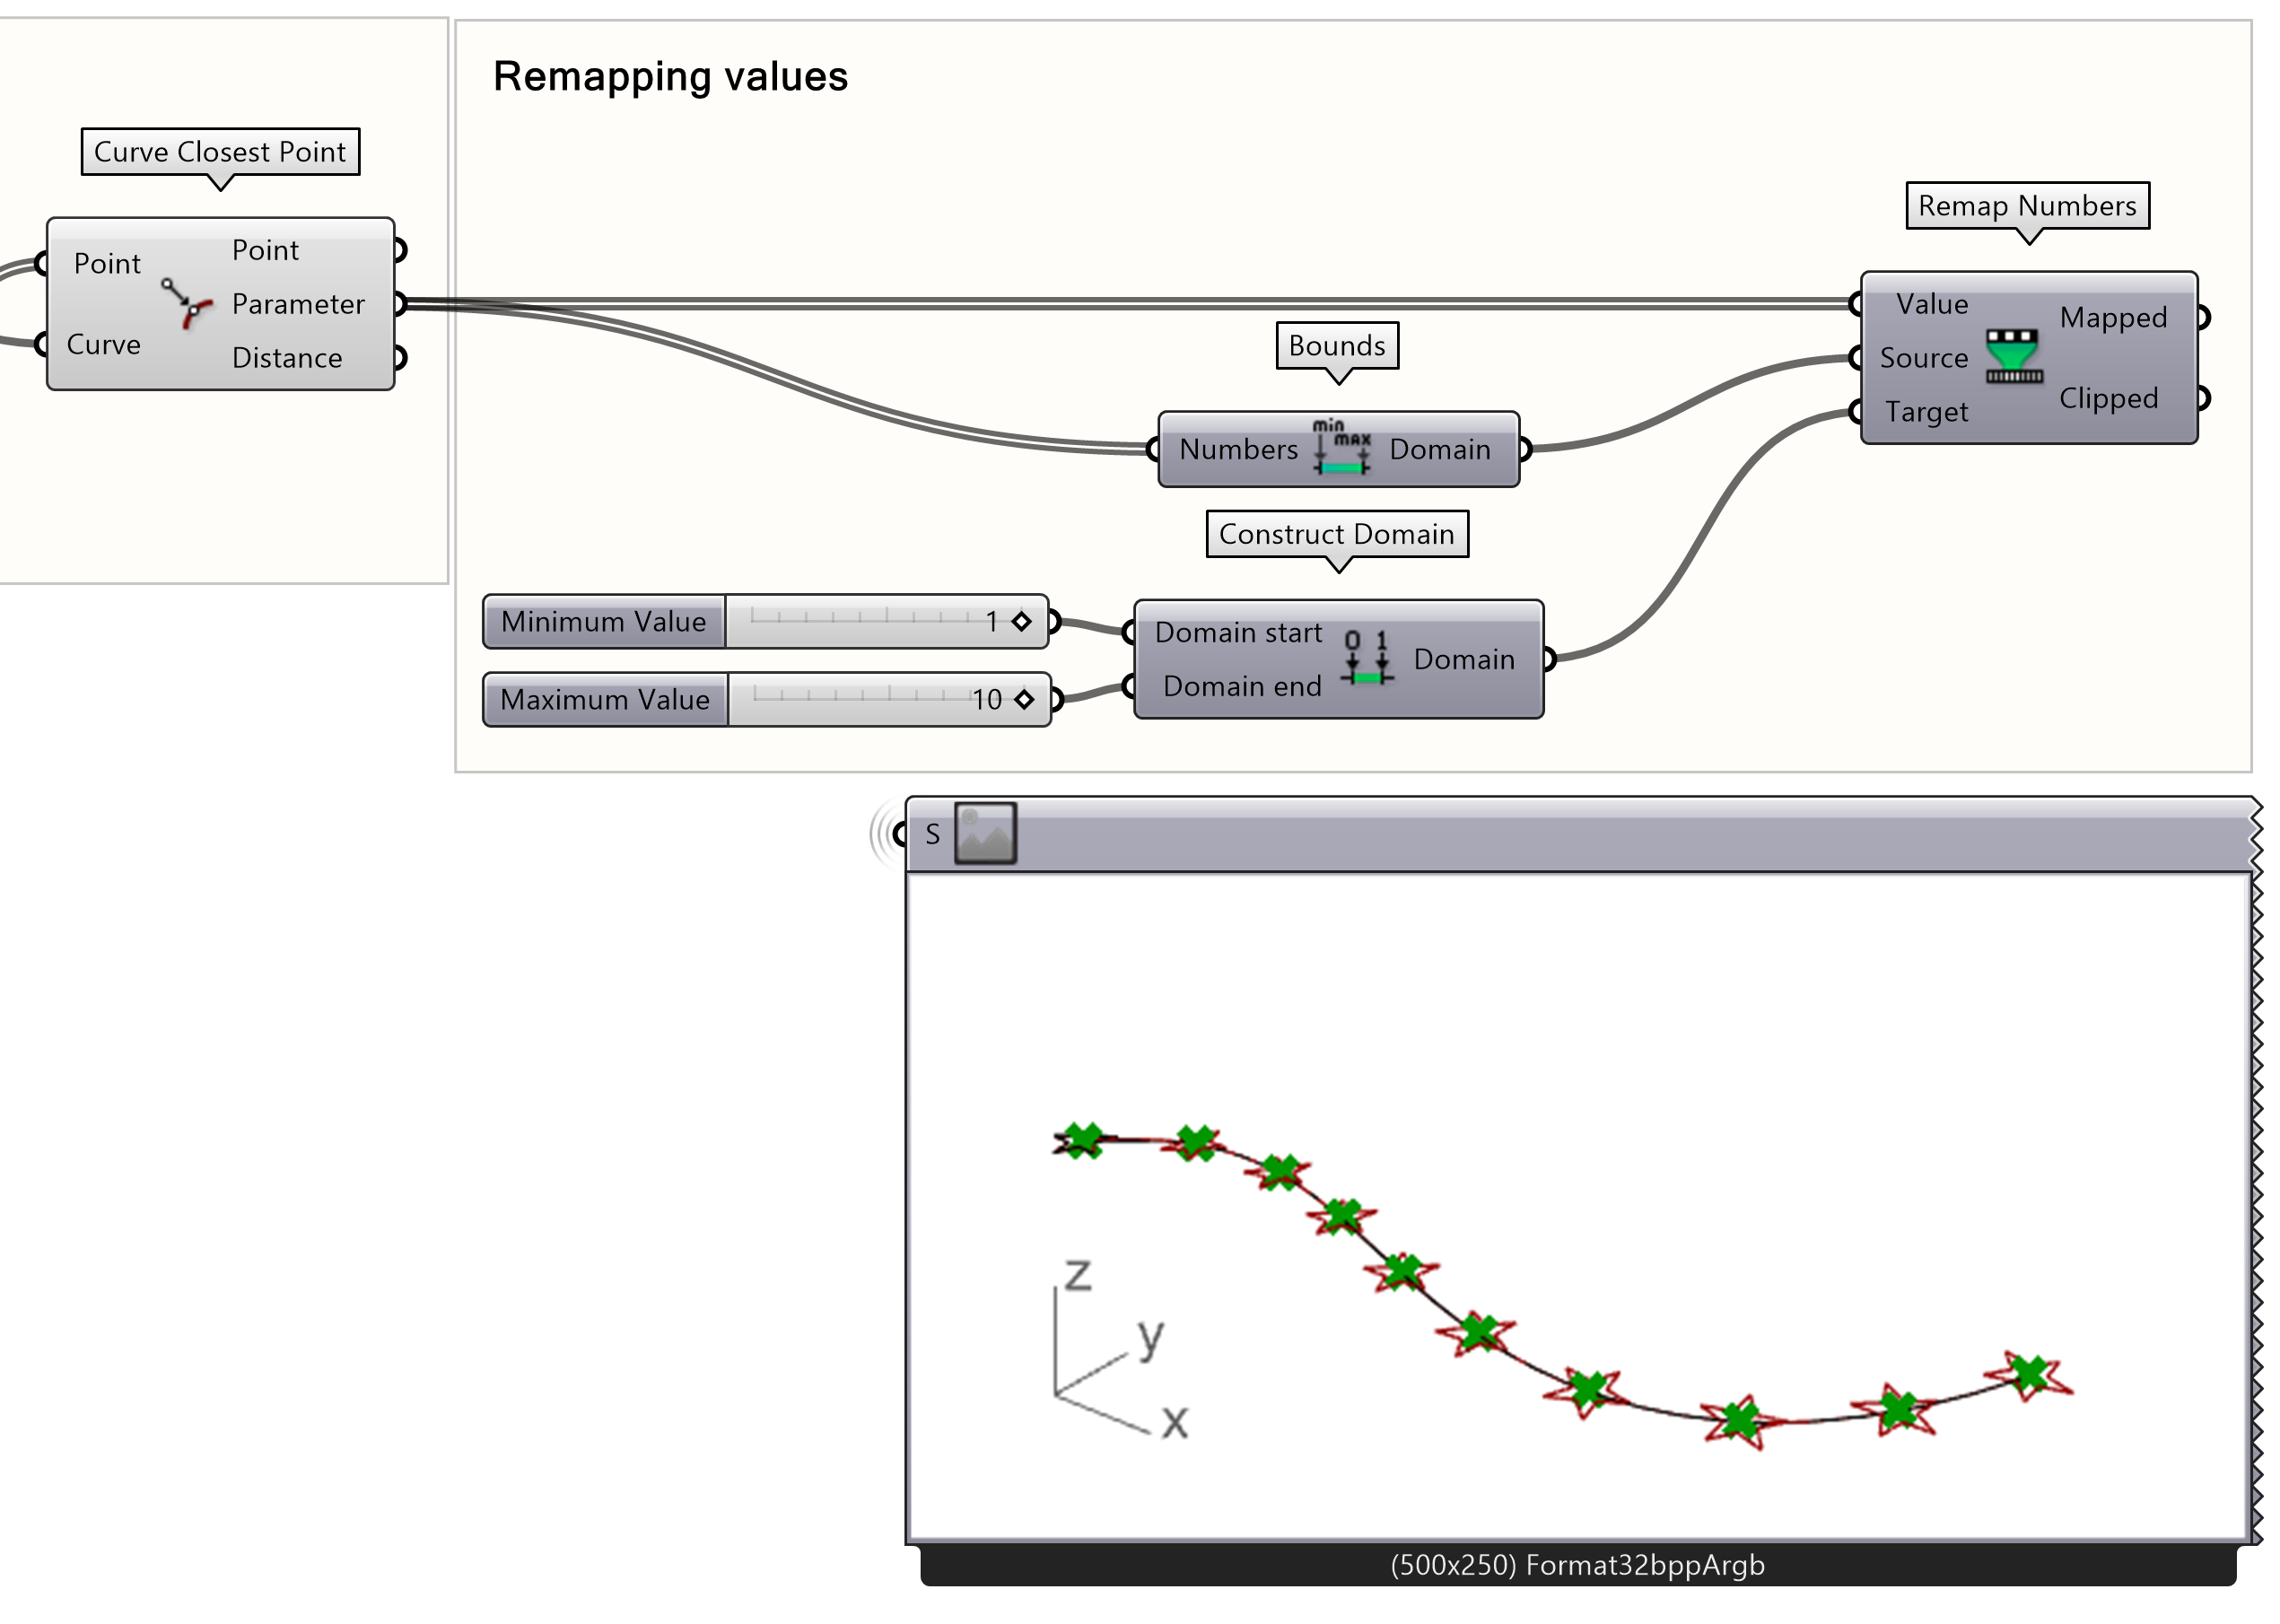
Create a domain between 1 and 10 for the Target input of the Remap Numbers component.
- Connect a Construct Domain component to the Target input
- Add a Number Slider to the start and end of the Construct Domain
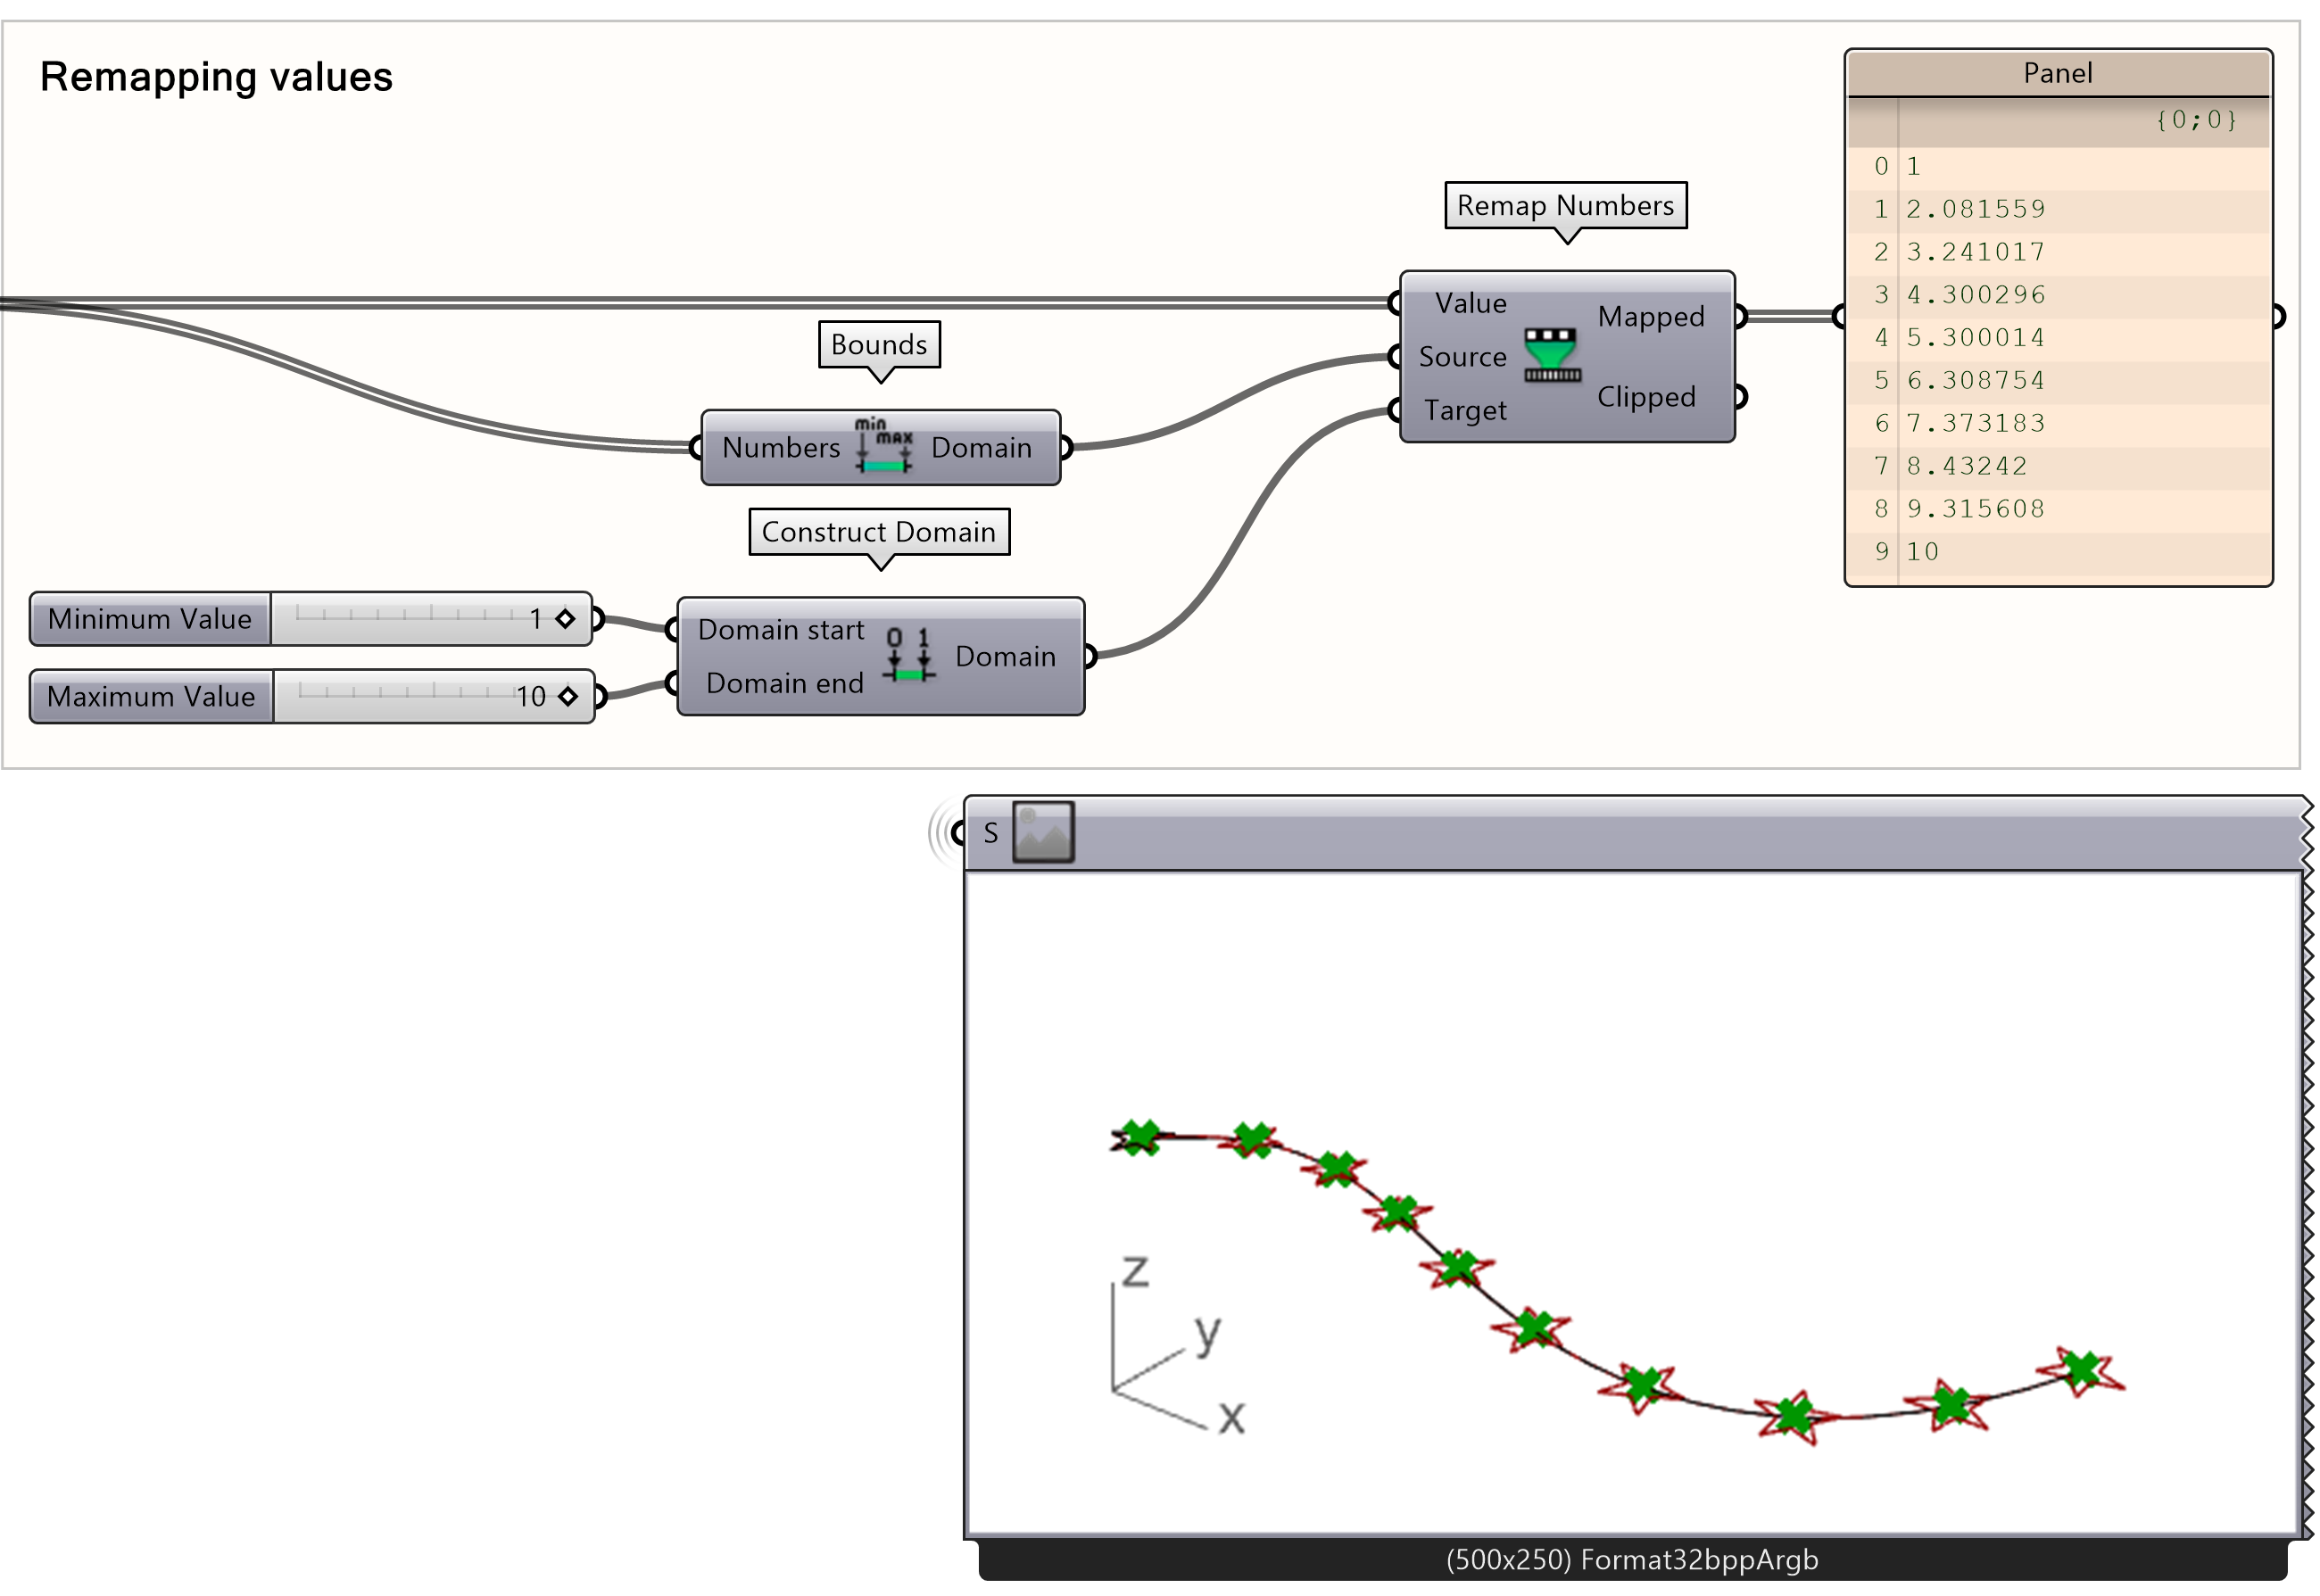
Now check if the values from the remap component gives values between your created domain with a panel.
- Connect a panel to the remap output
Now we can extrude our stars according to our remapped values! To do this, you must follow the following steps:
- Change the values to a Z-Vector by connecting the remap output to a Z-Unit vector.
- Now extrude the geometries along the base curve using the Z-Unit vector as direction.
- Cap the holes of the extrusions

The model is now finished!
Curve Frames and Arrays 4/5
Distance-Based Scaling using Graph Mapperlink copied
To control, for example, the height of the geometry according to a numeric graph, you can use the Graph Mapper function. This component can be used as an input for the Value input of the Remap Numbers component, to get for example, a sin-like shape. The Graph Mapper will create a range of numbers according to a defined graph. For this tutorial we will use the script from the previous chapter.
Take a look at this example script below. This Grasshopper script changes how a set of numbers are spread out using a custom graph and new range. At the beginning of the script, five numbers between 0 and 1 are created. Then, the Graph Mapper component is used to change the pattern of these numbers based on a custom curve (i.e. a parabola graph shown here). Finally, it scales these remapped numbers to fit within a new range from 0 to 10.

The curve can be adjusted and the distribution of the values will reflect the new curve shape.
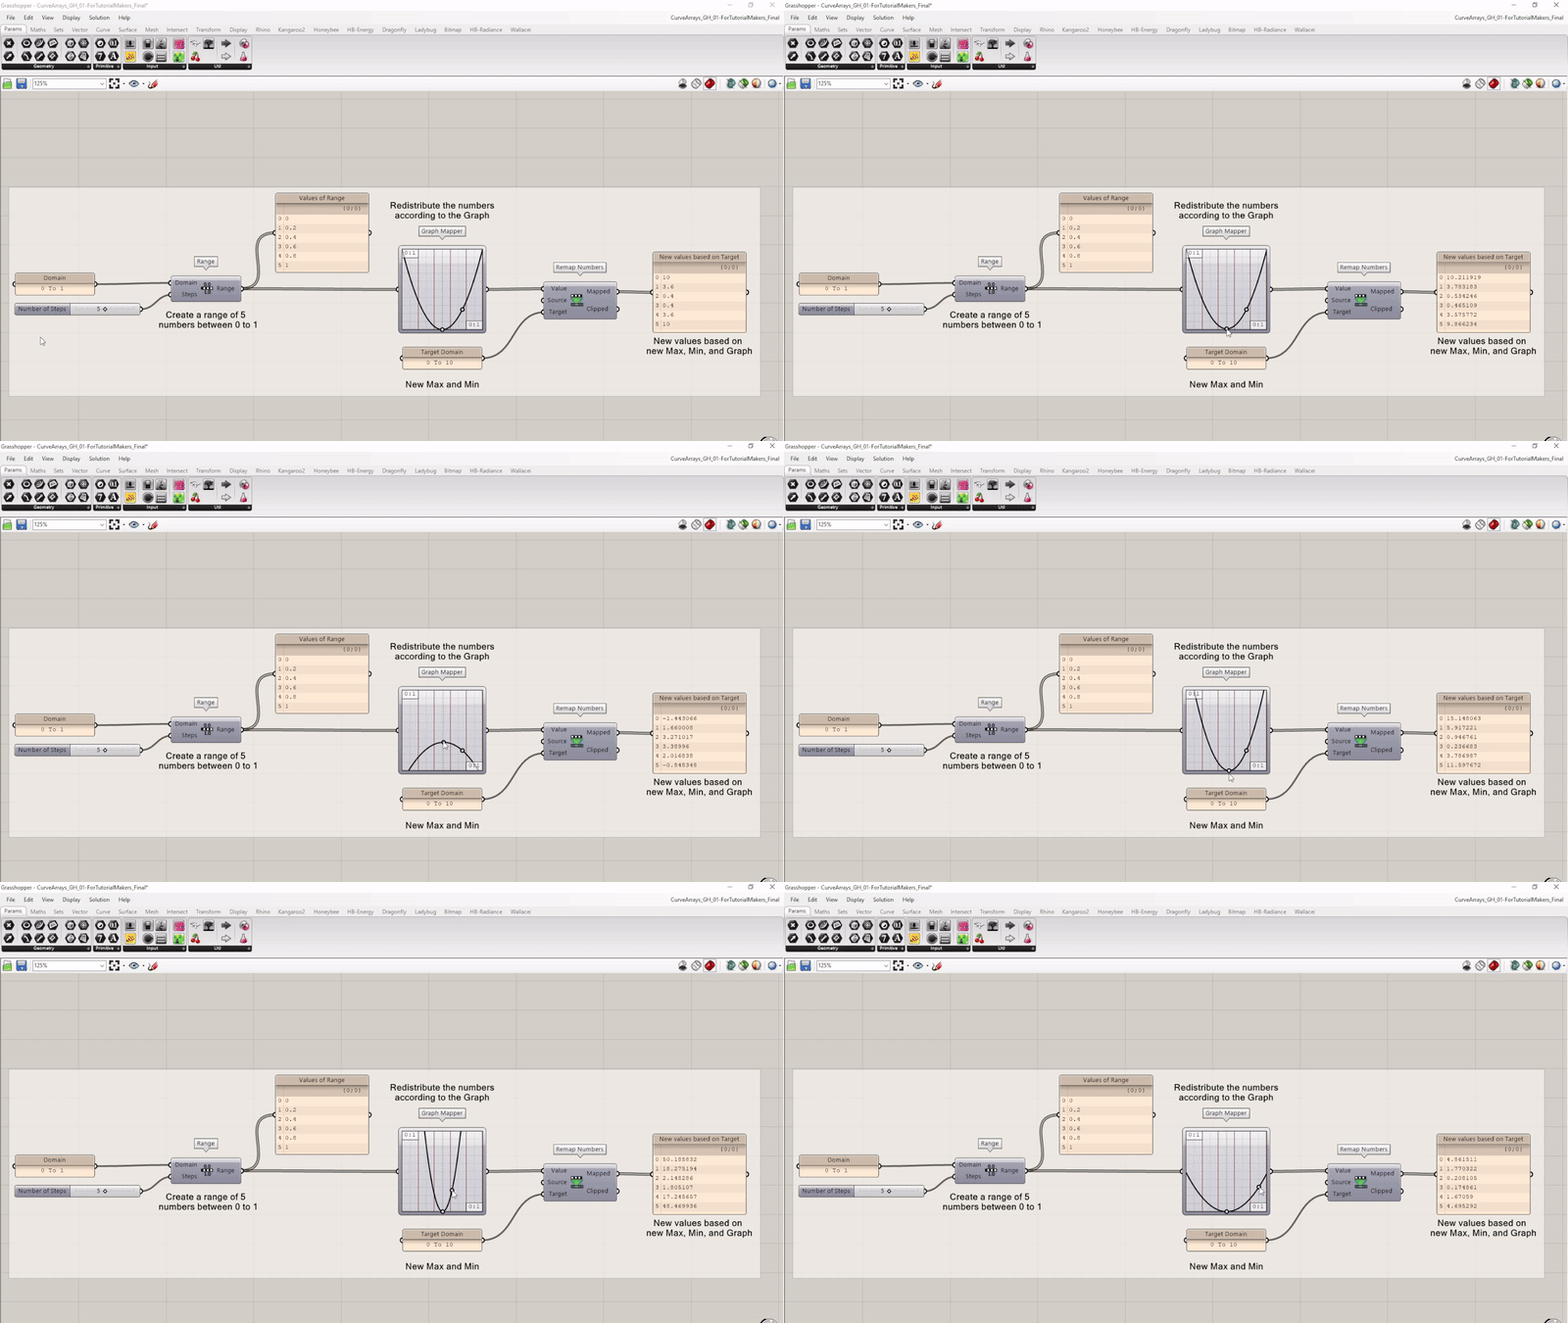
Now let’s edit the previous script to make it compatible with the Graph Mapper component. First, we must remove and disconnect a few components from the previous script.
- Remove the Bounds component
- Disconnect the Parameter output (Curve Closest Point) to the Value input (Remap Numbers)
- Remove the Area component
- Remove the Curve Closest Point component

Add a Range component to the canvas. Connect the Number Slider with the number of points to the Steps input. You can leave the Domain input as it is.
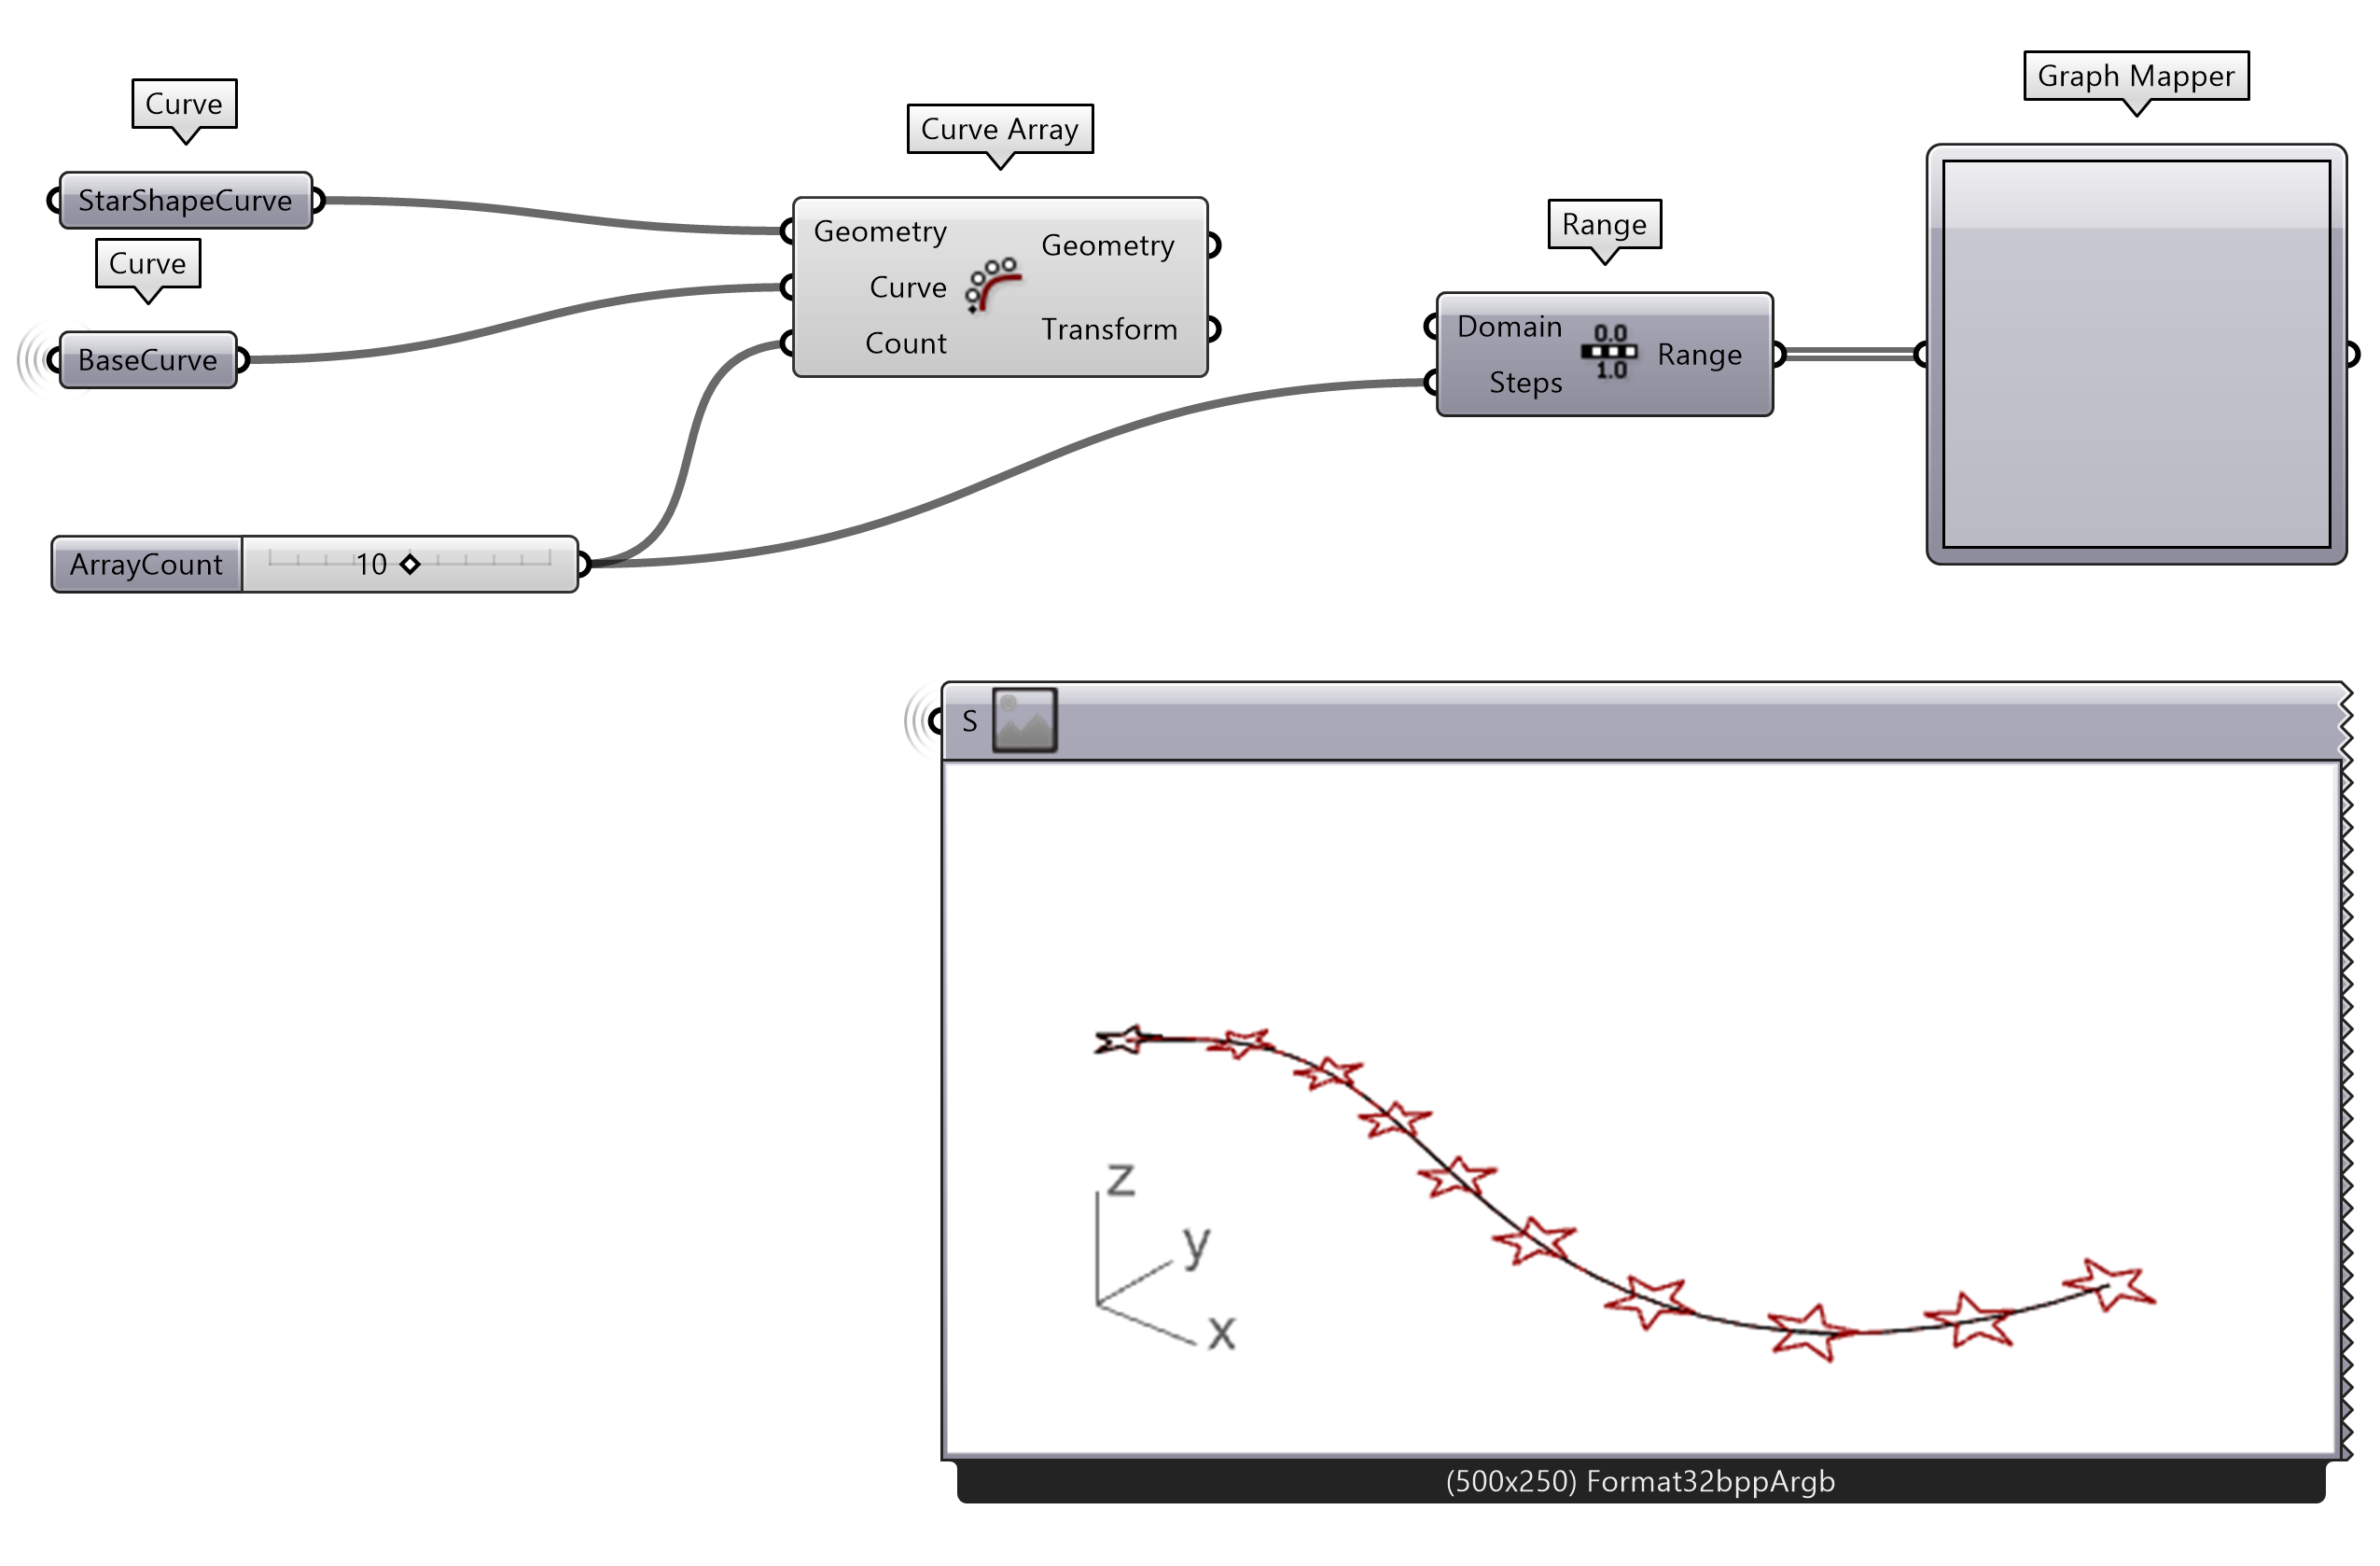
- Add a Range component to the canvas
- Connect the previously created Number Slider to the Steps input
- Connect a Graph Mapper to the Range output
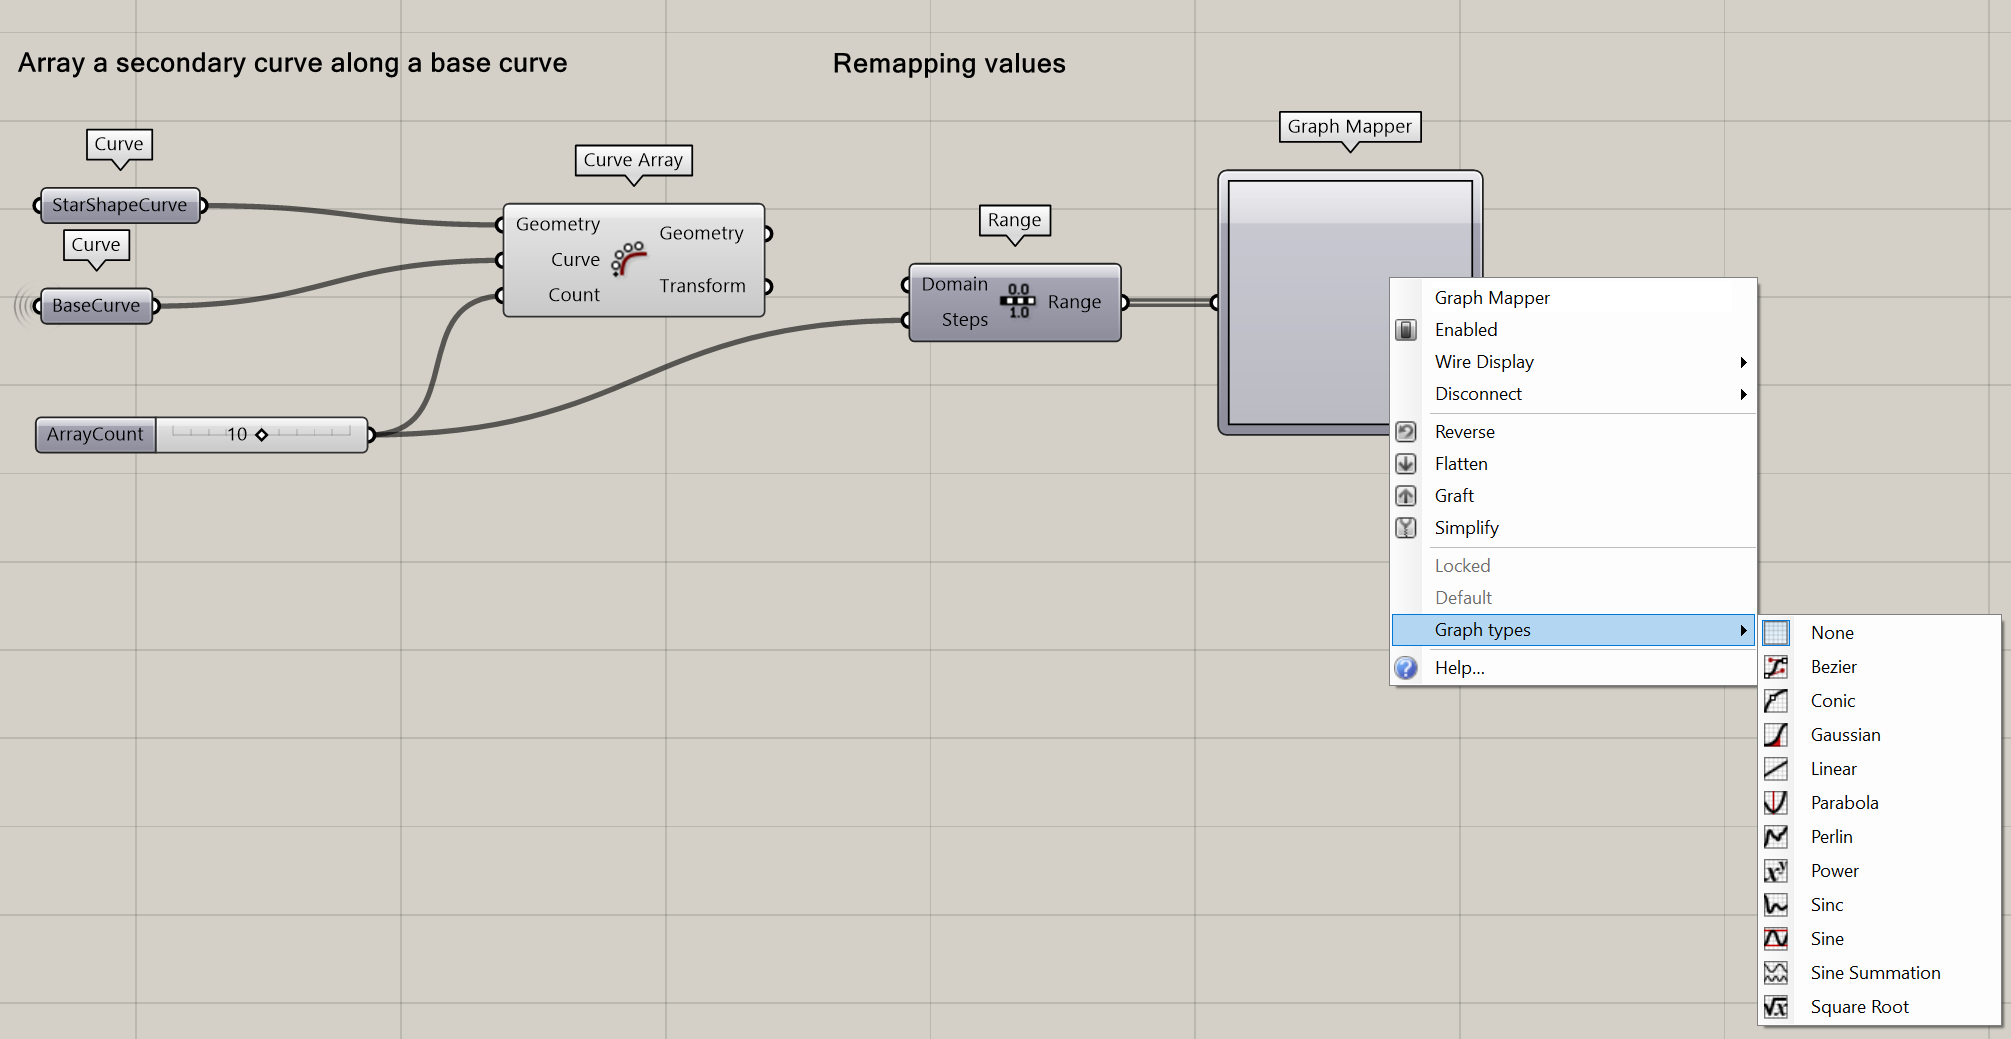
- Select the type of Graph you want
Note: By clicking on the white points of the Graph, you can alter the shape of the Graph.
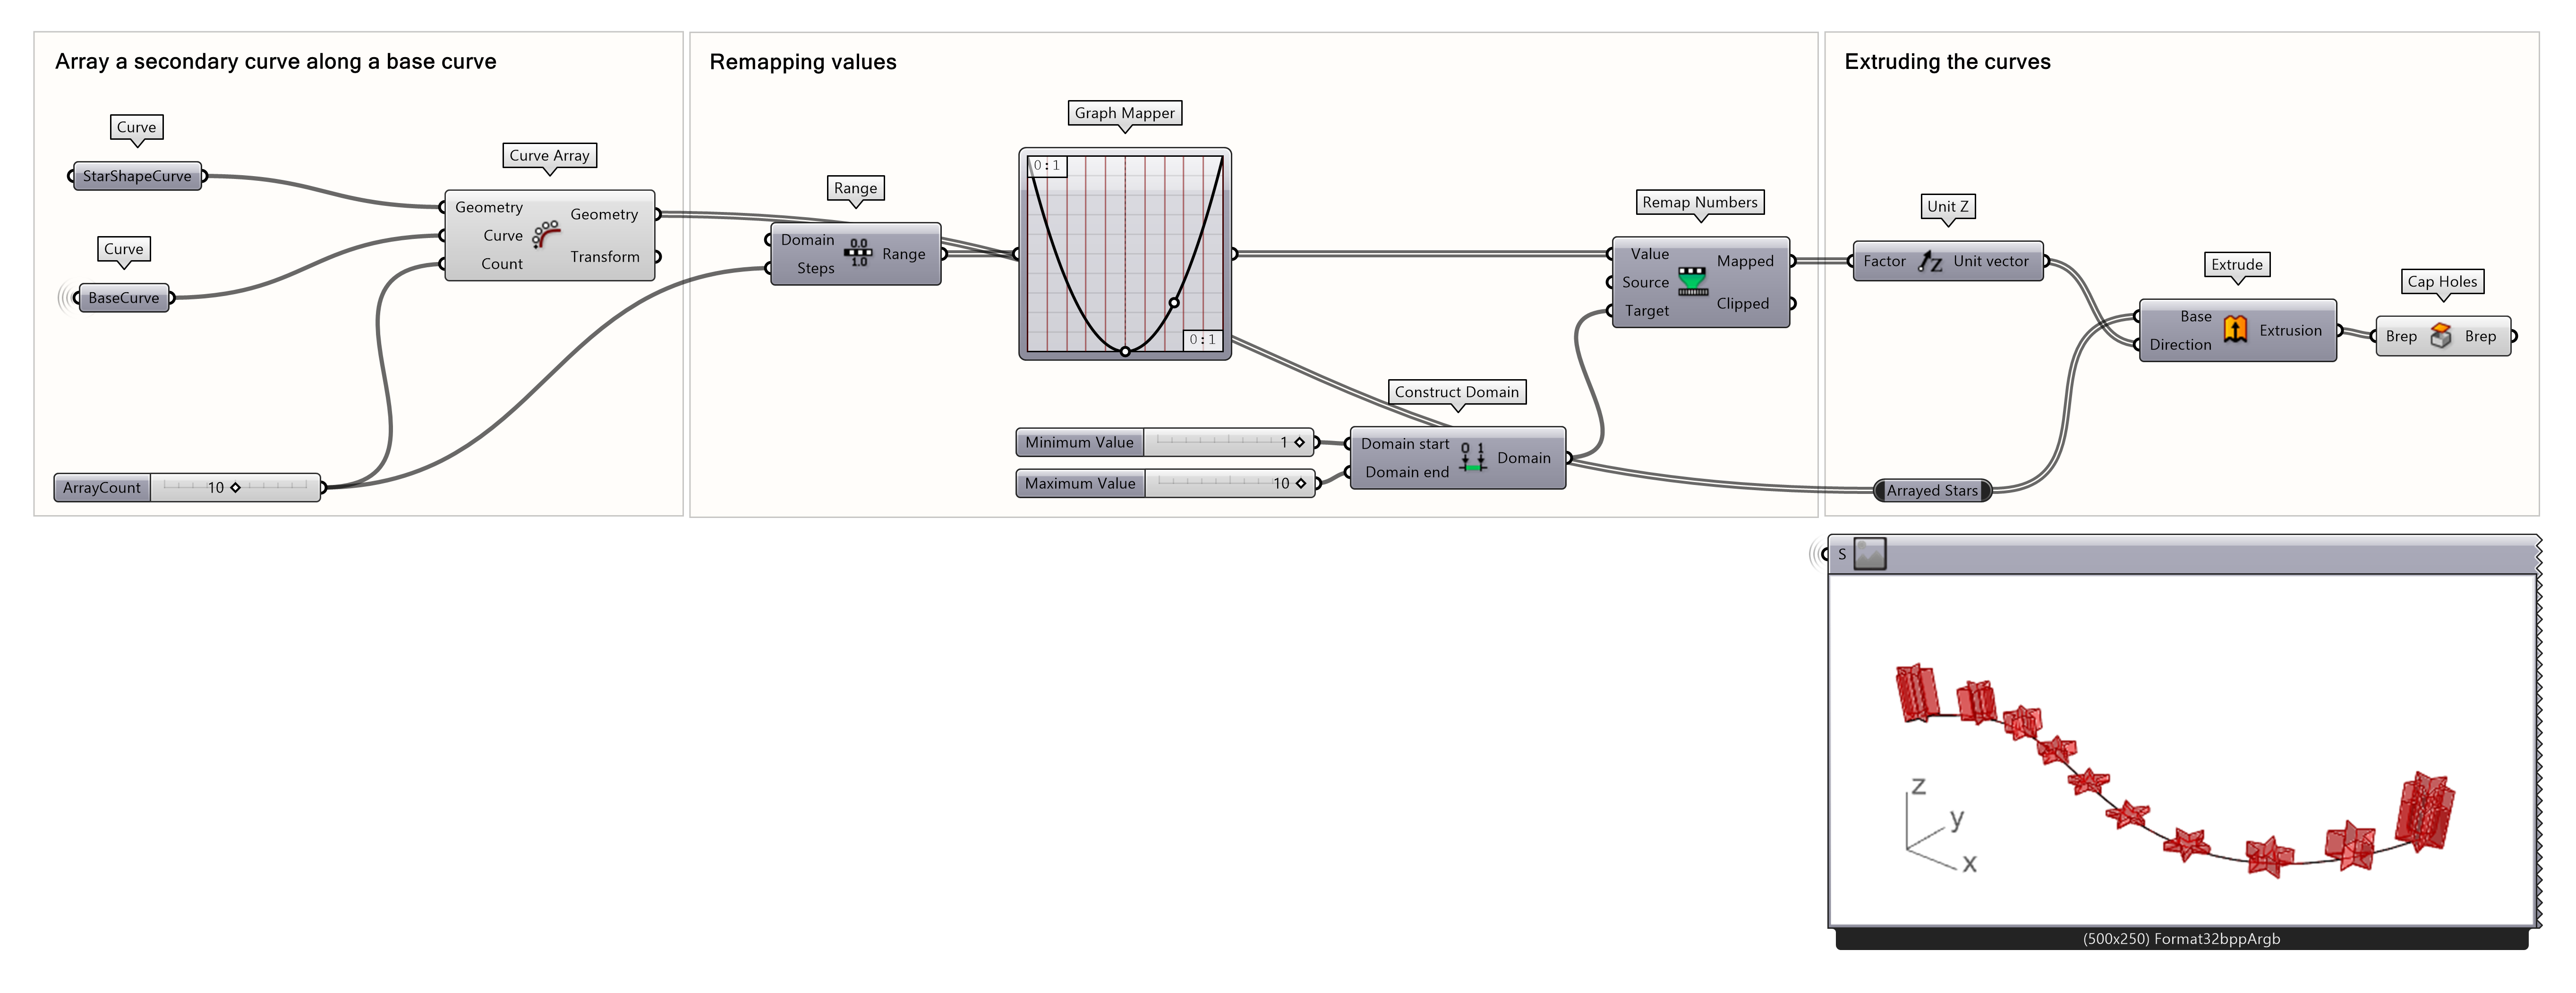
Finally, connect the Graph Mapper to the Value Input of the Remap Number component, and connect the Mapped values to the Factor input of the Unit-Z component. You now have an arrayed geometry along a curve. The height of the extrusions is based on a Graph Mapper!
Curve Frames and Arrays 5/5
Conclusionlink copied
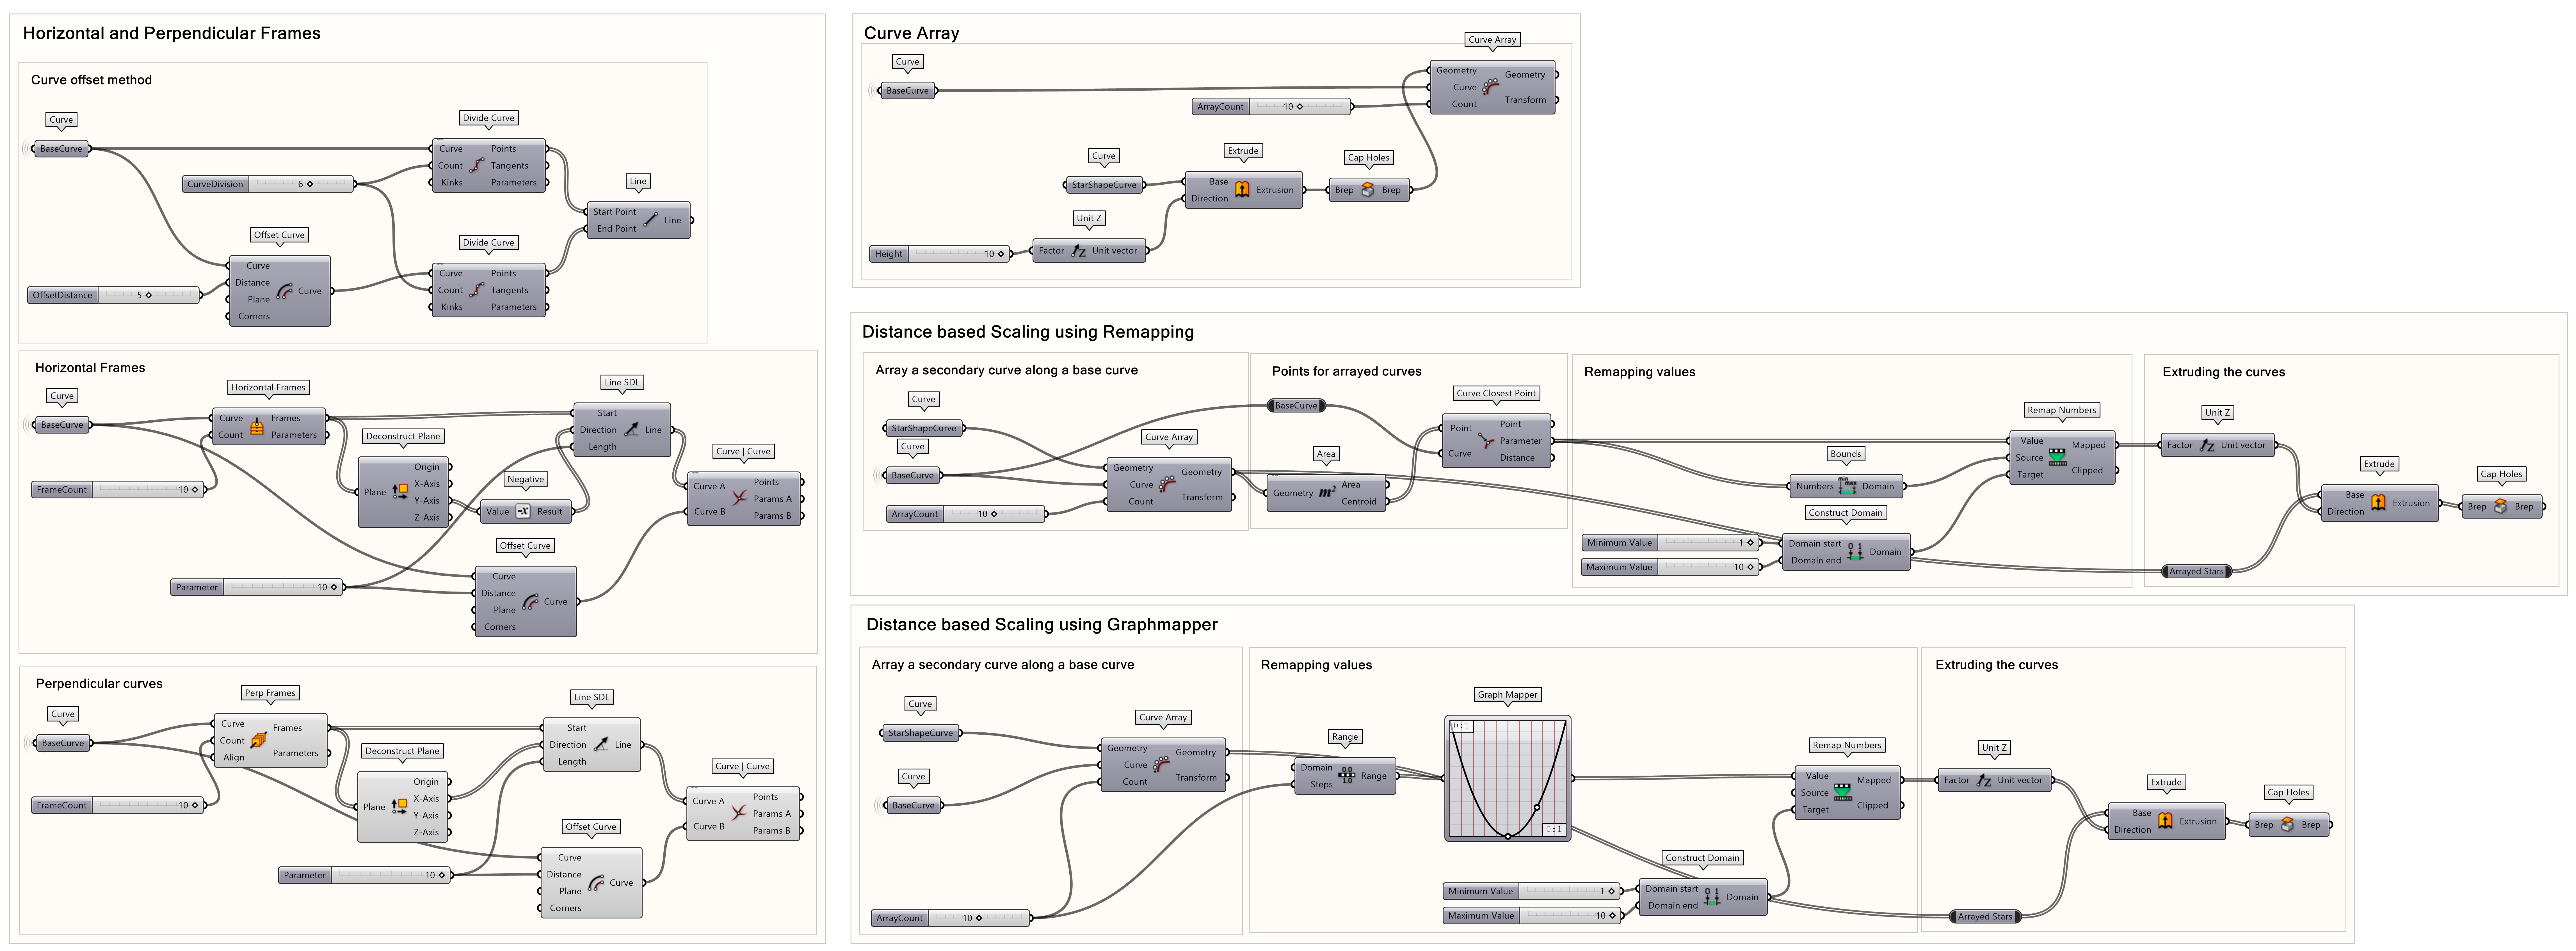
Congratulations on completing this tutorial! Along the way, you explored various techniques to divide and offset a curve, including the basic offset method, horizontal frames, and perpendicular frames. You also learned how to array objects along a curve using the curve array tool. Additionally, you gained an understanding of remapping values and using the Graph Mapper to manipulate the heights of arrayed objects. The possibilities with these tools are endless—so why not experiment further and see what creative designs you can come up with?
Link to Grasshopper File
Write your feedback.
Write your feedback on "Curve Frames and Arrays"".
If you're providing a specific feedback to a part of the chapter, mention which part (text, image, or video) that you have specific feedback for."Thank your for your feedback.
Your feedback has been submitted successfully and is now awaiting review. We appreciate your input and will ensure it aligns with our guidelines before it’s published.
