Getting Started with Python in Google Colab
-
Intro
-
Creating a Jupyter Notebook in Google Colab
-
Python Syntax Basics
-
Conditional Statements & Loops
-
Importing datasets
-
DataFrames using Pandas
-
Graphs with Matplotlib
-
Conclusion
Information
| Primary software used | Jupyter Notebook |
| Course | BKB3WV4 – Bouwkunde als wetenschap |
| Primary subject | AI & ML |
| Secondary subject | Machine Learning |
| Level | Beginner |
| Last updated | November 10, 2025 |
| Keywords |
Responsible
| Teachers | |
| Faculty |
Getting Started with Python in Google Colab 0/7
Getting Started with Python in Google Colab
This tutorial walks you through the first steps of python coding.
In this tutorial you will learn how to get started with Python, import a dataset using Python commands, and investigate the DataFrame using Pandas library. Python is a commonly used programming language in scientific research to perform data analysis and manipulation. This tutorial will show you how to get started with Python in Google Collaboratory, also known as Google Colab, using a common web-based notebook environment known as Jupter Notebook.
After completing this tutorial, you will be able to:
- Create your first Jupyter Notebook in Google Colab
- Execute basic Python commands
- Import, inspect, and describe a .csv dataset.

Note: for this exercise to work, you will need to have or create a Google account to follow along the exercise.
Exercise file
During this exercise we work with the WoOn2021 dataset. However, it is not necessary to download this dataset as we are only showing how to import a dataset, the steps work with any dataset.
You can download the dataset on the BK3WV4 Brightspace page. If you want to know more about the WoON dataset you can visit the dashboard of Woononderzoek Nederland. You can also download your own selection of the dataset at the Citavista Databank in case you do not have access to the Brightspace.
Getting Started with Python in Google Colab 1/7
Creating a Jupyter Notebook in Google Colablink copied
To get started with Python, you will need to setup your development environment, and in our case it will be a the web-based Jupyter Notebook using Google Colab.
Creating a New Jupyter Notebook File
To create your first notebook, first you will need to go to your Google Drive and create a new folder where you want to save this notebook. For example, create a new folder called “WV4 – Workshop 1” in your drive.
To create a new file:
· Right-click on the empty Google Drive Canvas or Press the “+ New” button to create a new Google Collaboratory file. Rename your notebook to
‘FirstNameInitialLastname_WV4_Workshop 1.ipynb’
o Note: .ipynb is the file extension for a Python Jupyter Notebook. Make sure to include that in the file name.

This file is now saved in your Google Drive account and can be accessed using Google Colab. Once you created the file, double-click it and you will see the inside of the Python Jupyter Notebook. The Jupyter Notebook has cells where each can contain code, text, and images.
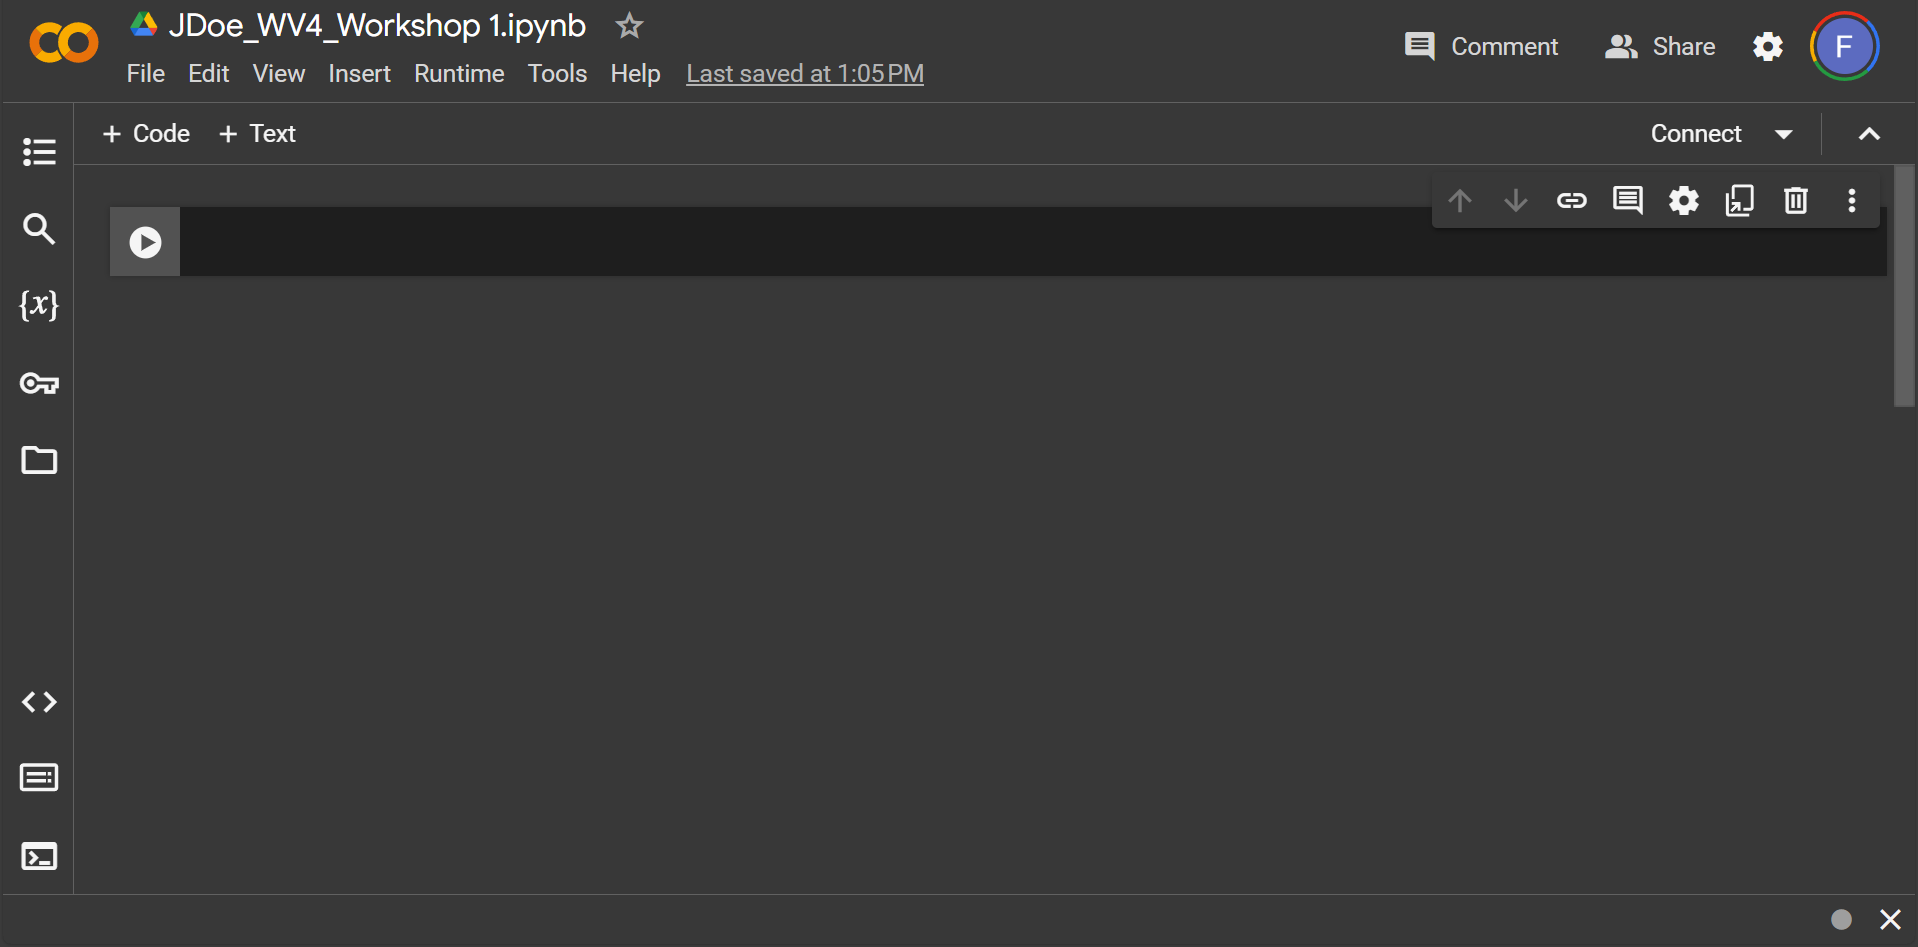
Run your first line of code
Now add this code snippet in the field and press the play button, or click ctrl+entr to execute a code field.
print(Hello, World!)
You will receive an error. The error messages below are critical for troubleshooting why your code is not running and it can even point out where the error is using the ^ arrow. The reason why it is an invalid syntax is because we need to add quotation marks in between the ‘Hello, World!’ so that the code can run. Add quotation marks between the text to see the results.
Note: Error messages happen all the time, don’t get stressed about receiving those. Most of the time the error message explains clearly what is wrong with the line of code. It might take some time to understand how the message is given, and what it means.
Now add the quotation marks between the text:
print('Hello, World!')You will notice two things:
- Your file is now ‘connected’ to the cloud to execute the code
- Your output will read Hello, World! which is the text that was inserted between the quotation marks.
Note: that Python functions are case-sensitive. So if you change the first letter to a capital letter (Print) then you will get a syntax error.
Python Syntax Basics
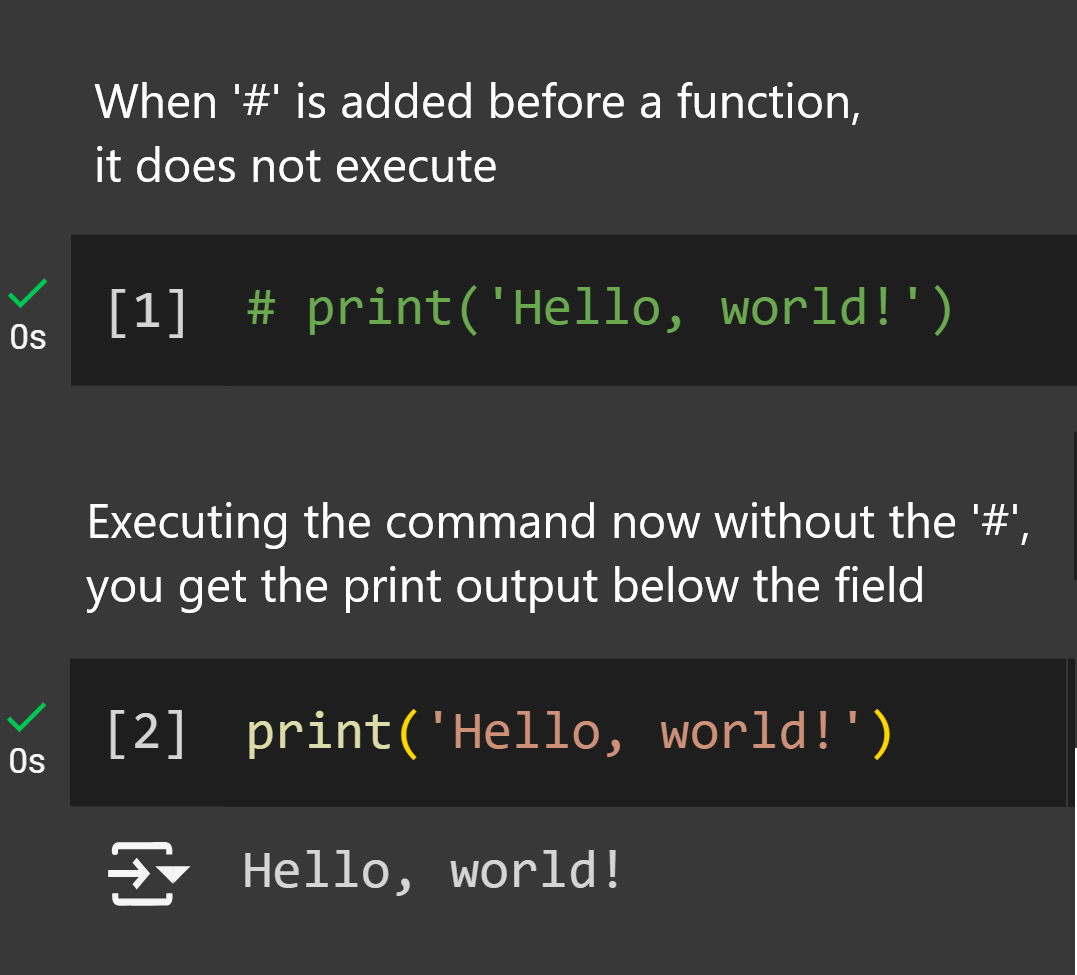
In the previous section, you have already executed the print command which outputs a string of text. You can choose to activate or deactivate this code by adding the # symbol before the code. Go ahead and add this symbol before the print command. This will deactivate the code and turns it into a comment.
# print('Hello, World!')Commenting is a useful technique to help with explaining your code better. You can write anything after the # symbol to explain the logic of the code.
Add a New Text Field
In addition to code fields, you can add a ‘Markdown’ field which is indicated by the “+ Text” option when you hover over the lines in the notebook.
Markdown is a language markup language which you can use to add rich text to your notebook. In the previous sub-section, you learned that adding the # symbol deactivates a line of code. However in the Markdown fields, adding the # symbol will make turn the text into a heading (large and bold), adding two ## symbols turns it into sub-heading.

Now try to add a new markdown field and copy the following snippet:
# Create a header for your section
And add additional information as text. This helps to keep your file organised and gives space to add comments to the file.
Once you activate the text field, on the left is the Markdown field, on the right you will see an instant preview of how the text will look like. Your table of content will also display your header as a section to help organize your notebook.

The nice thing about adding a heading is that it can organize your notebook in sections to help navigate your notebook and improve your code’s legibility for you whenever you review your code again or whenever you share your code with someone else to read.
Restarting your Session
Your Jupyter Notebook runs codes sequentially downstream from top to bottom. Sometimes you will encounter errors even when you are sure you have the correct syntax. This could be an issue with Jupyter Notebook, restarting your notebook session can help reset the variables which could help with solving some problems.
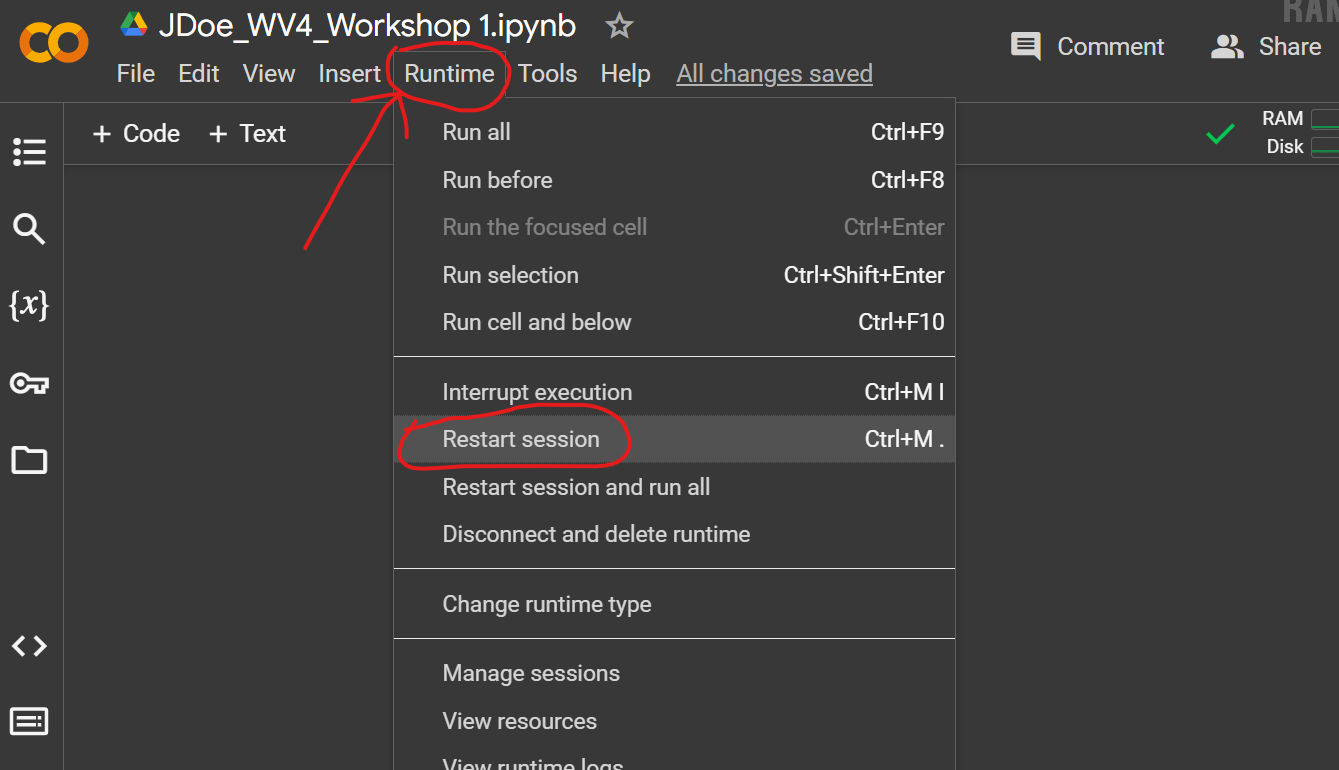
To restart your session, in the menu bar, click Runtime and Restart Session, or Ctrl+M. in Windows to restart your session.
Performing a session restart can be useful when you change your code significantly in the notebook.
Note: if you need to undo text edits within a field, you can use the usual Ctrl+z in Windows. But when you delete a field and you want it back, type Ctrl+Z+M in Windows all at once. Generally undoing actions is not reliable and it’s best to keep this in mind to avoid losing progress on your code.
In the next section, we will introduce Python programming syntax structure and execute useful commands when programming in Python.
Getting Started with Python in Google Colab 2/7
Python Syntax Basicslink copied
This tutorial will go over basic Python operations to help you get started with importing, inspecting, and describing a dataset from a .csv file. This is by no means an extensive introduction to Python, and it is recommended to learn the fundamentals of Python with these resources:
Data Types
Python works with different data types. It is important to assign the right data type to the data and check it. You can assign values to variables in python using the = sign and a data type for the assigned variables. For example, you can set variables to include text, known as strings, and numbers which can be integers which are whole numbers that can be positive or negative or zero, and floats which are decimal values. See documentations on Variables and Basic Data Structures for additional information.
Here’s a quick rundown of some of the most useful data types of a single item to be aware of:
- String: a data type to store text.
- For example,
'This is a string'which are inside single or double quotation marks.
- For example,
- Integer: a data type to store whole values.
- For example,
0or1, etc.
- For example,
- Float: a data type to store decimal numbers.
- For example,
0.0or1.0, etc.
- For example,
- Boolean: a data type to store True/False binary values.
- For example,
TrueorFalse
- For example,
- NoneType: is an empty data item or a null value
- For example,
Nonewhich describes a null value or no value.
- For example,
- NaN: is a null value commonly used in DataFrames specifically for numerical data.
- For example,
NaNstands for “Not a Number” which describes a datapoint that has no value. This allows the code to execute even though the dataset might have missing values.
- For example,
More advanced data types consisting of a collection of values:
- List: a data type to store ordered sequence of items in a single variable.
- For example,
[1, 2, 3]items inside square brackets and separated by commas.
- For example,
- Dictionary: a data type useful for mapping categorical value to range of labels
- For example,
{“building_type”: [“education”, “residential”]}inserted inside curly brackets, on the left is the dictionary ‘key’ and on the right can be a single or a list of items.
- For example,
- Tuples: a data type that stores multiple items in a single variable which cannot be altered.
- For example,
(x, y)inserted inside parentheses.
- For example,
- DataFrame: a data type used with a popular Python library called Pandas which helps reading and manipulating tabular datasets.
- Array: is a data type similar to lists but holds items of the same data type (i.e. floats only)
There are more data types in Python but we will introduce the most basic ones for now. The table below shows a summary.
|
Data Type |
Description |
Example |
|
String |
Text |
‘This is a string’ |
|
Integer |
Whole values |
1 |
|
Float |
Decimal numbers |
1.0 |
|
Boolean |
True/False |
True |
|
NoneType |
Empty item or null value |
None |
|
NaN |
Null value |
NaN |
|
List |
Sequence of items |
[1, 2, 3] |
|
Dictionary |
Mapped categorical items |
{“building_type”: [“education”, “residential”]} |
|
Tuples |
Multiple items in a single variable |
(x, y) |
Variables
A variable is symbolic name that holds value or data. The variable name assigned remains fixed and the data within it can change. For example, x = 1 is variable where ‘x’ is the variable name and ‘1’ is the value that the variable holds, which is a single integer value. A typical type of variable you may see in everyday life is your home’s thermostat where the variable’s name is ‘temperature’ and the variable is the temperature reading as a float value.
To assign a variable, you will use the = sign. Let’s assign some variables using the code below:
Building_name = "Bouwkunde" # str data type
Year_built = 1945 # int data type
Area = 14847.0 # float data type
Has_library = True # BooleanNote: you see here that we used # after the code to leave a comment behind. This helps make your code more legible for you when you review your code and especially when sharing your code with others.
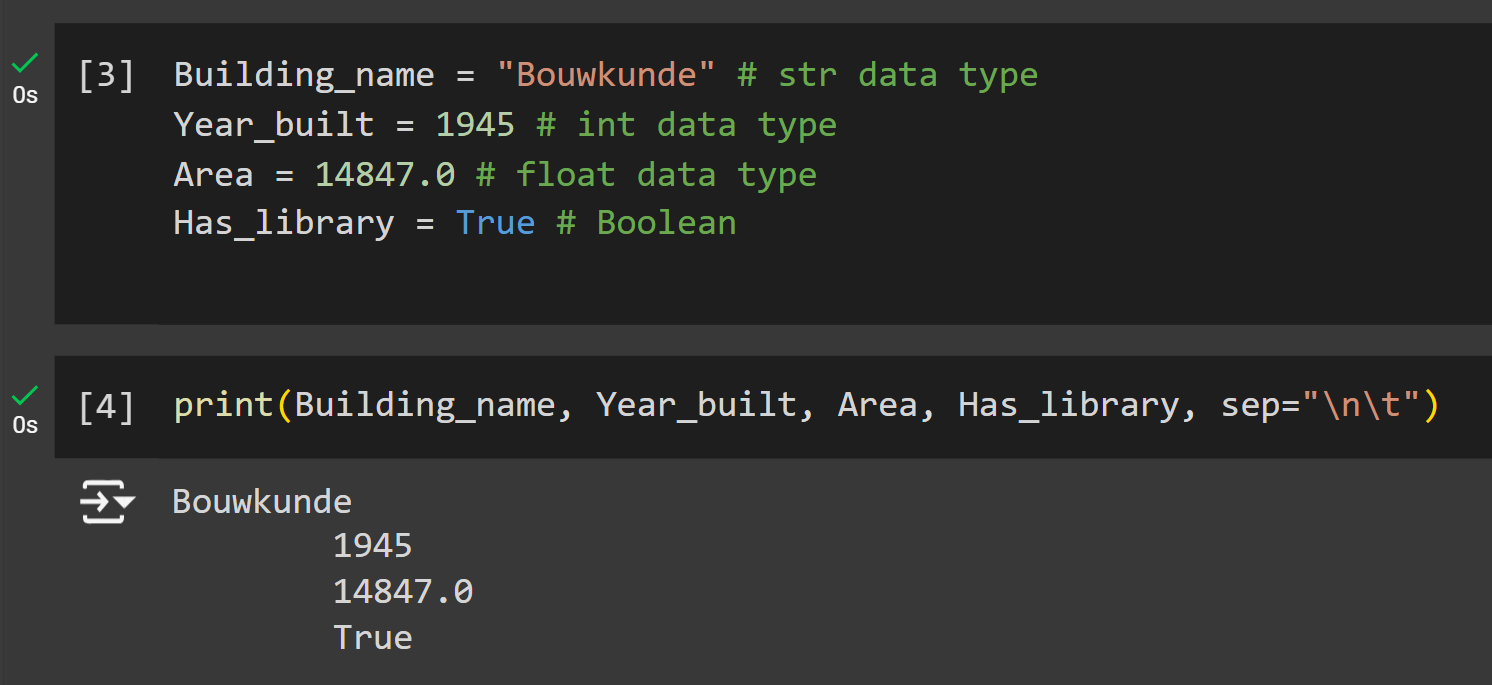
Copy those variables into your notebook, then perform a print command to list the content of the variables:
print(Building_name, Year_built, Area, Has_library)The output will be the stored value in each variable you’ve assigned earlier.
Note: variables are not allowed to have spaces between words, using underscore _ is a common way to name variables that has multiple words. Variables are also case-sensitive, so Building_name is not the same as building_name.
Creating a List Variable
A common way to store multiple values in a single variable is within a list. Meaning, a variable that contains a list of ordered sequence of data. To create a list variable, the values need to be placed inside the square brackets [ ] to be stored as a list of values.
Let’s make a list of integers using the following code:
data = [0,1,1,2,3,5,8,13,21,34] # A list of integers
print(data)
Access Items in a List
Accessing a single or a range of data in a list can be performed by specifying data you wish to select inside of square brackets “[]”.
- To select the first item in the list, you can type
data[0].* The first value in a list always starts with 0, then 1,2, etc. - To select the 7th item in the list, you will have to have to enter
data[6], notice that the 7th item on the list has an index value of 6 and not 7. - To print a range of data, you will enter a
:“colon” punctuation mark between the two index values. The range will include the values of the first and last index in the range selection and everything in between. - If you leave the second range value empty, i.e.
data[:4], it will take all the values until the 4th index. And if you leave the first range value empty, then it will exclude the first index selection and include everything until the final index. - To select the last item in a list, you can use the
-1value, e.g.data[-1].
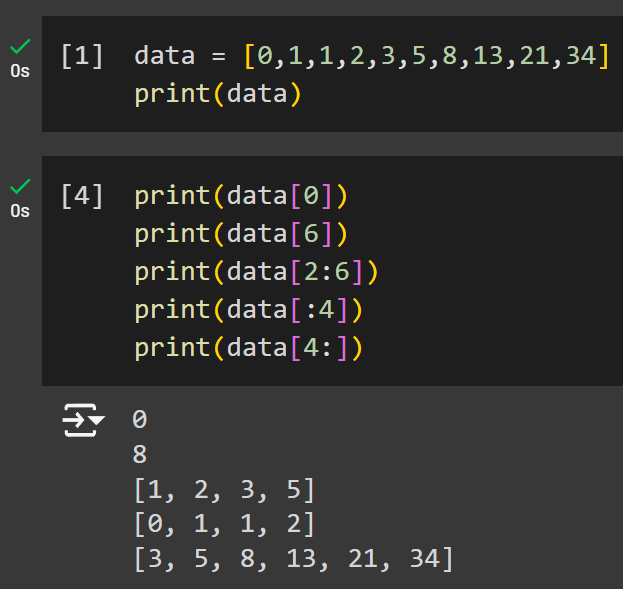
Copy the following code to select a specific item out of the list, range selection, and show the result.
data = [0,1,1,2,3,5,8,13,21,34] # A list of integers
print(data)

print(data[0])
print(data[6])
print(data[2:6])
print(data[:4])
print(data[4:])
You now worked for the first time with selecting items from a list. You can now apply the same technique to different cases. The table below gives an overview of the functions we discussed.
|
Function |
Description |
|
list[1] |
Select a specific index of a list |
|
list[-1] |
Last item of list |
|
list[2:5] |
Range of index |
|
list[:4] |
Gives items from the start until index for (excluding index 4] |
|
list[4:] |
Gives the 4th item until the end of the list |
Basic Python Functions
Python can execute functions which are pieces of code that performs a specific task. For example, we used the print function in the previous sub-section. Functions expect arguments to work. For example, running the code print() will return nothing because it will expect some kind of data in between the parentheses.
Here is a list of basic functions that are used commonly:
|
Function |
Description |
Example |
Output |
|
print() |
Outputs text or variables |
print(“Hello, world!”) |
Hello, world! |
|
type() |
Returns the type of an object |
type(42) |
int |
|
int() |
Converts a value to an integer |
int(“42”) |
42 |
|
float() |
Converts a value to a float |
float(42) |
42.0 |
|
str() |
Converts a value to a string |
str(3.14) |
“3.14” |
|
len() |
Returns the length of an object (string, list, etc.) |
len([1, 2, 3, 4]) |
4 |
|
sum() |
Sums of a list of numbers |
sum([1, 2, 3, 4]) |
10 |
Basic Python Operators
Python can perform mathematical operations which can be helpful to transform data or analyse it. Here is a list of basic operators that are used commonly:
|
Operator |
Description |
Example |
|
+ |
Addition |
a + b |
|
– |
Subtraction |
a – b |
|
* |
Multiplication |
a * b |
|
/ |
Division |
a / b |
|
% |
Modulus |
a % b |
|
** |
Exponentiation |
a ** b |
|
// |
Floor Division |
a // b |
|
== |
Equal to |
a == b |
|
!= |
Not Equal to |
a != b |
|
> |
Greater Than |
a > b |
|
< |
Smaller Than |
a < b |
|
>= |
Greater Than or Equal |
a >= b |
|
<= |
Smaller Than or Equal |
a <= b |
Let’s practice an example for changing the data type:
- Assign two new variables:
a = 4, b = 6.0. - Print the types of the two variables. Notice that a is an integer. Let’s change it to a float.
- To make the change to the variable, you will need to re-assign but this type you add the
float()function before it to make the change. - No print variable a before making the change to float and after the change to see the change take palace.
Copy the following code to try this:
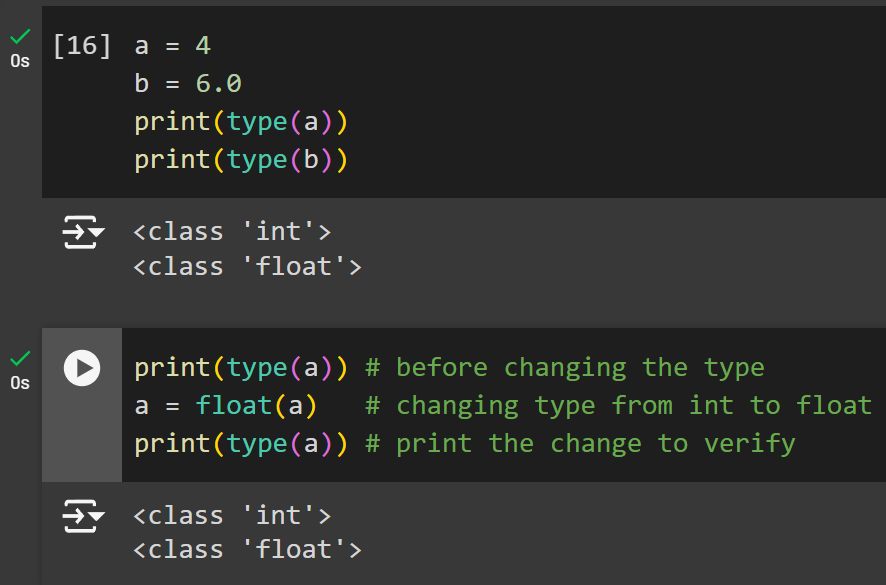
a = 4
b = 6.0
print(type(a))
print(type(b))

print(type(a)) # before changing the type
a = float(a)   # changing type from int to float
print(type(a)) # print the change to verify
You can now use the variables to perform operations using the values stored within them. Write the operations in between a print() function so it’s easier to see. Let’s practice an example with performing mathematical operators in Python:
- Add a and b by using the function
(a + b) - Multiply a with b by using the function
(a * b) - Divide a over b by using the function
(a / b) - Perform multiple operations,
((a*a)+(b*b)) - Perform multiple operations,
((a*a)+(b*b)) - Check if a is greater than b,
(a>b)
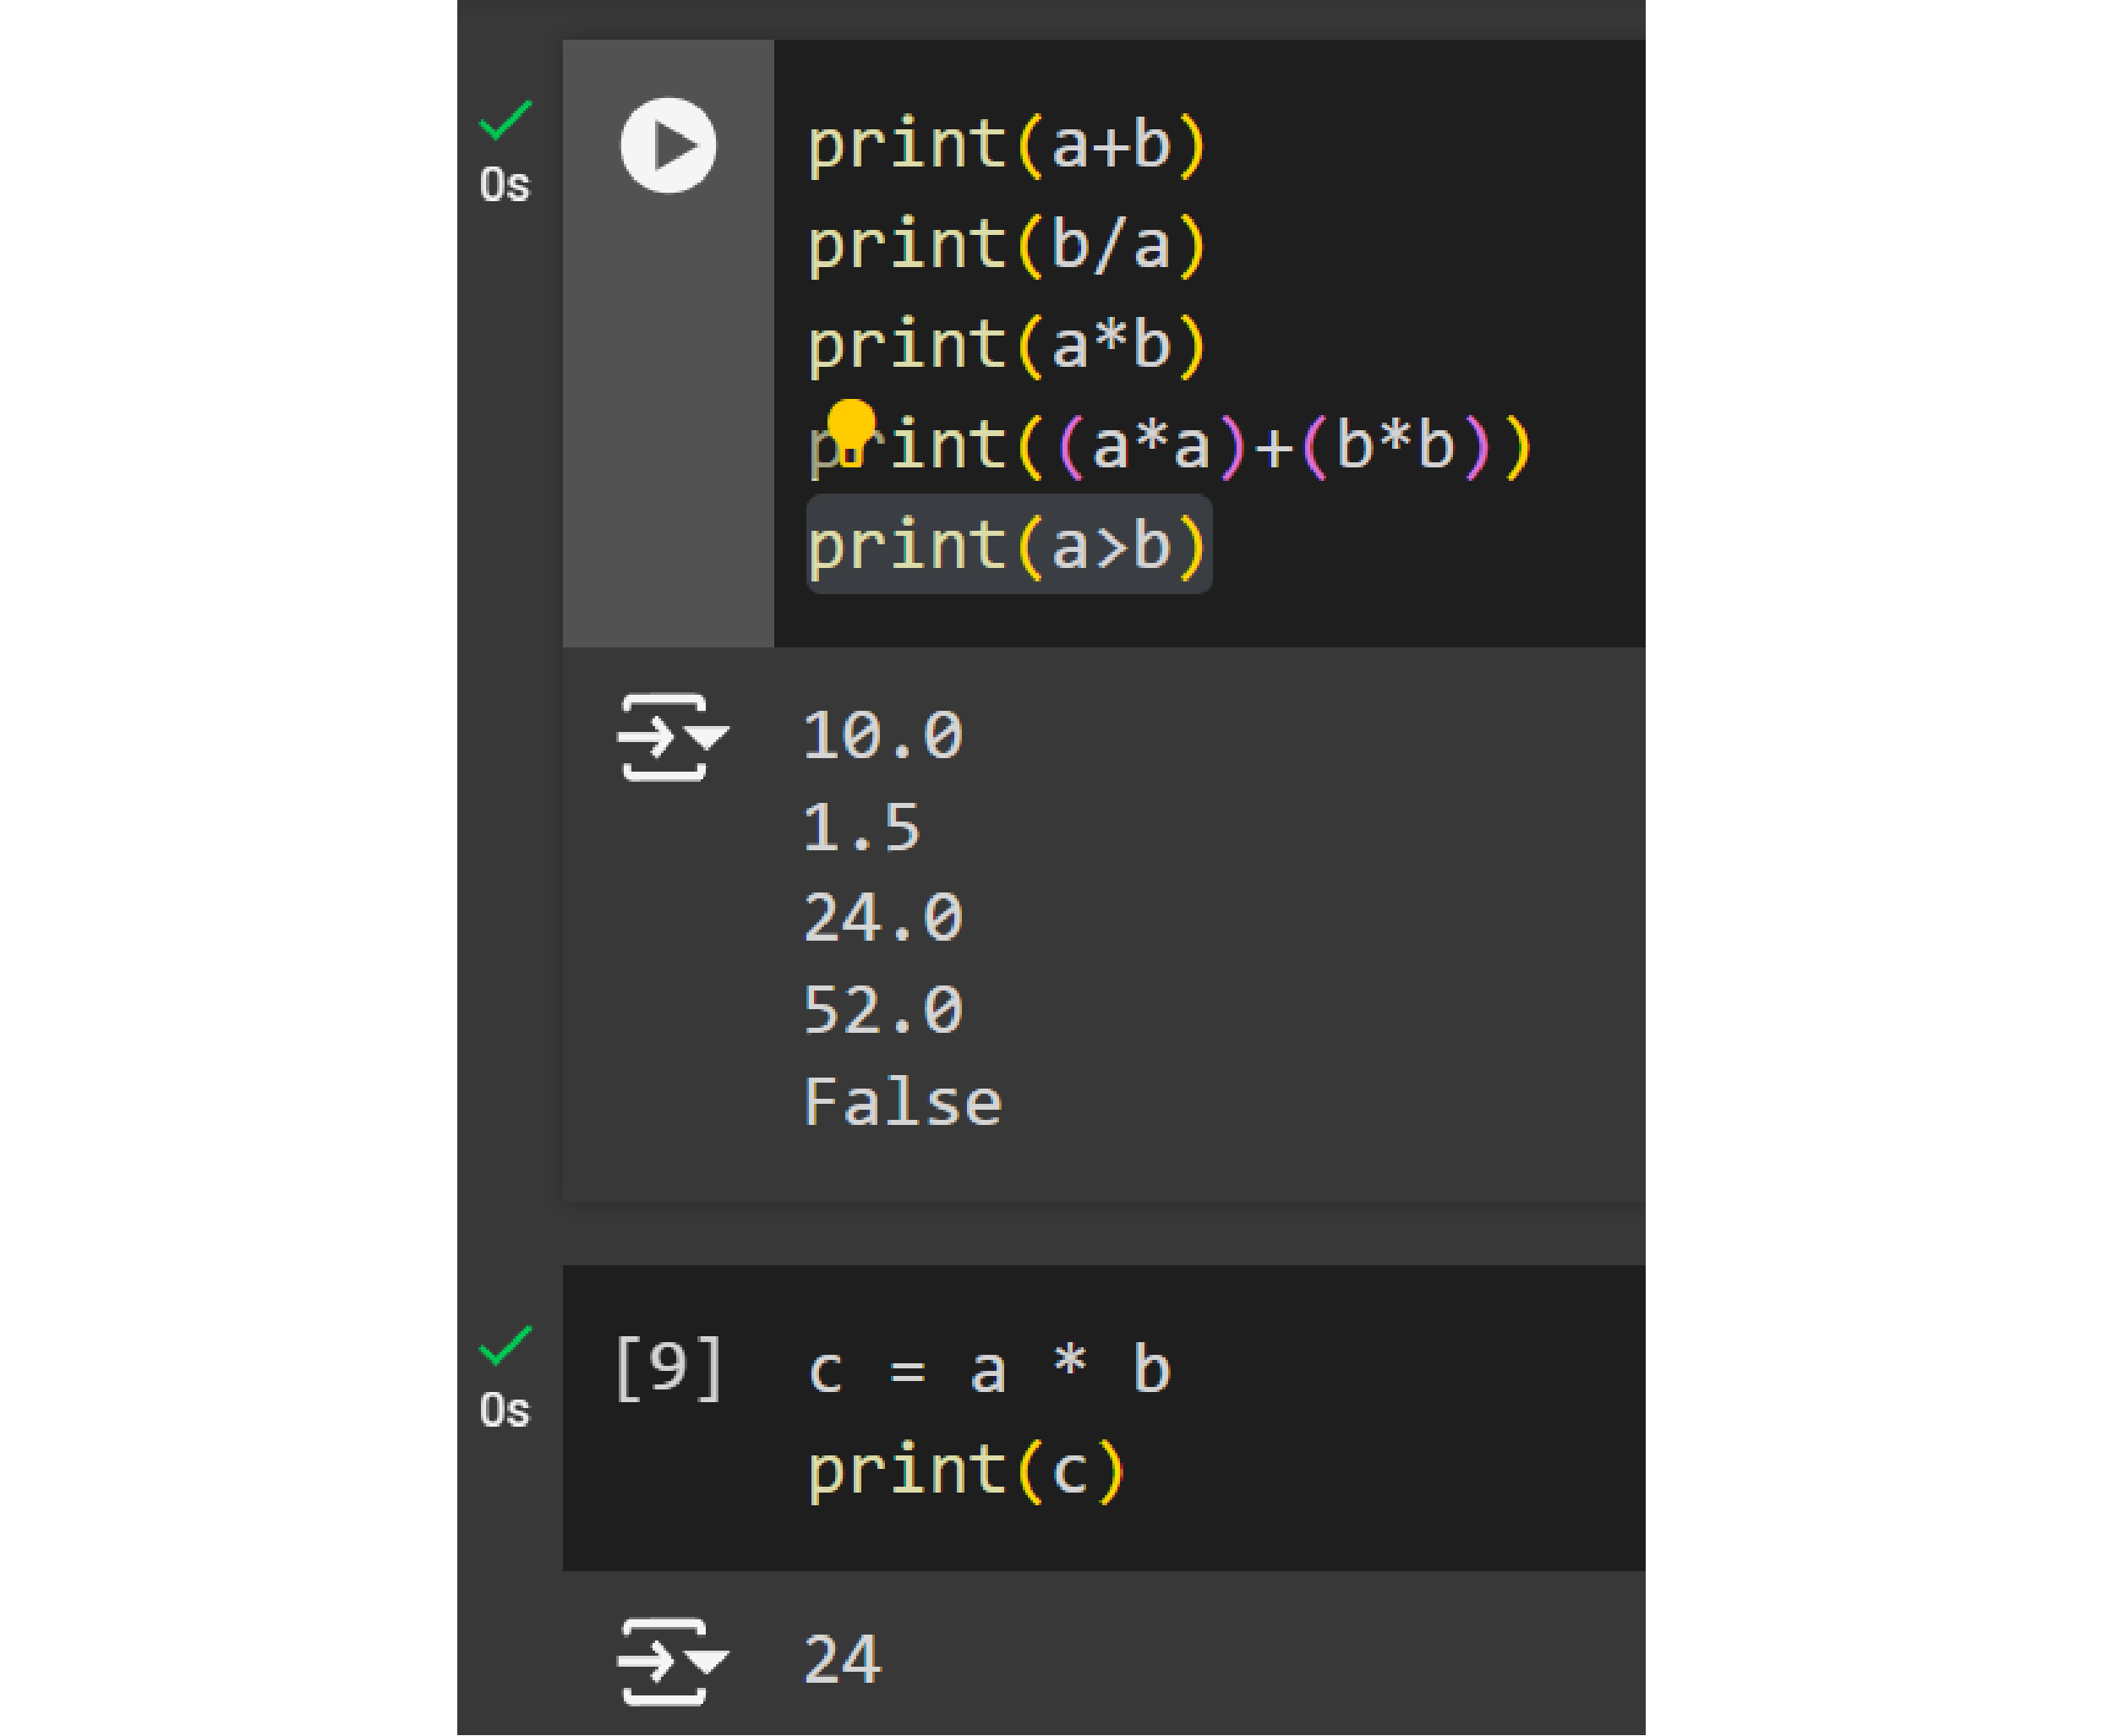
Copy the following code and try it:
print(a + b)
print(b / a)
print(a * b)
print((a * a)+(b * b)
print(a>b)
You now have performed multiple operations and saw the output results using the print function. If you want to store this value, you will need to assign it to a new variable. For example, c = a * b will give you a new variable based on a mathematical operations from the variables a and b.
Let’s practice creating a new variable using the mathematical operators. In this example, we will define our own statistical mean (average) variable which is described as: mean = sum of values / number of values.
- To find the sum of a list of values, you can use the
sum()function. - To find the length of the list, use the
len()function
print(len(data))
print(sum(data))
Create your own variable to calculate the mean of the data we have. To do this, we need to do the basic arithmetic function in Python for division and sum. To calculate the mean, assign a new variable called mean. Where sum() adds up all the values in the list, and len() counts the number of items in a list, then the sum is divided by the number of items using the python / operator.
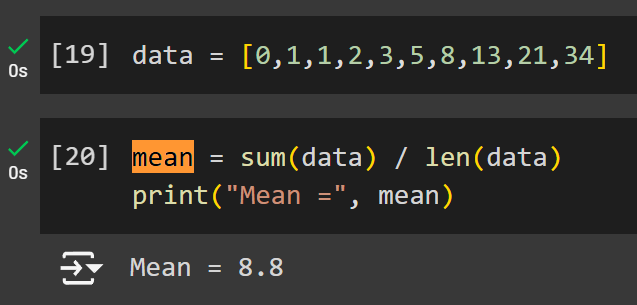
Combined it results in these lines of code, run it to see the outcome.
data = [0,1,1,2,3,5,8,13,21,34]
mean = sum(data) / len(data)
print("Mean =", mean)
We now have calculated the mean value of the data. Python are also known for having powerful code libraries that can perform the same thing with a single function. For example, NumPy has the average as well as other useful statistical operations that can be performed in a single line. This also means we don’t have to always hard-code the equations whenever we want to perform a common operation such as finding the average of a list.
Getting Started with Python in Google Colab 3/7
Conditional Statements & Loopslink copied
In this chapter the use of conditional statements and loops are explained. These are basic Python functions that are widely used.
Conditional Statements
You can perform conditional statements to check whether a data is True of False for conditions that you define.
- The
ifstatement check evaluates the condition: if it’s True, the code block runs. If it’s False, the program skips the code. - The
elifstatement check, which stands for “else if”, allows you to check multiple conditions sequentially. Meaning, if the condition is False, the code will check theelifcondition. You can have multipleelifconditions. - The
elsestatement is the final fallback option. If none of the conditions are met as True, then theelsecode is executed.
|
Function |
Purpose |
Condition Evaluated |
Action if True |
|
if |
Starts a conditional check |
Checks the initial condition |
Executes code block if condition is true |
|
elif |
Adds an alternative condition |
Checks an additional condition |
Executes code block if condition is true |
|
else |
Final fallback condition |
No specific condition evaluated |
Executes code block if no prior conditions are true |
For example, a simple conditional statement where you want to classify the scale of the building based on a range of area values. You can create a first if statement to check if a value is larger of equal than a set value. Next you can add an additional elif condition to check if larger of equal than a second value. Remember that this statement will only run if the first statement was False. Lastly, we can add an else a fallback condition for buildings that do not fall in the first two categories.
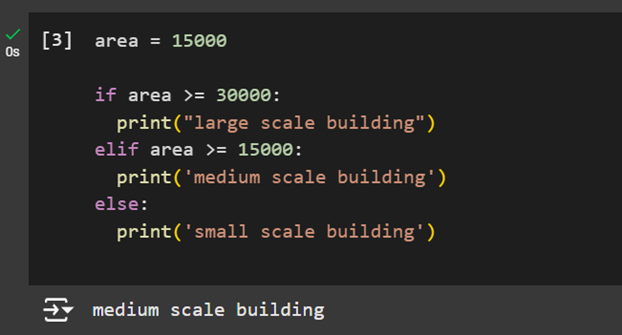
area = 15000

if area >= 30000:
  print("large scale building")
elif area >= 15000:
  print('medium scale building')
else:
print('small scale building')Note: the notebook will automatically indent the code within a conditional statement like this. Make sure to have them consistent in your code.
We can also use a conditional statement when assigning a new variable, for example a statistical median of a data. A median is a way to find a middle value in a set of values where half the numbers are lower, and the other half are higher. If the set has odd values, then the middle value is the median. If the set of values are even, then we take the average of both middle values by summing them up and dividing them by 2.
Let’s create a new variable to calculate the median of the list: floor_areas
- The first step is to arrange the data using the function
sorted(). - Once the values are sorted, print to verify the change was made.
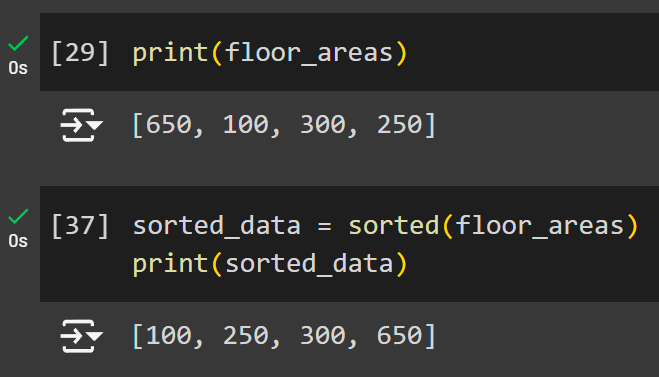
Here is the code below:
floor_areas = [650,100,300,250]
print(floor_areas)

sorted_data = sorted(floor_areas)
print(sorted_data)
A critical thing to check for is whether the list contains even or odd number of values. We can check that using a conditional statement using if / else where if the list length is odd, we simply print out the middle value, otherwise if the list length is even, then we take its average.
Create a new variable, n, which will tell us the length of the list.
n = len(sorted_data)Write an if conditional statement to check whether it’s an even or odd number, we will use the % modulus operator which performs a division and finds the remainder. We will find the modulus of 2 which divides a number by 2: if the remainder is 0, it means it’s an even number, otherwise a remainder of 1 is an odd value. For example if the length of the data is equal to 7, so n = 7, then the modulus will be 1. In this case the statement is true, therefore the statement to be printed will be set on ‘Odd’.
if n % 2 == 1:
median = sorted_data [n // 2] * takes the middle index value of a listNote: floor division outputs integer types required for index values whereas a normal division operator outputs floats.
Now write the else statement: if the length of the list is not odd, then we write an else conditional statement where we take the two middle index values of the list by subtracting 1 from the floor division and adding it to the other index value that is output by the floor division. Then we divide both values by 2 to find the average of these two values.
else:
    median = (sorted_data [n // 2] + sorted_data [n // 2 - 1]) / 2
print("Median =", median)
All put together, the median code looks like this:
floor_areas = [650,100,300,250]
sorted_data = sorted(floor_areas)

n = len(sorted_data)

if n % 2 == 1:
    median = sorted_data[n // 2]
else:
    median = (sorted_data [n // 2] + sorted_data [n // 2 - 1]) / 2
print("Median =", median)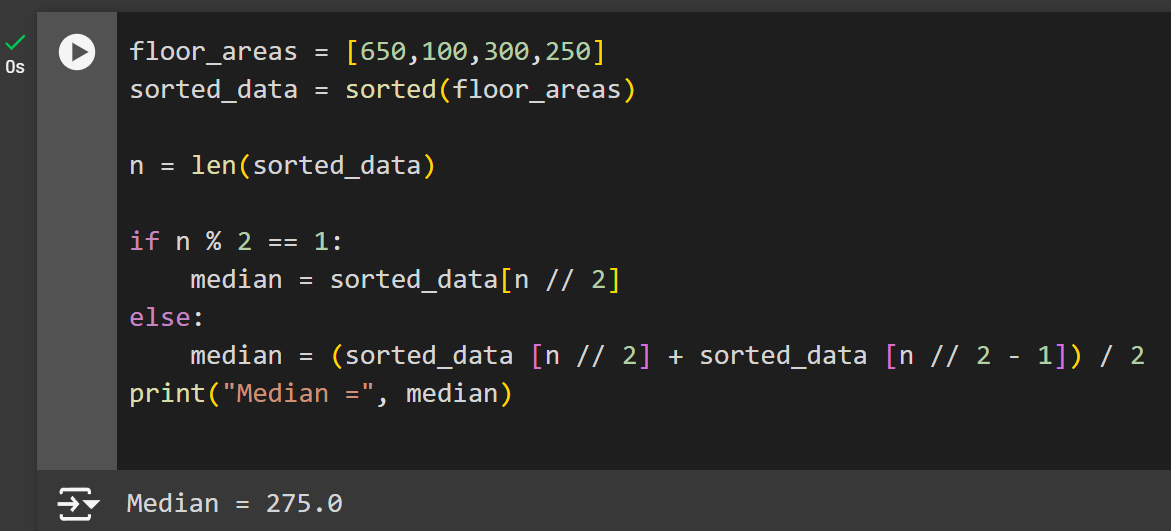
Loops
Loops are powerful operations in Python that can take a list variable and iterate through each value until a certain condition is met.
Below is a loop that iterates through the data list of values and checks the remainder if it is 1 or zero, then using the append() function it updates the varaiable even_numbers and odd_numbers.
- We have our data assigned the same as previously which is a list of integers.
data = [0, 1, 1, 2, 3, 5, 8, 13, 21, 34] # a list of integers- The loop will iterate through each value in the list and checks the remainder if it’s 0. In order to store the numbers in an empty list, we create new variables with empty lists that will be used to store information into.
even_numbers = [] # assign variable for even numbers
odd_numbers = [] # assign variable for odd numbers- Once the variables are defined, we can iterate through the list using a for loop. If the conditional statement is true, it will take that integer value and append it to our
even_numberslist. Otherwise it gets assigned into theodd_numberslist. - To set the loop condition, the for condition asks for a variable, in this instance it is i which is a common variable name for loop variables, and a list of values to iterate through which is data.
for i in data:- Then setting the conditions if the integer’s remainder is 0, append even_numbers this value, otherwise it goes to odd_numbers.
    if int % 2 == 0:
        even_numbers.append(int) # even numbers are added to the list variable
    else:
odd_numbers.append(int) # odd numbers are added to the list variable- Then using the print function, you can add to arguments to the print function: the first is a string of text, and the second is the variable result.
- We can check how many value are in each list by using the ‘len’ function.
print("The number of even numbers are:",(len(even_numbers)))
print("The number of odd numbers are:",(len(odd_numbers)))
print("List of even integers:", even_numbers)
print("List of odd integers:", odd_numbers)
Here is the entire code written together:
data = [0, 1, 1, 2, 3, 5, 8, 13, 21, 34]  # a list of integers

# create empty list to store values in
even_numbers = [] # assignign variable for even numbers
odd_numbers = [] # assignign variable for odd numbers

# iterate over each value in the list
for i in data:
    # Check if i value is an even number
    if i % 2 == 0:
        even_numbers.append(i) # even numbers are added to the list variable

    # Otherwise the value is an odd number
    else:
        odd_numbers.append(i) # odd numbers are added to the list variable

# Display the outcome of checking the data in the list
print("The number of even numbers are:",(len(even_numbers)))
print("The number of odd numbers are:",(len(odd_numbers)))
print("List of even integers:", even_numbers)
print("List of odd integers:", odd_numbers)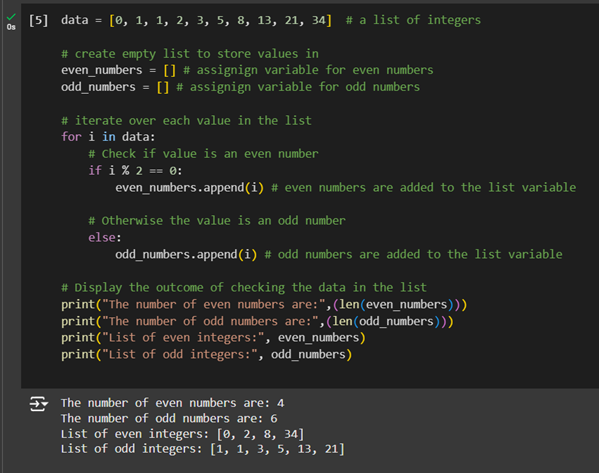
In the next section, we will import learn how to import libraries which can help us perform complex functions in just a few lines of code.
Getting Started with Python in Google Colab 4/7
Importing datasetslink copied
In this section, you will upload the dataset to your drive storage, mount your drive storage into the notebook, import the dataset, and perform basic operations to inspect and describe the data.
Connect your Notebook to the Drive
First upload the dataset provided in the example file into your drive. Once uploaded, you need to find the file path by mounting the drive into the notebook.
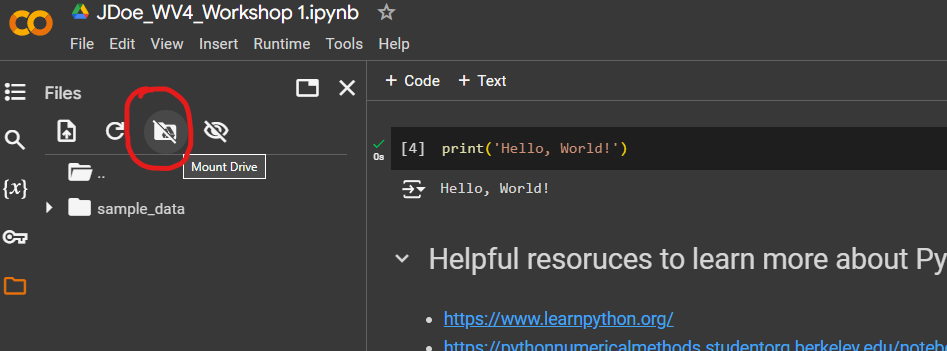
- On the left side there is a menu with the folder icon, click it, and click on ‘Mount Drive’.
- You may be asked to provide permissions for Google to access your drive.

- Once mounted, navigate to your drive folder and locate the dataset within your drive.
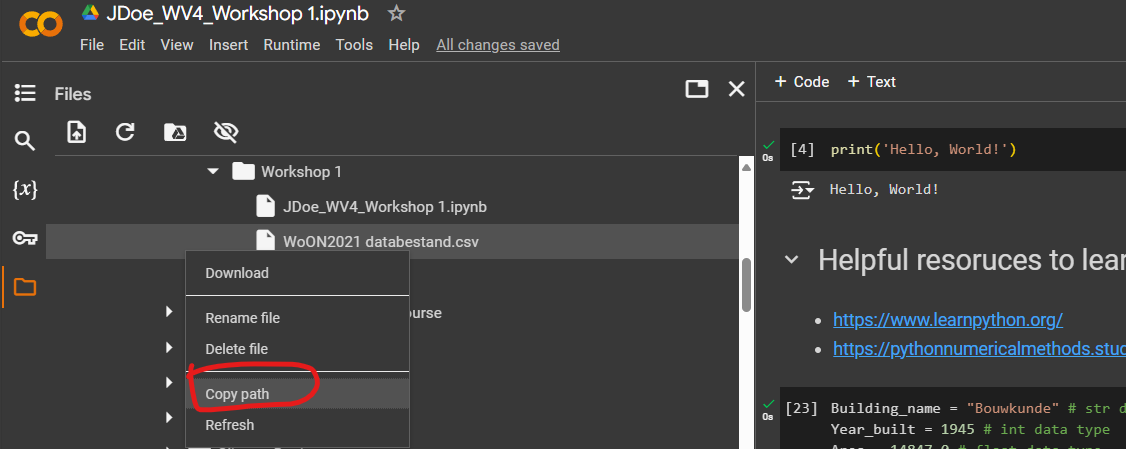
- Once you’ve located the dataset, right-click on the file and select ‘Copy path’ and save it on the side. You will need this in the following step.
Importing Libraries
In order to import our dataset, we need to use code functions from third-party Python libraries. A library is a collection of modules (code snippets) that can help us make certain operations without having to manual code them. To import the dataset, we actually need the drive module from the google.colab library.
You can import a library by writing import google.colab and that’s it. But if you like to import only one module from the library, which in our case we are interested in the drive to mount your drive storage map into the notebook.
from google.colab import drive
drive.mount('/content/drive')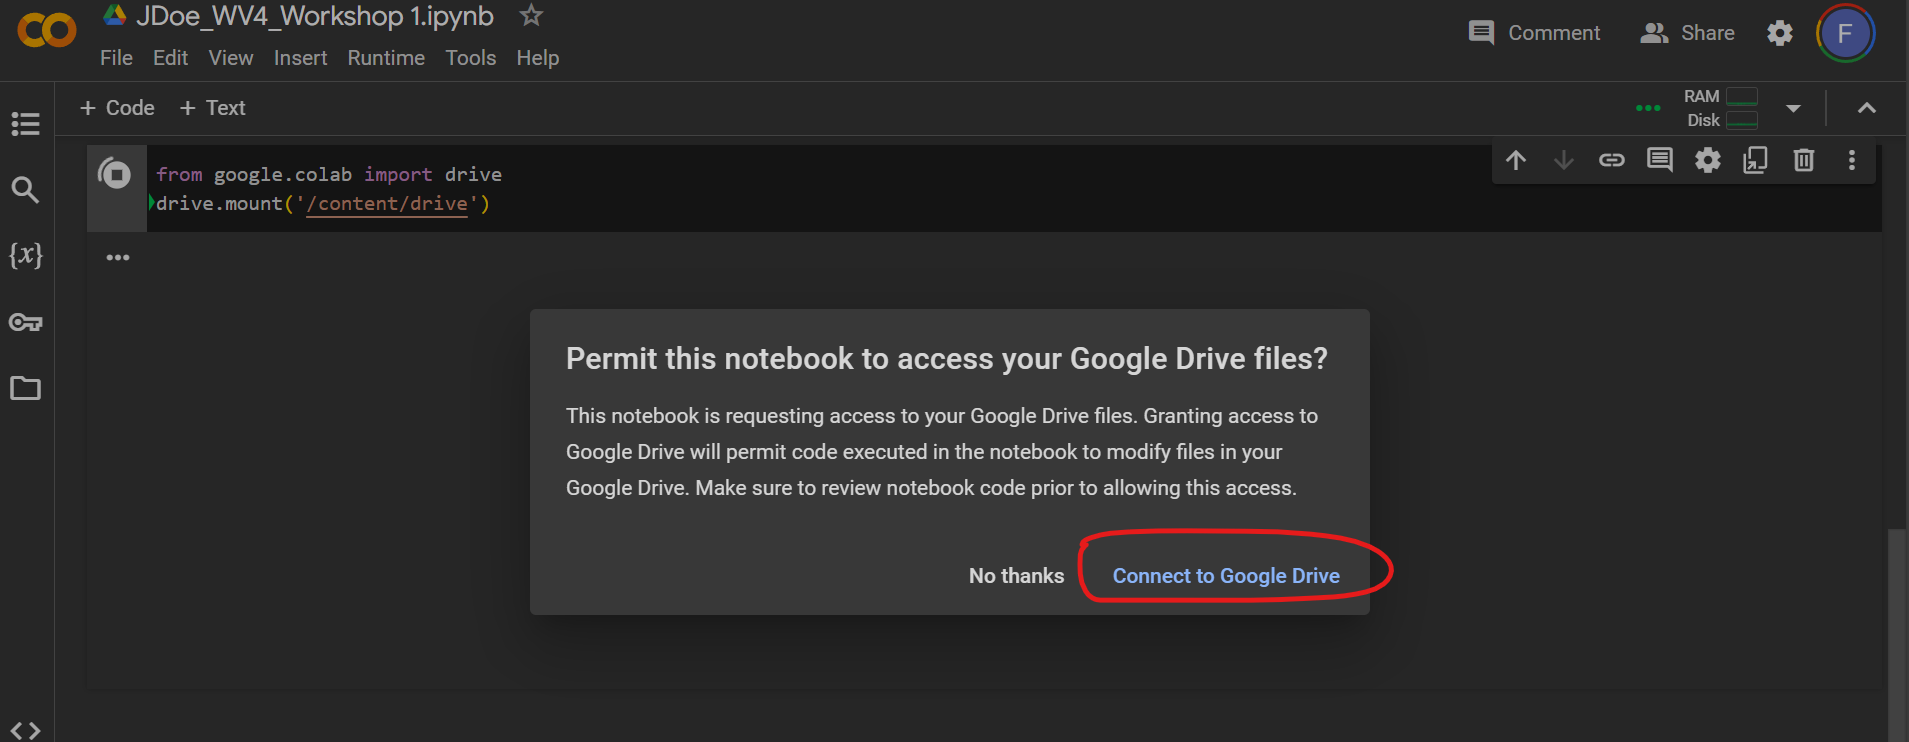
Note: if it asks to mount, read the permissions and allow your notebook to access your drive storage.
Next, we will be importing the .csv file of the dataset using Pandas library read_csv operation.
Getting Started with Python in Google Colab 5/7
DataFrames using Pandaslink copied
Pandas Library
Pandas is a powerful library for accessing, viewing, and manipulating tabular data, such as the WoON2021 provided to you in this tutorial.
Pandas is a library dedicated for data analysis which is compatible with common file format of tabular datasets, such as .csv and or even excel. Pandas can do many things including importing, viewing, merging, and many other tools to manipulate datasets. Contained within this Python library are many useful functions to help you quickly make edits to an entire dataset that would otherwise be difficult to edit on tabular programs like Excel or hard-code it using plain Python operations.
Pandas provides extensive documentation to help you use it more effectively, you can find it in the Pandas User Guide.
Loading the library
In order to use a library, you will first have to install it. But since our code environment is within Google Colab, the most commonly-used libraries are already installed. To use the library, you need to load them using the import function. In the earlier section, we loaded the drive module which comes from the google.colab library.
Note: if you do not import the library in your notebook, you cannot utilize their function.
You can import it into your notebook to access its functions using the following naming convention, pd. The reason why we specify pandas to be called as pd is to make it easier to call functions from pandas. The abbreviation pd is widely used and is a standard abbreviation for this library.

import pandas as pdOnce loaded, the pandas library will not display an output, but a checkmark will show in the notebook to indicate it successfully ran the code.
Loading a dataset as a data frame
To import your dataset, specify the file_path inside of a string. Then, we will store the dataset in a variable, df, which is another common abbreviation for the data type of pandas it uses, DataFrame.
The reason we use DataFrame file type because this is the file type that works best with Pandas. Think of it as a ‘table’ format that Pandas can utilize for executing commands you typically do on a tabular data program like Excel such as filtering and transforming the data. DataFrame data type is more flexible in that way to allow us perform functions on them as if it was a tabular data.
file_path = '/content/drive/MyDrive/Data/WoON2021 databestand.csv'  # Update this path with your file path
df = pd.read_csv(file_path) # df is the conventional naming for datasets imported with Pandas as DataFrames
df # writing the name of the DataFrame will display it as a table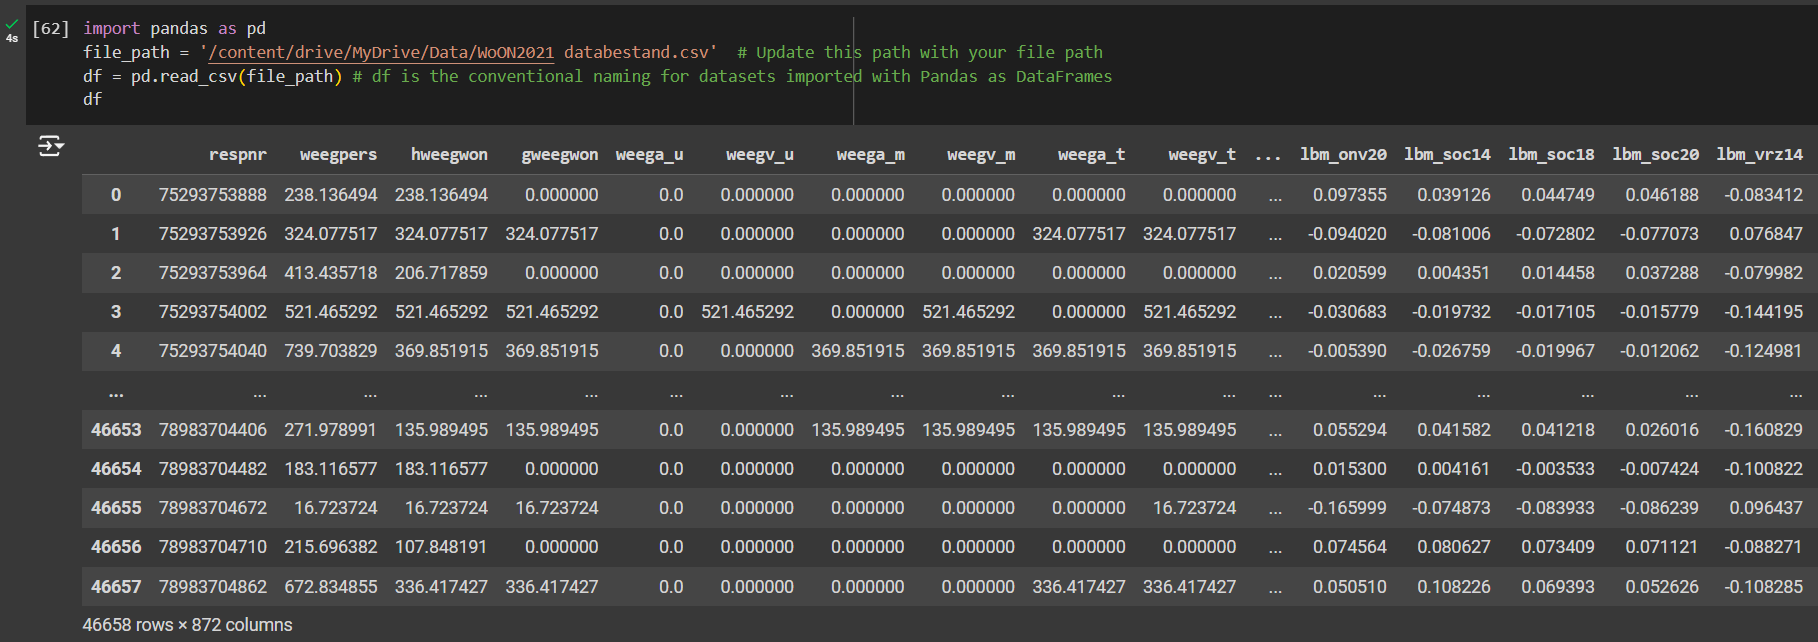
Basic Pandas Commands
Now you have loaded your dataset, but how can you view it?
Using some of Pandas functions, let’s inspect the data in the file to get an idea of what it contains.
Try the functions below in separate code fields:
- Entering
dfin a separate line will give you an overview of the data inside your notebook. - Enter
df.shapeto get the size of the dataset which will tell you how many rows and columns it has.- The output will be two items in between parentheses: the item on the left is the number of rows, and the item on the right is the number of columns.
- Enter
df.columnsto get a complete list of the columns in the- if you want to inspect the entire columns as a list, use this command:
df.columns.tolist()but be aware that if the column lists is long you will have to scroll a lot.
- if you want to inspect the entire columns as a list, use this command:
- Entering
df.iloc[0:10]will select a range of rows within the DataFrame. In this example, the first 10 rows. - Entering
df.iterrow()allows iteration through each row in a DataFrame, providing both the row’s index and the row data. This is useful for applying conditional logic to each row and describing or analyzing the data row by row.
|
Function |
Description |
Example |
|
.shape |
Displays the number of rows and columns |
df.shape |
|
.columns |
Displays the column values in a list |
df.columns |
|
.iloc[] |
Selects a range of rows in a DataFrame |
df.iloc[1:10] |
|
.iterrow() |
Iterates through each row in a DataFrame and provides both row’s index and row data |
df.iterrow() |
|
.info() |
Displays overall information of the DataFrame. |
df.info() |
|
.astype() |
Converts data type in one or more columns |
df[‘column_name].astype(str) |
|
.dtypes |
Displays the data type for one or more columns |
df.dtypes |
|
.dropna() |
Removes all rows with null or NaN values |
df.dropna() |
|
.valuecounts() |
Counts the number of instances of a specific value |
df.valuecounts() |
|
.sort_index() |
Sorts a DataFrame, in ascending order by default |
df.sort_index() |
DataFrame selection
Using the imported dataset, let’s try to determine the accessibility of buildings by selecting two columns from the dataset to see how many multi-level buildings have a lift. To find this information we only need to use 2 columns of the dataset, it is advisable to work with sections of a dataset to create a faster and smoother process, especially when you start working with large datasets.
To isolate two columns in the dataset, you will need to do the following:
- Create a new variable for the selection, call it
df_selection. - Select the two columns you are interested in inspecting by listing the column names
df_selection = df[['column_name_1', 'column name_2']]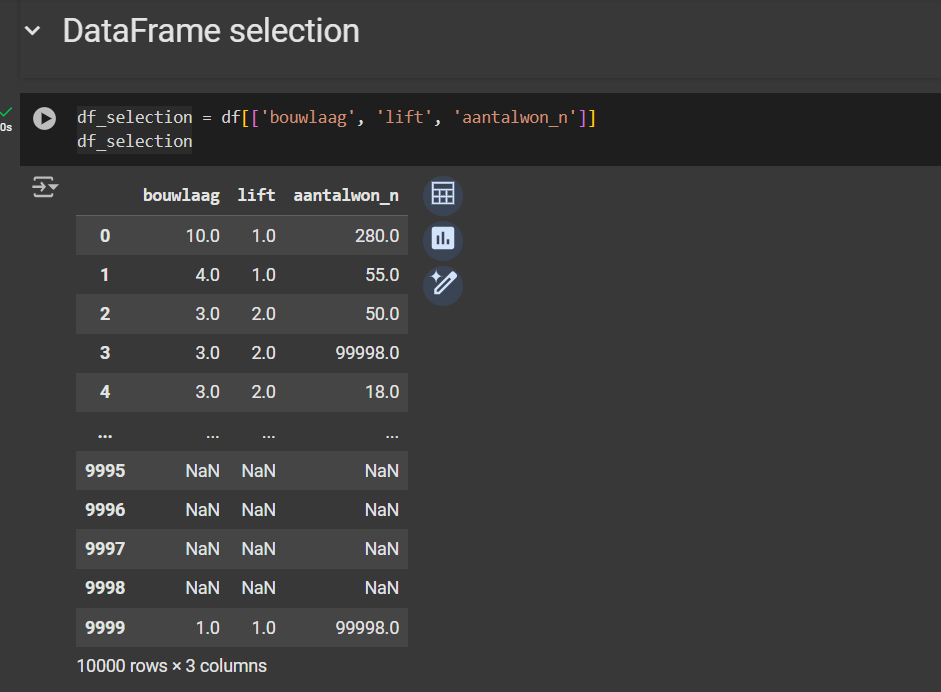
Try it by running this code:
df_selection = df[['bouwlaag', 'lift', ‘aantalwon_n’]]In this instance, we will loop through the floor level (bouwlaag), the presence of an elevator (lift), and the number of apartments in the building (aantalwo_n) to determine how many buildings have an accessible lift.
You will see in the output of the data, lift is either a NaN object (no value assigned, a.k.a. “Not a Number”) or a float. We want to know how many multi-level buildings has a lift.
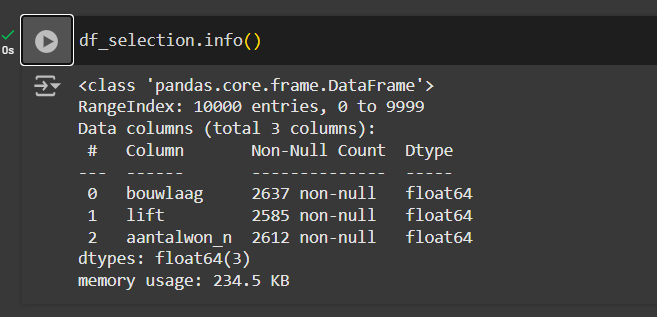
You can view the information of your new DataFrame selection by performing the .info command which will tell you the count of null items in your list and the data type of each column:
df_selection.info()OR
print(df_selection.info())Converting Data Types
You can also convert the columns to something like, i.e. from float to integer by performing the following command. But before doing that, we have to remove any null values from the selected columns to remove missing values in the dataset. Additionally, if you look at the column of the number of apartments in the building (aantalwo_n) you see a strange value of 99998 as a possible value, we will remove those values as well.
# remove whenever any NaN values
df_selection = df_selection.dropna(subset=['bouwlaag', 'lift', 'aantalwon_n'])

# remove weird results in number of apartments per building
df_selection = df_selection[df_selection['aantalwon_n'] < 99998]
Now you can convert the data type to integers using the following code:
# convert data type
df_selection = df_selection.astype(int)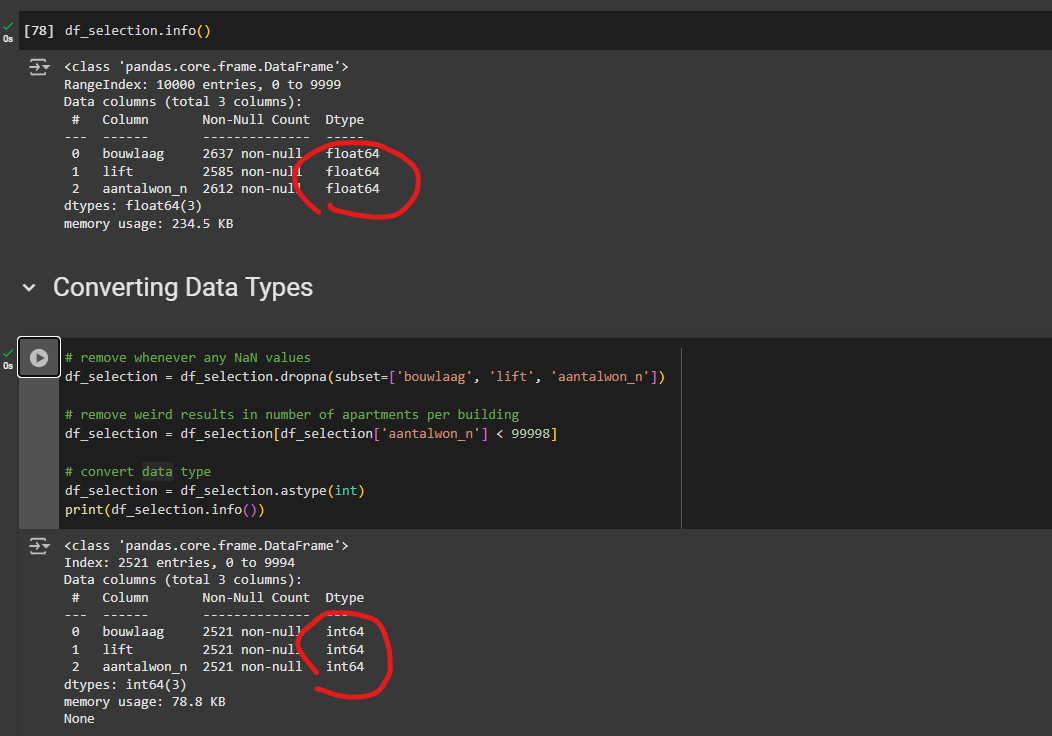
Now if you run the .info() command again, you will that the new data type are whole integers instead of decimal float values.
Notice the data type changed from float to integer and the null values in ‘lift’ now matches the ‘bouwlaag’ column.

Now to finally verify you have the correct data selection, you can print the .shape of the DataFrame and you will see that it should inspect the number of rows and columns in them which should match what you expect.
df_selection.shapeLoops for DataFrames
Once you have made your clean DataFrame selection, let’s iterate through the DataFrame and find out how many multi-level buildings have a lift.
- First, we want to create these 3 variables to quantify from our dataset by creating empty lists for the variables:
multi_level_bldgs = [] # number of buildings that has more than 1 level
bldgs_with_lift =[] # number of buildings that has a lift
bldgs_without_lift = [] # number of buildings with no lift
Let’s create a loop to select buildings that have more than 1 story, then check if the lift value is either 0 (indicating no lift) or greater than 0 (indicating at least one lift). The code will loop over df_selection to check each row in the dataset to see if bouwlaag is greater than 1, then adds the row index to a list. The same procedure is repeated to check the lift column, where the condition now checks if the lift value is equal to 1, which indicates the presence of a lift. Finally, all multi-level buildings with a different lift value are categorized as buildings without a lift. The .iterrows() function allows us to iterate over the DataFrame by both row and column indices, making it easy to access each value directly.
for index, row in df_selection.iterrows():
    if row['bouwlaag'] > 1:
        multi_level_bldgs.append(index)

        if row['lift'] == 1:
            bldgs_with_lift.append(index)
        else:
bldgs_without_lift.append(index)- Now print the results using the following code:
print("The number of multi-level buildings is:", len(multi_level_bldgs))
print("The number of buildings with a lift is:", len(bldgs_with_lift))
print("The number of buildings without a lift is:", len(bldgs_without_lift))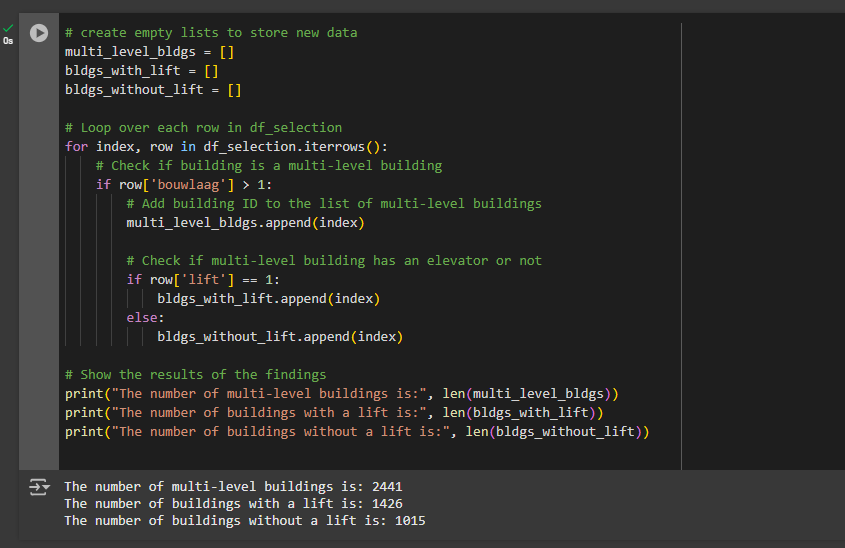
Here is the overview for the entire code:
# Create a new dataframe with only a fraction of the data
df_selection = df[['bouwlaag', 'lift']]
df_selection

# create empty lists to store new data
multi_level_bldgs = []
bldgs_with_lift = []
bldgs_without_lift = []

# Loop over each row in df_selection
for index, row in df_selection.iterrows():
    # Check if building is a multi-level building
    if row['bouwlaag'] > 1:
        # Add building ID to the list of multi-level buildings
        multi_level_bldgs.append(index)

        # Check if multi-level building has an elevator or not
        if row['lift'] == 1:
            bldgs_with_lift.append(index)
        else:
            bldgs_without_lift.append(index)

# Show the results of the findings
print("The number of multi-level buildings is:", len(multi_level_bldgs))
print("The number of buildings with a lift is:", len(bldgs_with_lift))
print("The number of buildings without a lift is:", len(bldgs_without_lift))Assignment: now look through the columns and identify ways to inspect the data. Create a loop to go through a column to describe the data in useful ways similar to what you did in the lift example.
If you want to learn more about the Pandas library we advise you to follow the 10 minute starting up with Pandas tutorial to understand the basics even better and look around in the user guide for other features of Pandas.
Getting Started with Python in Google Colab 6/7
Graphs with Matplotliblink copied
Matplotlib is a popular Python library for visualizing data. It can help you create data visualizations in the form of graphs and much more. It’s widely used for bar charts, line charts, and scatter plots. In this section, we will briefly go over the basics to help you visualize your data.
You can also follow the quick start tutorial by Matplotlib to get started and get a better understanding on how to create graphs with the Matplotlib library.
Importing Matplotlib
A common abbreviation to use for this library is plt using the code line below:
import matplotlib.pyplot as pltBar chart
Let’s use the df_selection form the previous section to plot how the distribution of building heights. Meaning, we want to see how many instances of a building height are the same.
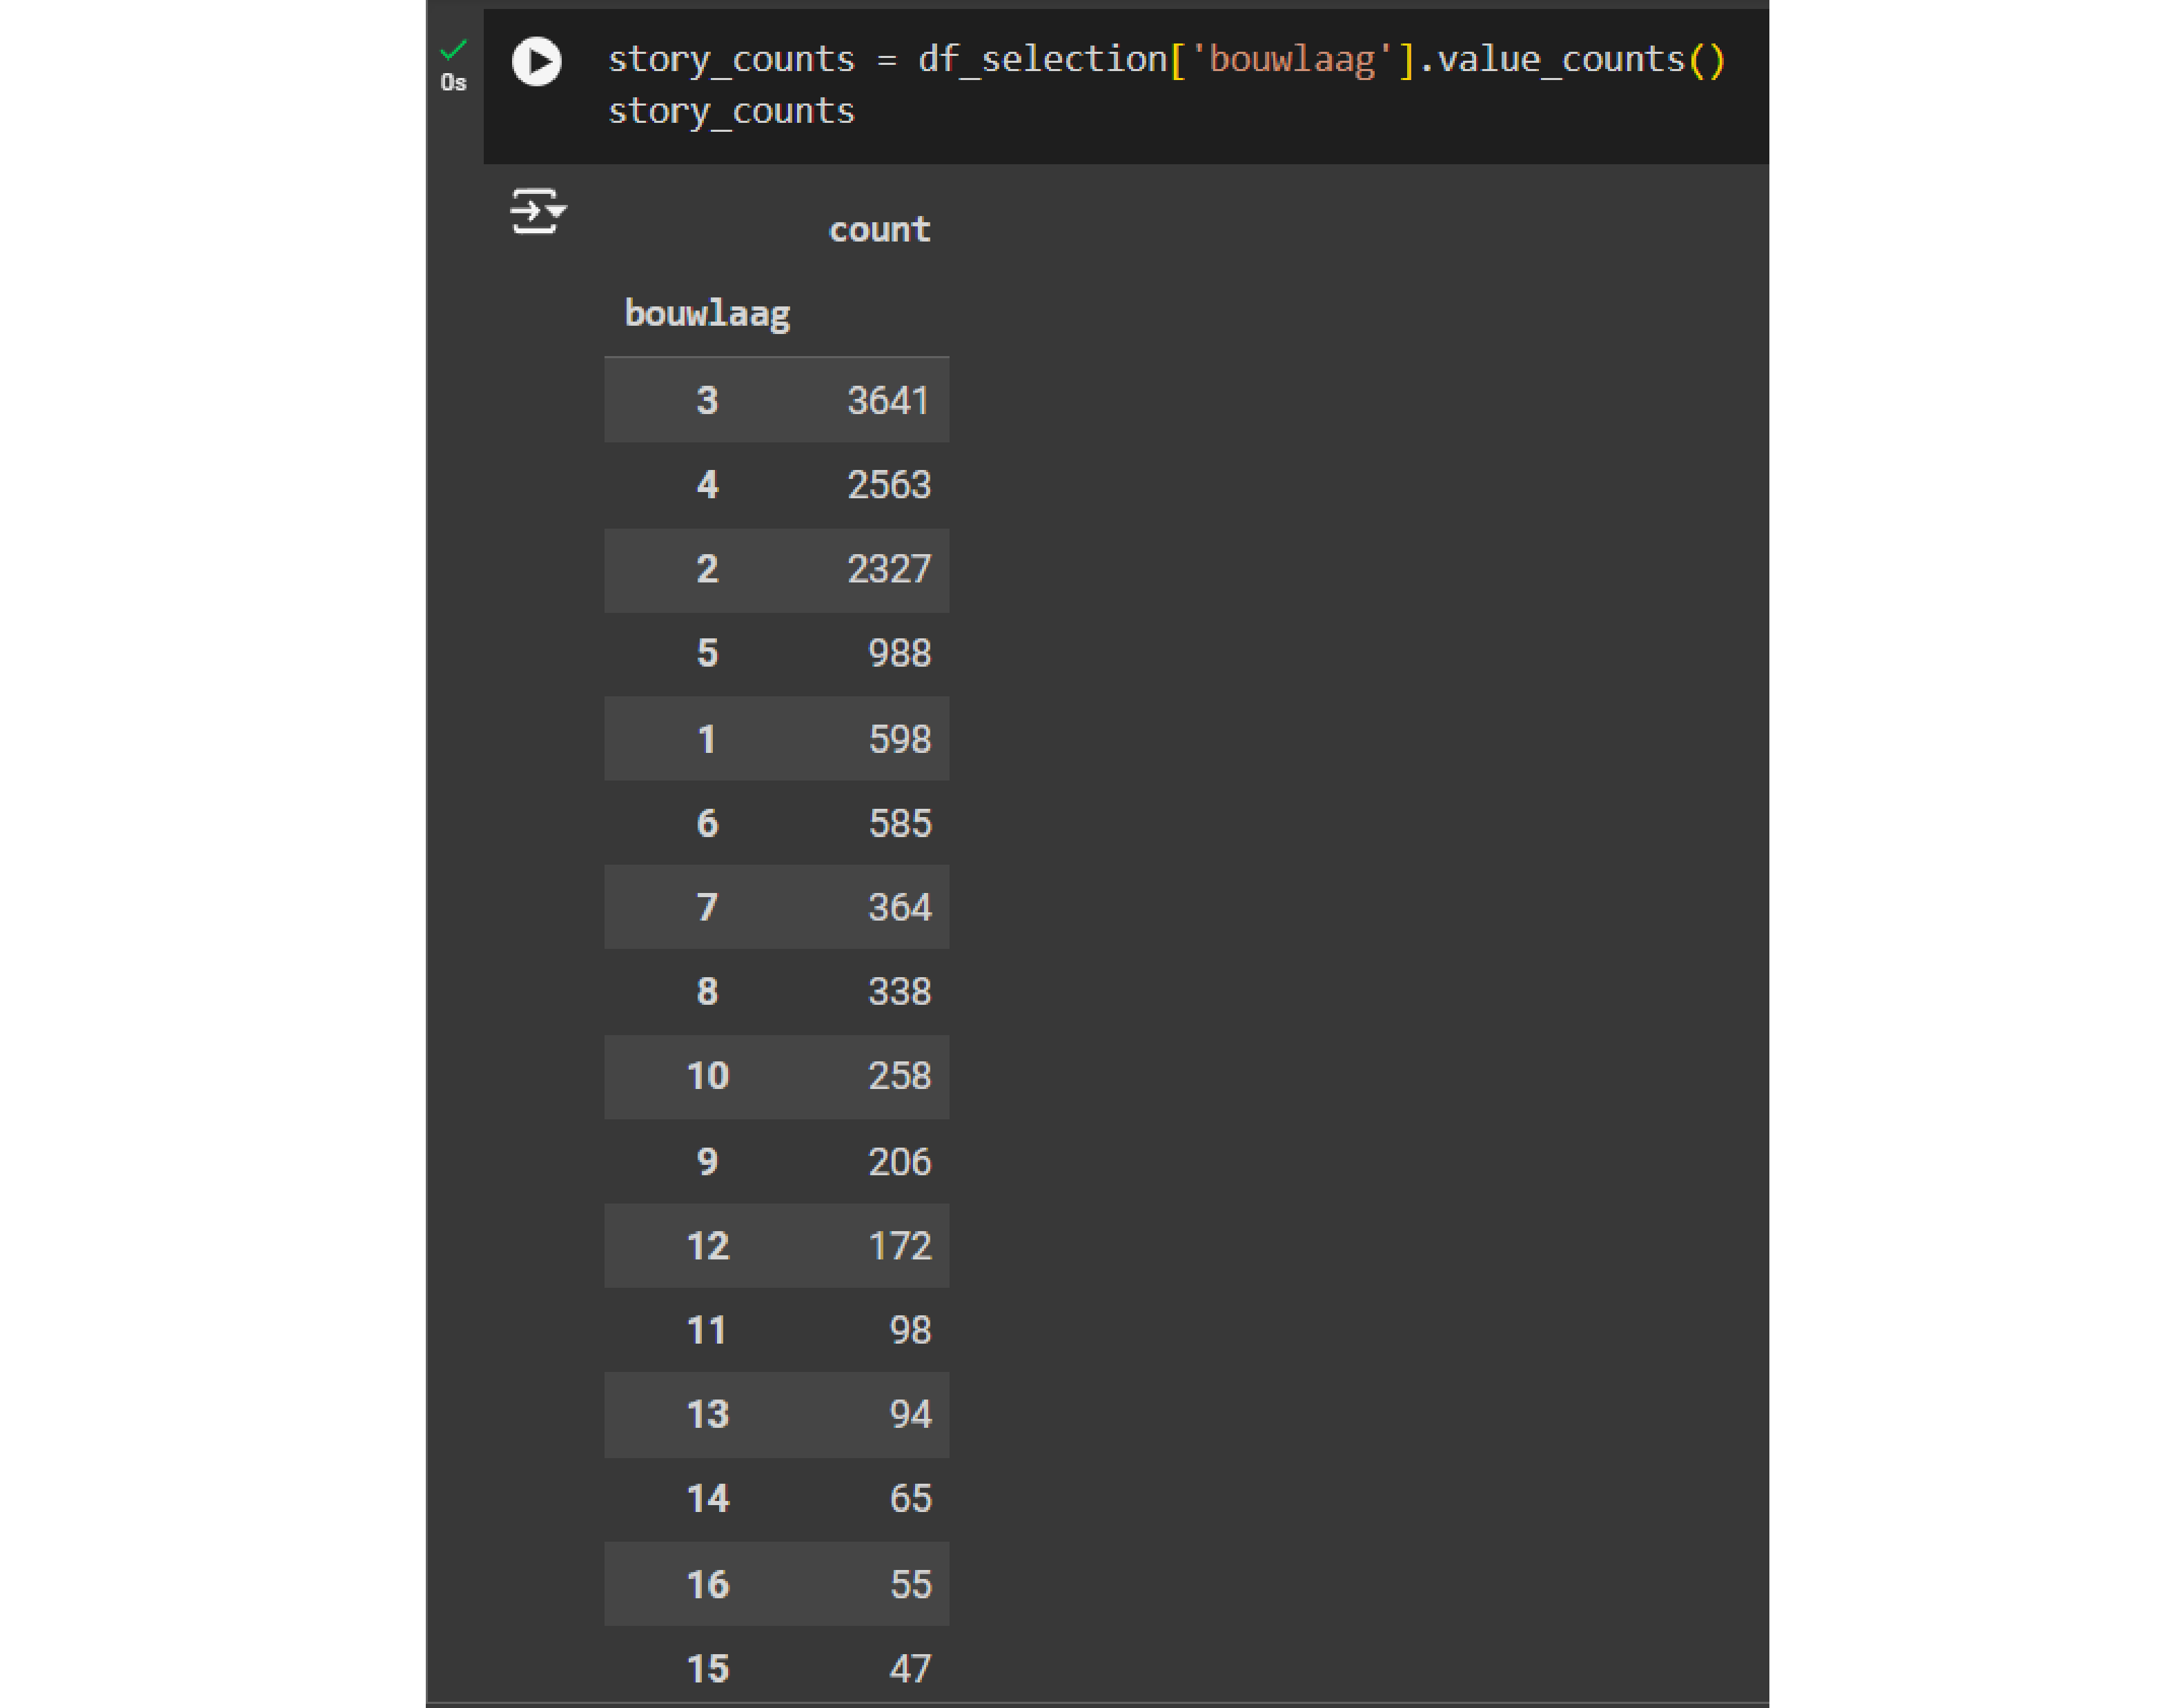
Let’s get the number of instances for each unique number of stories using the function value_counts() from Pandas
story_counts = df_selection['bouwlaag'].value_counts()
story_counts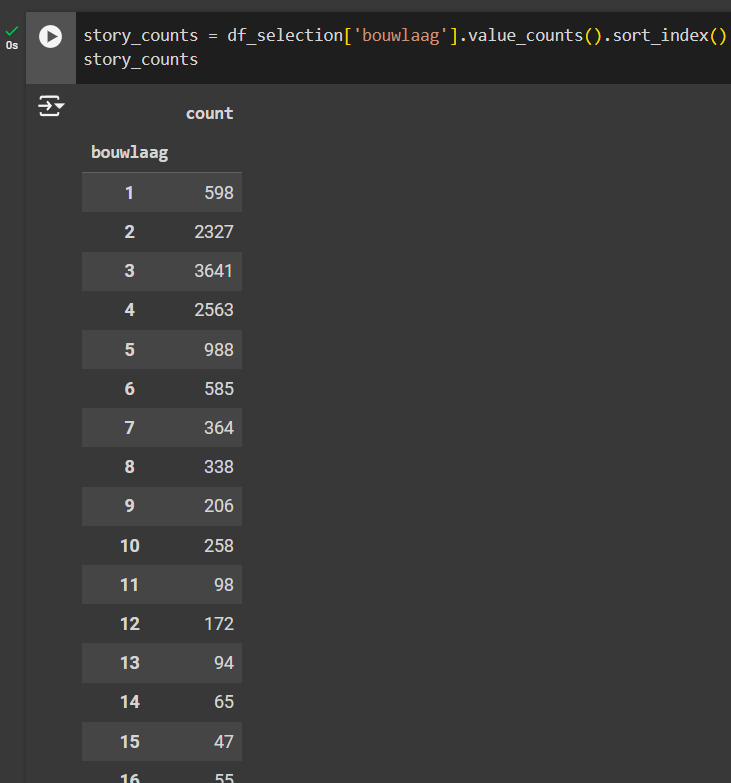
Notice that the values are not ordered, so we will use another Pandas function to order index values, sort_index(), of the list in ascending order so that it starts with the buildings with the lowest number of floors.
story_counts = df_selection['bouwlaag'].value_counts().sort_index()
story_counts
Now that you have these values, let’s make a basic bar chart to see the distribution of the data. You can use the plt.bar() function and in between the parentheses you inter two arguments: the first is the index value of the to display on the x axis, and in the second argument will be the values of the story_count list.
plt.bar(story_counts.index, story_counts.values)You can also add labels to your graphs as follows:
plt.title('Number of Instances per Building Story Level')
plt.xlabel('Number of Stories (Bouwlaag)')
plt.ylabel('Number of Instances')
plt.show()
You will end up having something that looks like this:
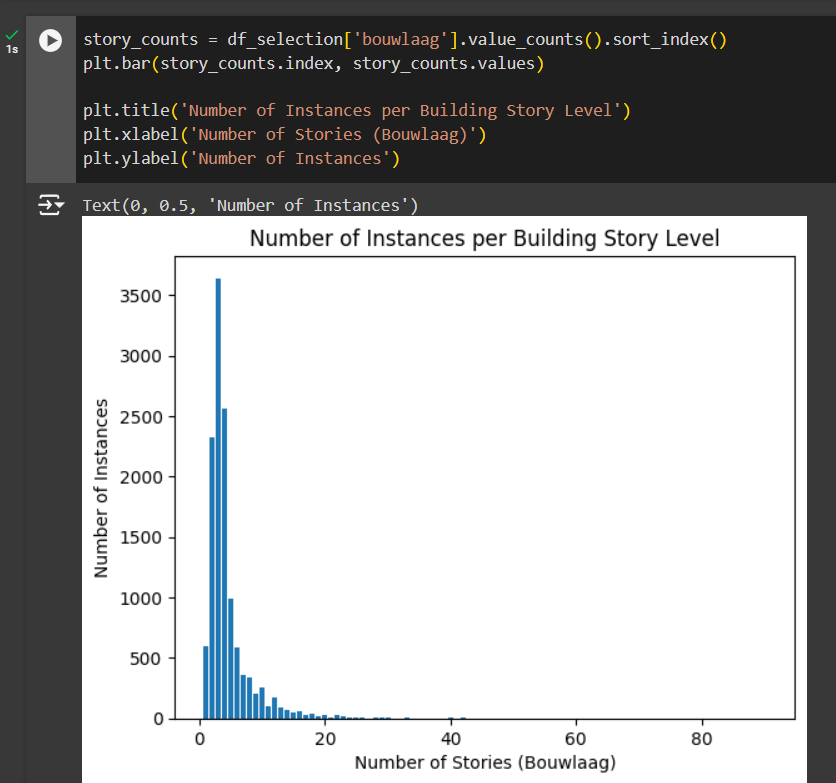
You can find more information on the documentation in the Matplotlib user guide on bar plots.
Additionally, it is also useful to look at this example code for a bar chart.
Scatter plot
You can also use a scatter plot to understand how features relate to one another. For example, you can compare the building height with the number of elevators in the building. A scatter plot will display two information axes. For example, on the y-axis (vertical) we can display the number of lifts and on the x-axis (horizontal) we can display the number of lifts.
Let’s first define the plot arguments: the first argument is for the values plotted along the x-axis (which is ‘lift’) and the second value is for the values plotted along the vertical y-axis (which is ‘bouwlaag’).
plt.scatter(df_selection[' aantalwon_n'], df_selection['bouwlaag'])Then, we can set the plot labels to make it more readable:
plt.title('Apartment Count vs. Building Story Level')
plt.xlabel('Number of Apartments in building')
plt.ylabel('Number of Stories (Bouwlaag)')
Then finally, show plot:
plt.show()It should look something like this:
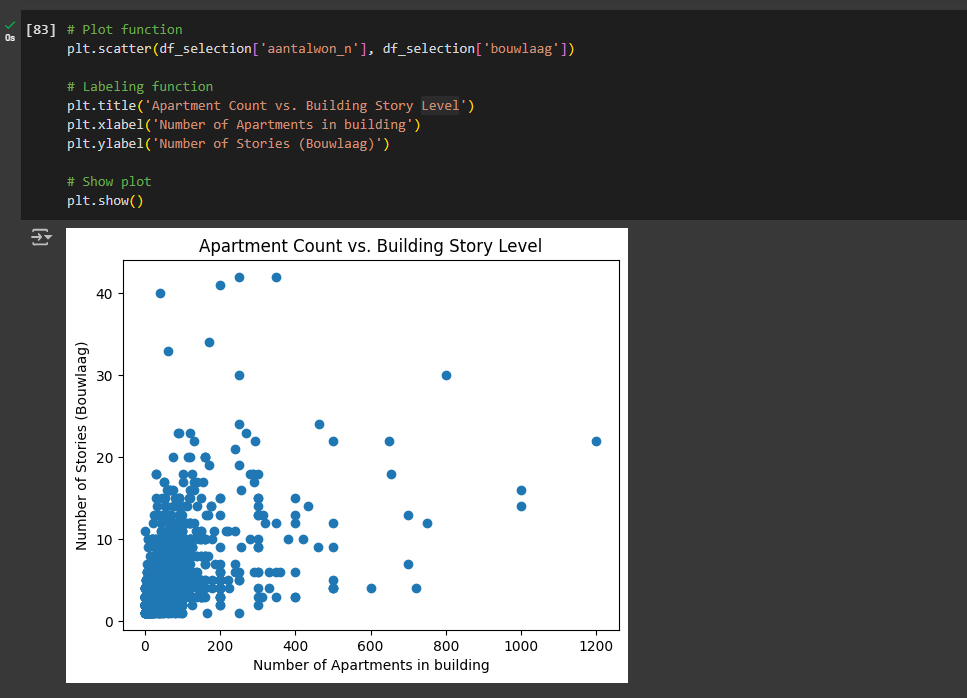
Notice that the scale of the plot is automatically set. Sometimes there are extreme values that don’t seem to be correct, and you want to focus the plot only to a certain scale. To set the scale of the plot to display a specific range of values, you can optionally use this function:
plt.xlim(0, 600)  # Replace with your desired max x value
plt.ylim(0, 30)  # Replace with your desired max y value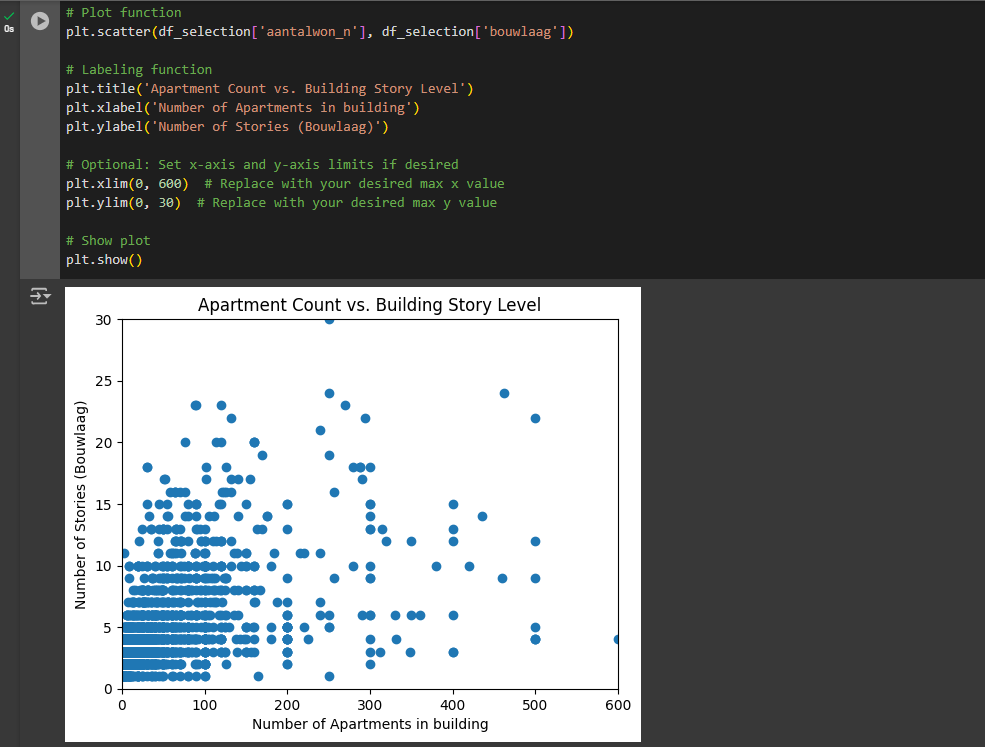
All in all this will be the final result where each building is represented as a dot using x-axis to display number of apartments and y-axis to display number of levels.
You can find more information on the documentation in the Matplotlib user guide on scatterplots.
Additionally, it is also useful to look at this example code for a scatter plot.
Box Plot
A very important graph used for data analysis is the box plot. This plot is used to understand how the data is distributed in the dataset. For example, you can plot the data of the number of stories in a box plot to understand the distribution of the values over the dataset.
To display how the data of df_selection['bouwlaag'] is distributed, we will execute the box plot function:
plt.boxplot(df_selection['bouwlaag'])Then add some labels and show the plot:
plt.title('Boxplot of Story Levels')
plt.ylabel('Values')
plt.show()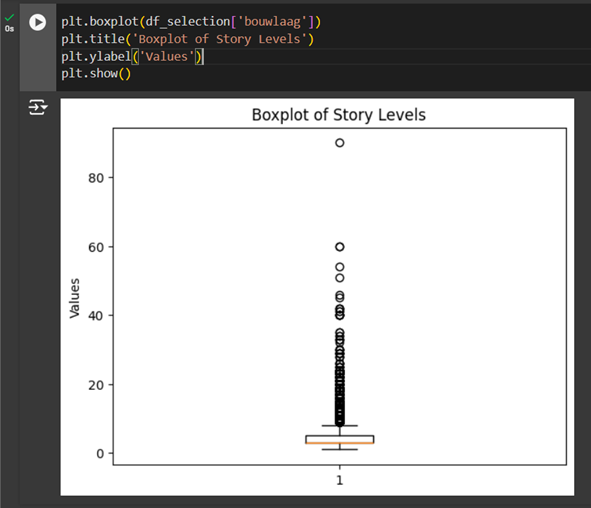
The box represents the middle 50% of the data. We can see that a lot of the data falls outside the ‘whiskers’ which represents the outliers (a.k.a fliers). In the next tutorial we will learn how to clean the dataset by removing extreme values that are called outliers.
You can find more information on the documentation in the Matplotlib user guide on box plots.
Additionally, it is also useful to look at this example code for a box plot.
Getting Started with Python in Google Colab 7/7
Conclusionlink copied
In conclusion, you now have basic skills to import, inspect, and make specific choices about a dataset in Python. The fundamental functions of Python were also introduced to enough level to understand how to use the relevant functions appropriately when handling your dataset and analysing it. Finally, importing data analysis libraries and using them effectively such as Pandas and a quick overview of Matplotlib.
Exercise file
You can download the full script here by clicking on the download button below:
Once downloaded, unzip its content, then add the .ipynb file into your Google Drive, then double-click it. You will then be able to view, run, and edit the script in the web interface of Google Colab.
Write your feedback.
Write your feedback on "Getting Started with Python in Google Colab"".
If you're providing a specific feedback to a part of the chapter, mention which part (text, image, or video) that you have specific feedback for."Thank your for your feedback.
Your feedback has been submitted successfully and is now awaiting review. We appreciate your input and will ensure it aligns with our guidelines before it’s published.
