K-nearest Neighbors Classification with Multiple Labels
-
Intro
-
Overview
-
Code
-
Conclusion
Information
| Primary software used | Jupyter Notebook |
| Course | K-nearest Neighbors Classification with Multiple Labels |
| Primary subject | AI & ML |
| Secondary subject | Machine Learning |
| Level | Beginner |
| Last updated | November 16, 2024 |
| Keywords |
Responsible
| Teachers | |
| Faculty |
K-nearest Neighbors Classification with Multiple Labels 0/3
K-nearest Neighbors Classification with Multiple Labels
Explanation of classification using K-Nearest Neighbor in Jupyter Notebook.
K-Nearest Neighbors (KNN) is a simple, non-parametric algorithm used for classification and regression tasks, which classifies data points based on the majority class of their nearest neighbors. It works by calculating the distance between a point and its k closest points in the dataset, then predicting the label based on the most common label among them.
For this tutorial you need to have installed Python, Jupyter notebooks, and some common libraries including Scikit Learn. Please see the following tutorial for more information.
Exercise file
You can download the notebook version of the file here:
K-nearest Neighbors Classification with Multiple Labels 1/3
Overviewlink copied
To classify inputs using k-nearest neighbors (KNN) classification, it is necessary to have a labeled dataset, the distance metric that should be used to compute the distance between datapoints, and the value of k which is how many nearest neighbors should be reviewed. K-Nearest Neighbors classification associates the class of neighboring datapoints to assign labels. When an unknown datapoint needs to be classified, the distance to all other datapoints is measured. Then, the k nearest neighbors are retrieved and based on which label is most common within this group, a predicted label is determined. The k value is a parameter when generating the model. Below, see how selecting the right k value can impact the classification.
K-nearest Neighbors Classification with Multiple Labels 2/3
Codelink copied
# Import scikit-learn dataset library
 from sklearn  import datasets

# Load dataset
 wine = datasets.load_wine()
As we discussed previously, it can be helpful to print certain characteristics of the dataset. Please see the notebook to see the output of the following cells.
 # print the names of the features
 print(wine.feature_names)
# print the label species (class_0, class_1, class_2)
print(wine.target_names)
# print data(feature)shape
print(wine.data.shape)
# print the wine data (top 5 records)
print(wine.data[0:5])
# print target(or label)
shapeprint(wine.target.shape)
# print the wine labels (0:Class_0, 1:Class_1, 2:Class_3)
print(wine.target)Features and Classification
Remember that K-Nearest Neighbors classification graphs the existing records and associated labels. When an unknown datapoint needs to be classified, the distance to all other datapoints is measured. Then, the k nearest neighbors are retrieved and based on which label is most common within this group, a predicted label is determined. Plot two of the features of the dataset: alcohol and malic_acid. We can see how even with only two of the 13 features, the values given a specific class are located near each other.
import numpy as np
import matplotlib.pyplot as plt

alcohol = wine.data[:, 0]
malic_acid = wine.data[:,1]
classes = wine.target
features = list(zip(alcohol, malic_acid))

# plot the records here
class_0 = np.array([w[0] for w in zip(features, classes) if w[1] == 0])
class_1 = np.array([w[0] for w in zip(features, classes) if w[1] == 1])
class_2 = np.array([w[0] for w in zip(features, classes) if w[1] == 2])

plt.scatter(class_0[:, 0], class_0[:, 1], s=75, c='r', label = "Class 0")
plt.scatter(class_1[:, 0], class_1[:, 1], s=75, c='b', label = "Class 1")
plt.scatter(class_2[:, 0], class_2[:, 1], s=75, c='g', label = "Class 2")
plt.title('Wine')
plt.xlabel('Alcohol')
plt.ylabel('Malic Acid')
plt.legend()
plt.show()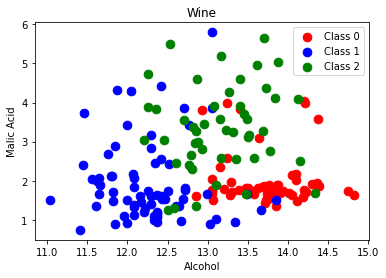
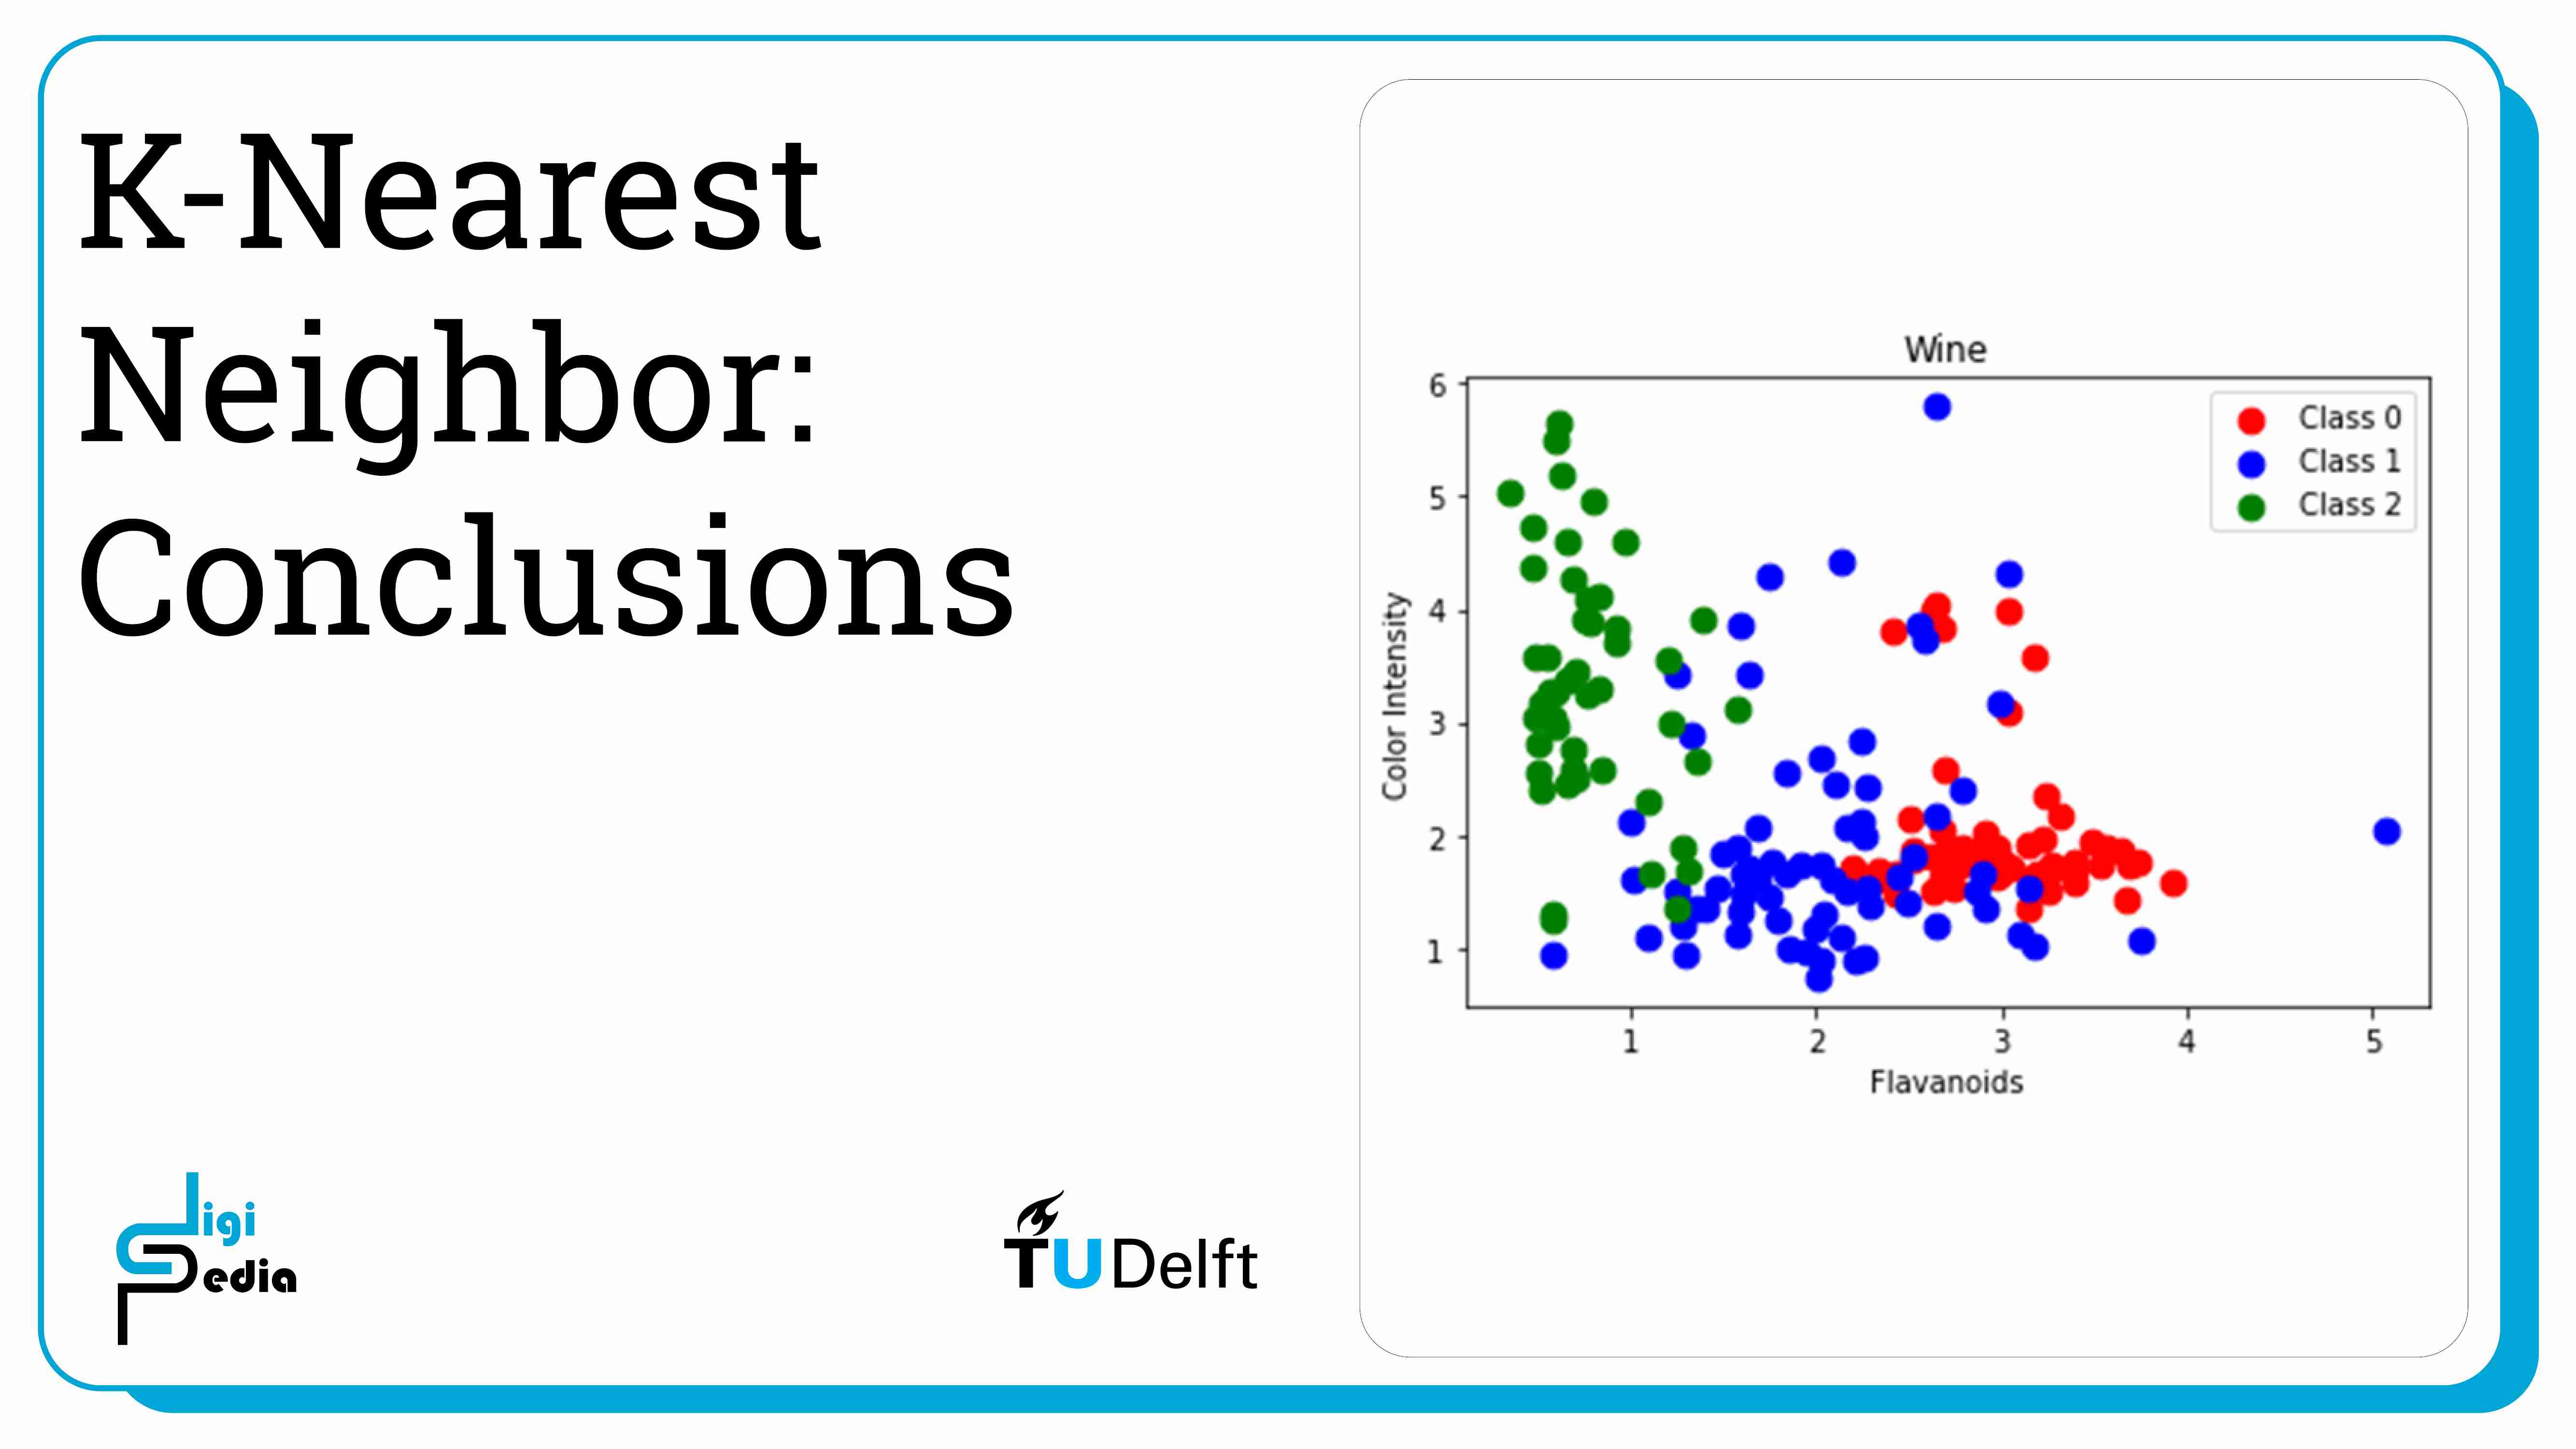
Also plot flavanoids and color_intensity.
import numpy as np
import matplotlib.pyplot as plt

flavanoids = wine.data[:, 6]
color_intensity = wine.data[:,9]
classes = wine.target
features = list(zip(flavanoids, malic_acid))

# plot the records here
class_0 = np.array([w[0] for w in zip(features, classes) if w[1] == 0])
class_1 = np.array([w[0] for w in zip(features, classes) if w[1] == 1])
class_2 = np.array([w[0] for w in zip(features, classes) if w[1] == 2])
plt.scatter(class_0[:, 0], class_0[:, 1], s=75, c='r', label = "Class 0")
plt.scatter(class_1[:, 0], class_1[:, 1], s=75, c='b', label = "Class 1")
plt.scatter(class_2[:, 0], class_2[:, 1], s=75, c='g', label = "Class 2")
plt.title('Wine')
plt.xlabel('Flavanoids')
plt.ylabel('Color Intensity')
plt.legend()
plt.show()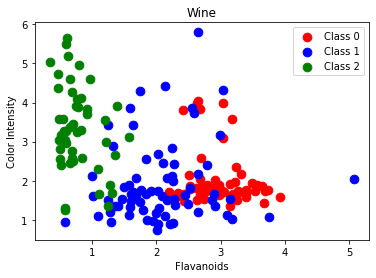
Train a classifier using a 70:30 train test split and print the accuracy.
# Import required functions
from sklearn.datasets
import make_classification
from sklearn.linear_model import LogisticRegression
from sklearn.model_selection import train_test_split
from sklearn.pipeline import make_pipeline
from sklearn.preprocessing import StandardScaler

# Split dataset into training set and test set8
X_train, X_test, y_train, y_test = train_test_split(wine.data, wine.target, test_size=0.3) # 70% training and 30% test

# Make pipeline for normalizing data
pipe = make_pipeline(StandardScaler(), LogisticRegression())
pipe.fit(X_train, y_train)

# apply scaling on training data
pipe.score(X_test, y_test)  # apply scaling on testing data, without leaking training data.
The output states the accuracy. The output is:
0.9629629629629629
The k value is a parameter when generating the model. It is necessary to test a number of options for k because having a small value may increase the classifier’s sensitivity to noise and having large value may lead to datapoints from other classes being included and impacting the accuracy.
# Import knearest neighbors Classifier model
from sklearn.neighbors import KNeighborsClassifier

# Create KNN Classifier
knn = KNeighborsClassifier(n_neighbors=5)

# Train the model using the training sets
knn.fit(X_train, y_train)

# Predict the response for test dataset
y_pred = knn.predict(X_test)print(y_pred)
The output states the classifications. The output is:
[1 2 0 1 2 2 0 2 2 0 1 0 1 2 0 0 1 2 1 2 1 1 0 0 0 0 0 1 2 0 1 1 0 2 2 1 2 2 2 2 1 2 1 0 0 1 0 1 2 0 0 2 0 0]
# Import scikit-learn metrics module for accuracy calculation
from sklearn import metrics

# Model Accuracy, how often is the classifier correct?
print("Accuracy:",metrics.accuracy_score(y_test, y_pred))

# Import scikit-learn metrics module for confusion matrix
from sklearn import metrics

# Which classes are commonly misclassified?
print('Confusion Matrix')print(metrics.confusion_matrix(y_test, y_pred, labels=[0, 1, 2]))
The output is:
Accuracy: 0.6851851851851852
Confusion Matrix
[[16 0 1]
[ 4 14 10]
[ 0 2 7]]
As discussed, changing the k value changes the accuracy of the predictions. When K is too large, the classifier is less accurate.
# Import knearest neighbors Classifier model
from sklearn.neighbors import KNeighborsClassifier

# Create KNN Classifier
knn = KNeighborsClassifier(n_neighbors=12)

# Train the model using the training sets
knn.fit(X_train, y_train)

# Predict the response for test dataset
y_pred = knn.predict(X_test)

# Import scikit-learn metrics module for accuracy calculation
from sklearn import metrics

# Model Accuracy, how often is the classifier correct?
print("Accuracy:",metrics.accuracy_score(y_test, y_pred))

# Import scikit-learn metrics module for confusion matrix
from sklearn import metrics

# Which classes are commonly misclassified?
print('Confusion Matrix')
print(metrics.confusion_matrix(y_test, y_pred, labels=[0, 1, 2]))
The output is:
Accuracy: 0.6851851851851852
Confusion Matrix
[[16 0 1]
[2 14 12]
[ 1 1 7]]
TASK: Now that you know how to train a classifier and check the accuracy, try plotting the k value against the accuracy of the trained model.
K-nearest Neighbors Classification with Multiple Labels 3/3
Conclusionlink copied
- K-Nearest Neighbors classification measures the distance from a new record to the existing records, retrieves the k nearest neighbors, and predicts a label based on which label is most common within this group.
- The k value is a parameter when generating the model and should be tested and adjusted.
- A k value that is too small may increase the classifier’s sensitivity to noise and a k value that is too large may lead to datapoints from other classes being included and impacting the accuracy.
Write your feedback.
Write your feedback on "K-nearest Neighbors Classification with Multiple Labels"".
If you're providing a specific feedback to a part of the chapter, mention which part (text, image, or video) that you have specific feedback for."Thank your for your feedback.
Your feedback has been submitted successfully and is now awaiting review. We appreciate your input and will ensure it aligns with our guidelines before it’s published.
